. 2023 Mar 13;14(1):1376.
doi: 10.1038/s41467-023-36945-8.

TRAK adaptors regulate the recruitment and activation of dynein and kinesin in mitochondrial transport

Affiliations

TRAK adaptors regulate the recruitment and activation of dynein and kinesin in mitochondrial transport

John T Canty et al. Nat Commun. .

Abstract

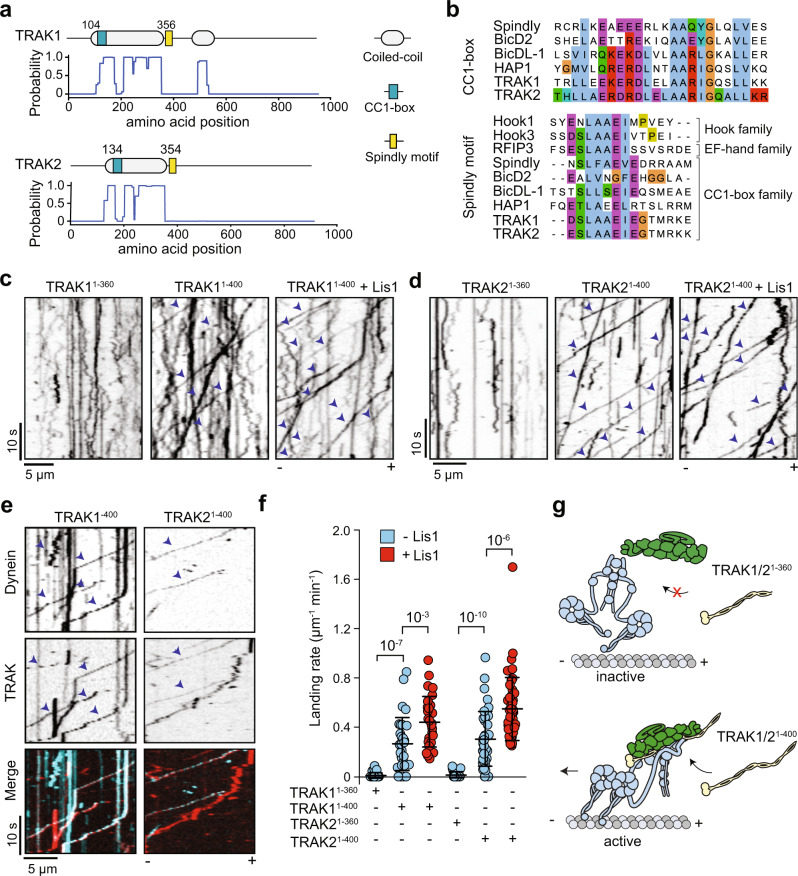
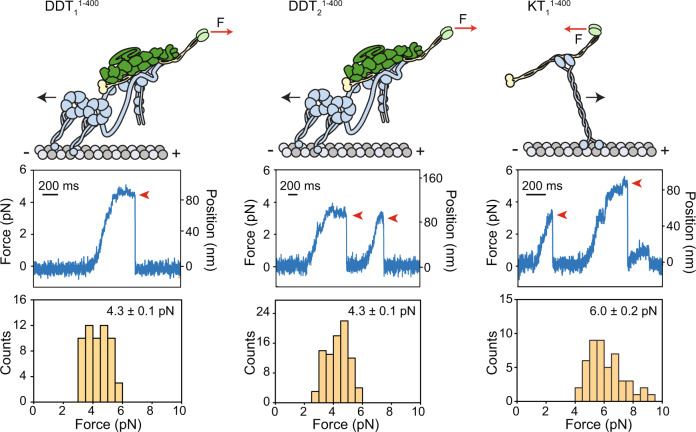
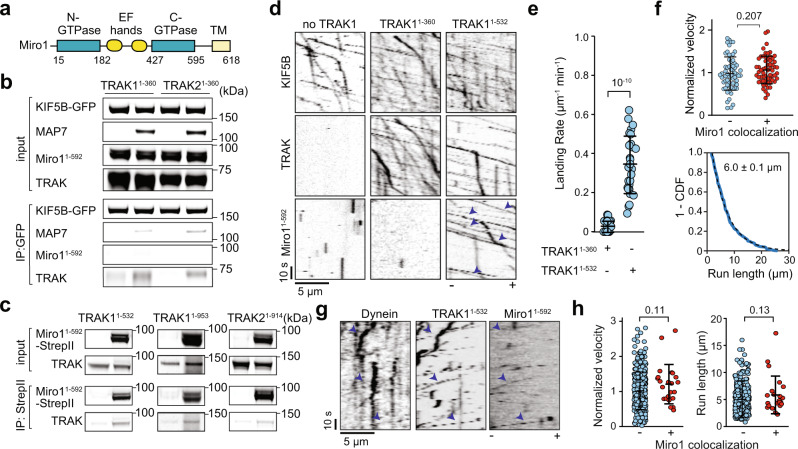
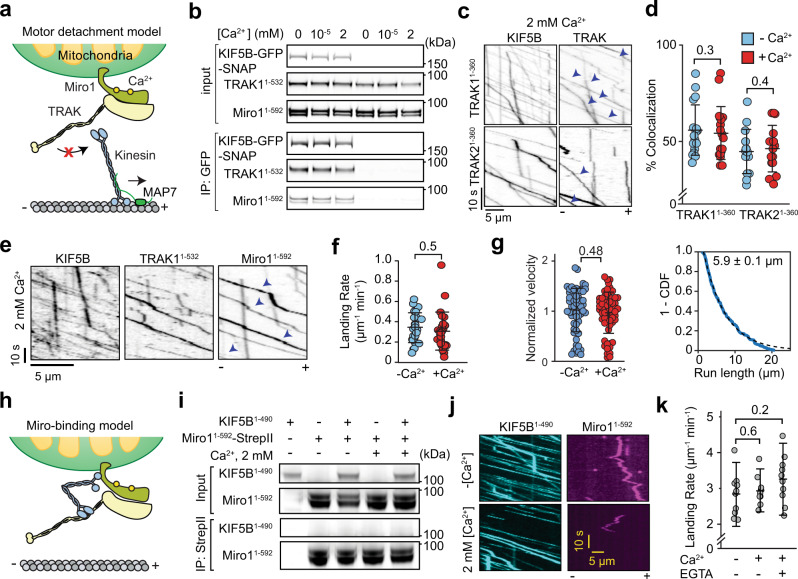
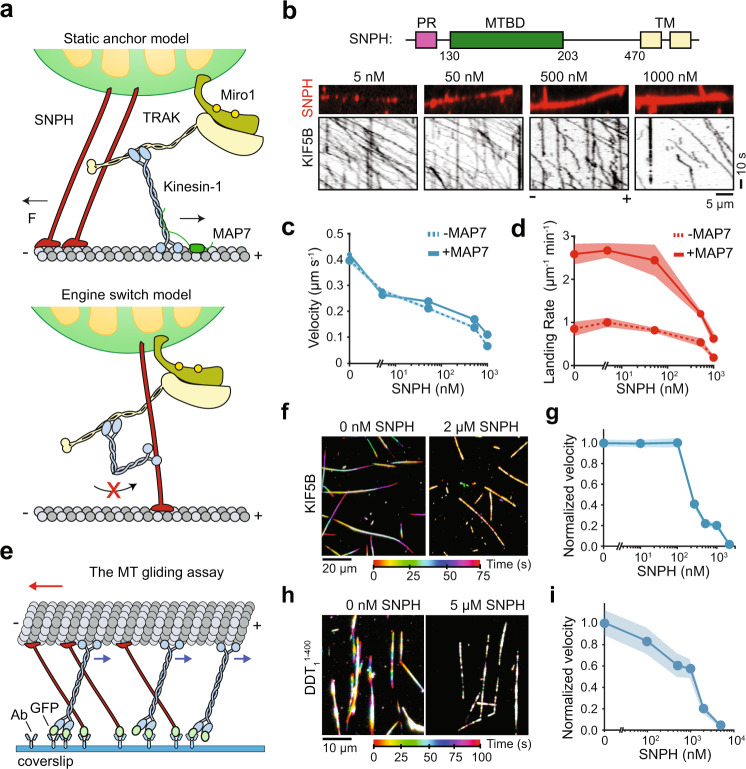
Mitochondrial transport along microtubules is mediated by Miro1 and TRAK adaptors that recruit kinesin-1 and dynein-dynactin. To understand how these opposing motors are regulated during mitochondrial transport, we reconstitute the bidirectional transport of Miro1/TRAK along microtubules in vitro. We show that the coiled-coil domain of TRAK activates dynein-dynactin and enhances the motility of kinesin-1 activated by its cofactor MAP7. We find that TRAK adaptors that recruit both motors move towards kinesin-1's direction, whereas kinesin-1 is excluded from binding TRAK transported by dynein-dynactin, avoiding motor tug-of-war. We also test the predictions of the models that explain how mitochondrial transport stalls in regions with elevated Ca2+. Transport of Miro1/TRAK by kinesin-1 is not affected by Ca2+. Instead, we demonstrate that the microtubule docking protein syntaphilin induces resistive forces that stall kinesin-1 and dynein-driven motility. Our results suggest that mitochondrial transport stalls by Ca2+-mediated recruitment of syntaphilin to the mitochondrial membrane, not by disruption of the transport machinery.


Conflict of interest statement

The authors declare no competing interests.

Figures

Fig. 1
Fig. 1. TRAK coiled-coil domains activate dynein-dynactin motility.
a Domain organization and coiled-coil prediction score of human TRAK1 and TRAK2. b Sequence alignment shows the conserved CC1 box (top) and the Spindly motif (bottom) of TRAK1 and TRAK2 with other activating adaptors of human dynein-1. The sequences were aligned using the Clustal Omega algorithm. c, d Representative kymographs of TRAK1 (c) and TRAK2 (d) constructs labeled with the LD655 dye in the presence of unlabeled dynein/dynactin (DD) with or without 1 µM Lis1. Arrowheads highlight processive motility. e Representative kymographs of LD655-dynein and LD555-TRAK constructs in the presence of unlabeled dynactin. Arrowheads represent TRAK-dynein colocalization. The processive motility of TRAK not colocalizing with dynein is due to less than 100% labeling efficiency of dynein. f The landing rate of motor complexes on MTs. The centerline and whiskers represent mean and s.d., respectively (n = 30, 32, 31, 31, 44, and 48 MTs from left to right). P values are calculated from a two-tailed t-test. g TRAK is an activating adaptor of dynein-dynactin. Activation of dynein motility requires both the CC1 box and the Spindly motif in the TRAK coiled-coil.
Fig. 2
Fig. 2. Kinesin recruits TRAK adaptors more efficiently following activation by MAP7.
a In vitro immunoprecipitation (IP) of purified kinesin (KIF5B-GFP-SNAPf), TRAK11–360, and TRAK21–360 in the presence or absence of 10 nM MAP7. The proteins were eluted from anti-GFP beads. b Representative two-color kymographs of KIF5B and TRAK constructs with increasing concentrations of MAP7. The processive motility of TRAK not colocalizing with kinesin is due to less than 100% labeling of kinesin. c, The landing rate of kinesin in the absence and presence of 5 nM TRAK11–360 or TRAK21–360 under increasing MAP7 concentrations a(n = 10, 10, 10, 10, 10, 20, 20, 15, 20, 20, 25, and 20 MTs from left to right, two independent trials). d (Top) Velocity histogram (mean ± s.e.m.) and (Bottom) the inverse cumulative distribution function (1-CDF) of motor run length for K (n = 88), KT11–360 (n = 404), and KT21–360 (n = 499, three independent experiments) in 10 nM MAP7. Fits to a single exponential decay (dashed curves) reveal the motor run length (±s.e.). e Representative two-color kymographs of LD555-kinesin with increasing concentrations of LD655-labeled TRAK11–360 or TRAK21–360 in the presence or absence of MAP7. A higher MAP7 concentration (50 nM) was used for TRAK2 because kinesin runs remained infrequent at a lower MAP7 concentration (5 nM). f The landing rate of kinesin with increasing concentrations of TRAK adaptors. The centerline and whiskers represent mean and s.d., respectively (n = 12, 12, 12, 13, 10, 13, 11, 12, and 11 MTs from left to right, three independent trials). g TRAK recruits kinesin, but activation of KT motility requires a kinesin-1 cofactor, MAP7. In (c) and (f), the center line and whiskers represent the mean and s.d., respectively. P-values are calculated from a two-tailed t-test. In (f), p values are calculated in comparison to the no TRAK condition.
Fig. 3
Fig. 3. Force generation of dynein-dynactin or kinesin assembled with TRAK adaptors.
(Top) Single motor complexes were pulled from the TRAK adaptor by an optically trapped bead (not shown; F: force). (Middle) Representative traces of beads driven by a single KT or DDT complex in a fixed-trap assay. Red arrowheads represent the detachment of the motor from an MT after the stall. (Bottom) Stall force histograms (mean ± s.e.m.) of DDT11–400 (n = 62 stalls from 15 beads in 7 independent experiments), DDT21–400 (n = 86 stalls from 14 beads in 6 independent experiments) and KT11–400 (n = 55 stalls from 14 beads in 6 independent experiments).
Fig. 4
Fig. 4. TRAK adaptors simultaneously recruit dynein-dynactin and kinesin.
a Representative kymographs of Alexa488-kinesin, LD555-TRAK11–400, and LD655-dynein in the presence of 0, 5, and 10 nM MAP7. White arrowheads show colocalization of dynein, kinesin, and TRAK. Yellow arrowheads highlight the plus-end-directed movement of dynein and TRAK by unlabeled kinesin. Magenta arrowheads represent the minus-end-directed movement of dynein and TRAK. b The velocity distribution of complex assemblies at 0, 5, and 10 nM MAP7. Negative velocities correspond to minus-end-directed motility. (n = 5, 138, 11, 43, 130, 2104, 79, 117, and 1342 from top to bottom, three independent experiments per condition). c Representative kymographs of Alexa488-kinesin, LD555-TRAK21–400, and LD655-dynein on a surface-immobilized MT in the presence of 5 nM MAP7. Assays were performed in the absence of Lis1. Yellow arrowheads show colocalization of dynein, kinesin, and TRAK2. d The velocity distribution of complex assemblies at 5 nM MAP7 and 0 nM Lis1 (n = 3, 67, and 206 from top to bottom, three independent experiments per condition). e The fraction of complexes formed with TRAK11–400 under different MAP7 concentrations. f Sample kymographs of 0.5 nM DDT11–400 assemblies in the presence of 1 µM Lis1 and increasing concentrations of KIF5BΔ1-336. Processive runs of LD655-dynein are highlighted with blue arrowheads. g The landing rates of 0.5 nM DDT11–400 assemblies under increasing concentrations of KIF5BΔ1-336 (n = 28, 45, 27, 50, and 51 MTs from left to right; two independent experiments per condition). h Schematic representation of motor coordination on TRAK. When kinesin transports TRAK, dynein can remain as an inactive passenger, but kinesin is excluded from minus-end directed DDT complexes. In (b), (d), and (g), the center line and whiskers represent the mean and s.d., respectively. P-values are calculated from a two-tailed t-test.
Fig. 5
Fig. 5. Miro1 is transported by KT and DDT complexes.
a Miro1 binds to GTP at its GTPase domains and Ca2+ ions at its EF-hands and localizes to the outer mitochondrial membrane through its transmembrane (TM) domain. b In vitro immunoprecipitation of purified KIF5B-GFP-SNAPf, TRAK11–360 or TRAK21–360, Miro11–592 with or without MAP7. c, In vitro immunoprecipitation of purified Miro11–592-StrepII and either TRAK11–532, full-length TRAK11–953, or full-length TRAK21–914 in the presence of GTPγS. KIF5B-GFP-SNAPf was present in all conditions. d Kymographs of Alexa488-KIF5B and LD655-Miro11–592 in the absence of a TRAK adaptor or the presence of LD555-TRAK11–360 or TRAK11–532. Assays were conducted at 10 nM MAP7. Arrowheads show colocalization of Miro1 to TRAK. e The landing rate of KTM co-localizers in the presence of different TRAK constructs (n = 27 MTs for each condition, three independent trials). f (Top) Normalized velocity distribution of KT complexes that localize or not localize with Miro1 (n = 65 and 61 from left to right). (Bottom) 1-CDF of motor run length for KTM complexes (n = 209, three independent experiments). Fits to a single exponential decay (dashed curves) reveal the motor run length (±s.e.). g Representative kymographs of LD488-dynein, LD555-TRAK11–532, and LD655-Miro11–592 in the presence of unlabeled dynactin and 1 µM Lis1. The arrowheads show colocalization of dynein, TRAK1, and Miro1. h The velocity and run length of DDT11–532 that colocalize or not colocalize with Miro1 (n = 349 and 23 from left to right). Assays were conducted in 1 µM Lis1 and the absence of Ca2+. In (e), (f), and (h), the center line and whiskers represent mean and s.d., respectively. P-values are calculated from a two-tailed t-test.
None
Fig. 6 Kinesin-driven transport of Miro1/TRAK1 is not disrupted by Ca2+.
a The motor detachment model predicts that Ca2+ binding to Miro1 triggers dissociation of kinesin from TRAK. b In vitro immunoprecipitation of KIF5B-GFP-SNAPf, TRAK11–532, and Miro11–592 in 0, 100 nM, or 2 mM Ca2+. c Representative kymographs show colocalization of LD555-KIF5B and LD655-TRAK adaptors in 2 mM Ca2+ and 10 nM MAP7. Arrowheads show colocalization of TRAK to processive kinesins. d The percentage of kinesin runs that colocalize with TRAK on MTs in the presence or absence of 2 mM Ca2+ (n = 15, 15, 12, and 12 MTs from left to right, three independent trials). e A representative kymograph of Alexa488-KIF5B, LD555-TRAK11–532, and LD655-Miro11–592 in 2 mM Ca2+ and 10 nM MAP7. Arrowheads show colocalization of Miro1 to TRAK. f, The landing rate of KTM complexes in the presence or absence of 2 mM Ca2+ (n = 27 MTs for each condition, three independent trials). g (Left) Normalized velocity distribution of KTM complexes in the presence or absence of 2 mM Ca2+. (Right) 1-CDF of motor run length for KTM complexes in 2 mM Ca2+ (n = 189, three independent experiments). Fits to a single exponential decay (dashed curves) reveal the motor run length (±s.e.). h The Miro-binding model predicts that Ca2+ binding to Miro1 triggers the binding of the kinesin motor domain to Miro1. i In vitro immunoprecipitation assays show no interaction between purified KIF5B1–490 and Miro11–592-SNAPf-StrepII in the presence and absence of 2 mM Ca2+. j Kymographs show that KIF5B1–490 does not colocalize with Miro1 in the presence or absence of 2 mM Ca2+. Assays were performed in the absence of TRAK adaptors and MAP7. k The landing rate of KIF5B1–490 in the presence or absence of 2 mM Ca2+ and Ca2+-chelating agent EGTA (n = 10 MTs for all conditions, three independent trials). In (d), (f), (g), and (k), the center line and whiskers represent mean and s.d., respectively. P values are calculated from a two-tailed t-test.
Fig. 7
Fig. 7. SNPH stalls MT gliding driven by kinesin and dynein motors.
a Static anchor, and engine switch models for SNPH-mediated stalling of mitochondrial transport. b (Top) Domain organization of human SNPH (MTBD: MT-binding domain, PR: proline-rich domain). (Middle) SNPH decorates surface-immobilized MTs. (Bottom) Representative kymographs of kinesin motility in the presence of increasing concentrations of SNPH. The assays were conducted in 10 nM MAP7. c The average velocity of kinesin on SNPH-decorated MTs in the presence (± s.e.m., n = 98, 158, 95, 58, and 20 from left to right) and absence of 10 nM MAP7 (n = 115, 191, 154, 93, and 59 from left to right). d The landing rate of kinesin onto SNPH-decorated MTs in the presence and absence of 10 nM MAP7 (mean ± s.e.m., n = 9 MTs for each condition, three independent trials). e Schematic of the MT gliding by kinesin motors. Motors were fixed on the glass surface from their tail through a GFP-antibody linkage. MTs glide with their minus-ends in the lead (red arrow) due to the plus-end directed motility of kinesins (blue arrows). Static binding of SNPH to MT exerts resistive forces against gliding motility. f Representative color-coded time projections of Cy5-MTs glided by KIF5B-GFP-SNAPf in the presence or absence of 2 µM SNPH-sfGFP. g MT gliding velocities of kinesin motors under increasing SNPH-sfGFP concentration (mean ± s.e.m., n = 50, 57, 58, 59, 71, 70, 61 MTs from left to right, two independent trials). h, Representative color-coded time projections of Cy5-MTs with DDT assembled with TRAK11–400-GFP in the presence or absence of 5 µM SNPH-sfGFP. Assays were conducted in 1 µM Lis1. i MT gliding velocities of DDT complexes under increasing SNPH-sfGFP concentration (mean ± s.e.m., n = 60, 61, 67, 72, 64, 60 MTs from left to right, three independent trials).
Fig. 8
Fig. 8. A model for bidirectional transport and Ca2+-mediated arrest of mitochondria in neurons.
Mitochondria are transported anterogradely by active kinesin motors recruited by TRAK1 while dynein-dynactin is transported as an inactive passenger. In regions with high Ca2+ concentration (red), mitochondria recruit SNPH, which anchors the mitochondria to the MT and stalls the transport machinery. Retrograde transport is initiated by the dissociation of kinesin from TRAK, followed by activation of the DDT complex.

References

    1. Sheng ZH, Cai Q. Mitochondrial transport in neurons: impact on synaptic homeostasis and neurodegeneration. Nat. Rev. Neurosci. 2012;13:77–93. doi: 10.1038/nrn3156. - DOI - PMC - PubMed
    1. Wong YC, Holzbaur EL. The regulation of autophagosome dynamics by huntingtin and HAP1 is disrupted by expression of mutant huntingtin, leading to defective cargo degradation. J Neurosci. 2014;34:1293–1305. doi: 10.1523/JNEUROSCI.1870-13.2014. - DOI - PMC - PubMed
    1. Guo X, et al. The GTPase dMiro is required for axonal transport of mitochondria to Drosophila synapses. Neuron. 2005;47:379–393. doi: 10.1016/j.neuron.2005.06.027. - DOI - PubMed
    1. Glater EE, Megeath LJ, Stowers RS, Schwarz TL. Axonal transport of mitochondria requires milton to recruit kinesin heavy chain and is light chain independent. J. Cell. Biol. 2006;173:545–557. doi: 10.1083/jcb.200601067. - DOI - PMC - PubMed
    1. Macaskill AF, et al. Miro1 is a calcium sensor for glutamate receptor-dependent localization of mitochondria at synapses. Neuron. 2009;61:541–555. doi: 10.1016/j.neuron.2009.01.030. - DOI - PMC - PubMed

Publication types

MeSH terms