. 2023 Mar 13;14(1):1394.
doi: 10.1038/s41467-023-37029-3.

An anti-HER2 biparatopic antibody that induces unique HER2 clustering and complement-dependent cytotoxicity

Affiliations

An anti-HER2 biparatopic antibody that induces unique HER2 clustering and complement-dependent cytotoxicity

Nina E Weisser et al. Nat Commun. .

Abstract

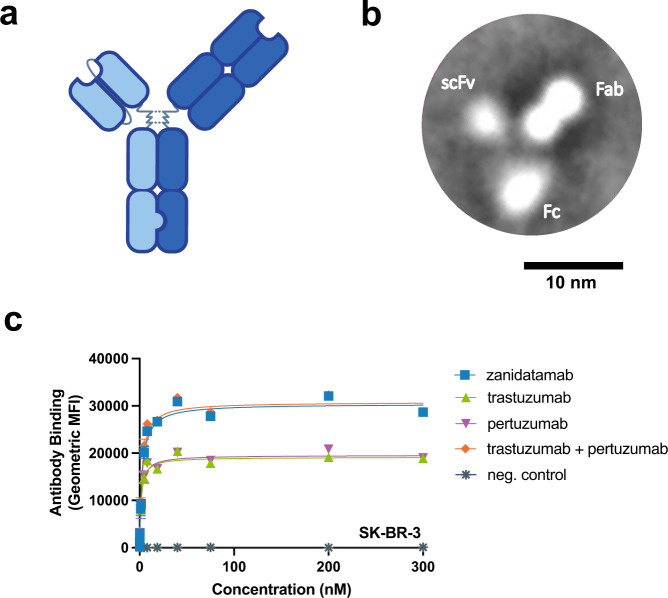
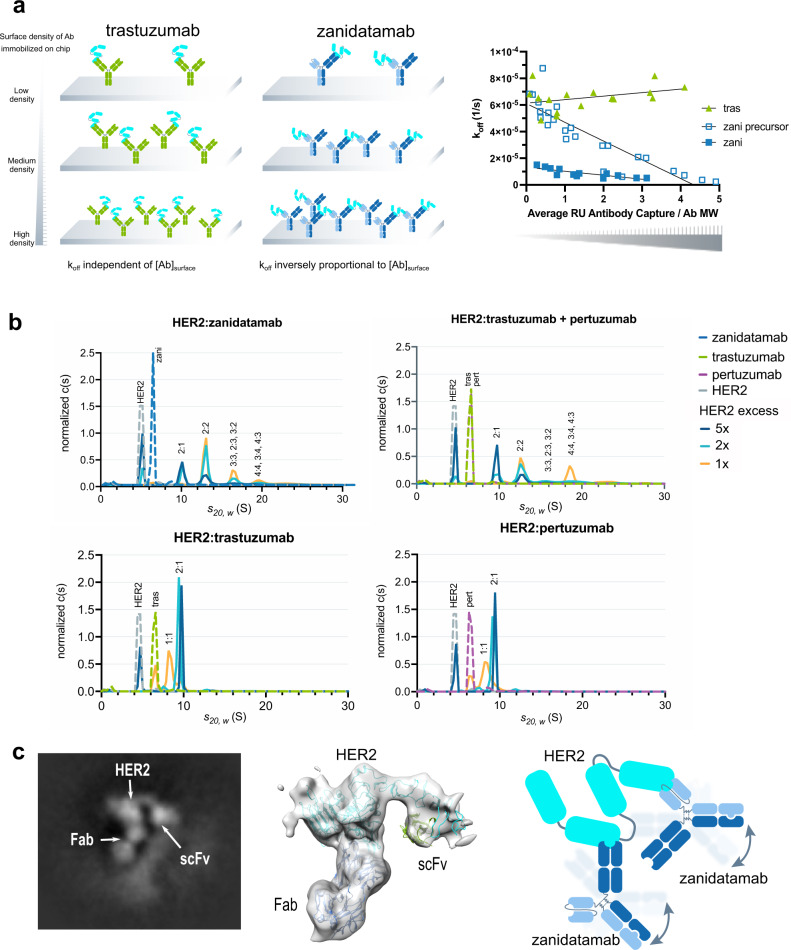
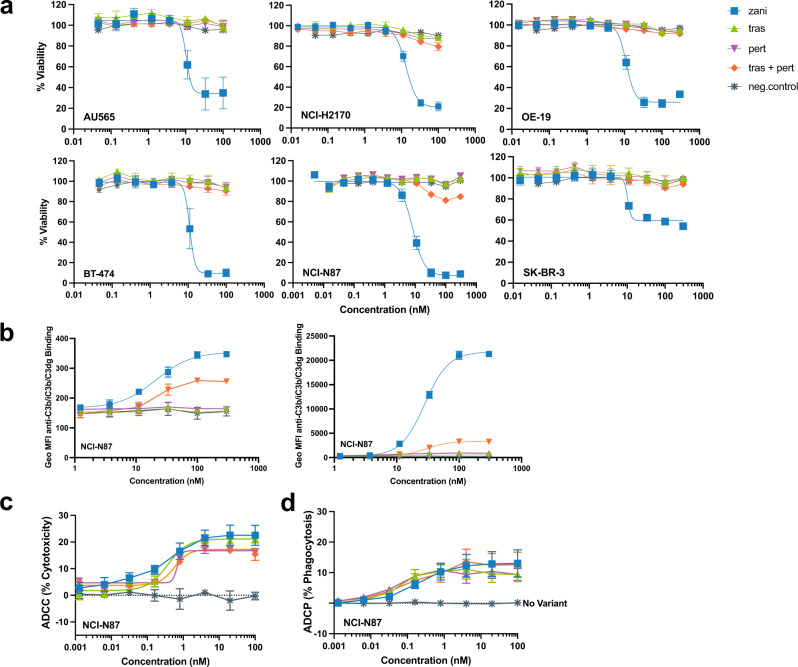
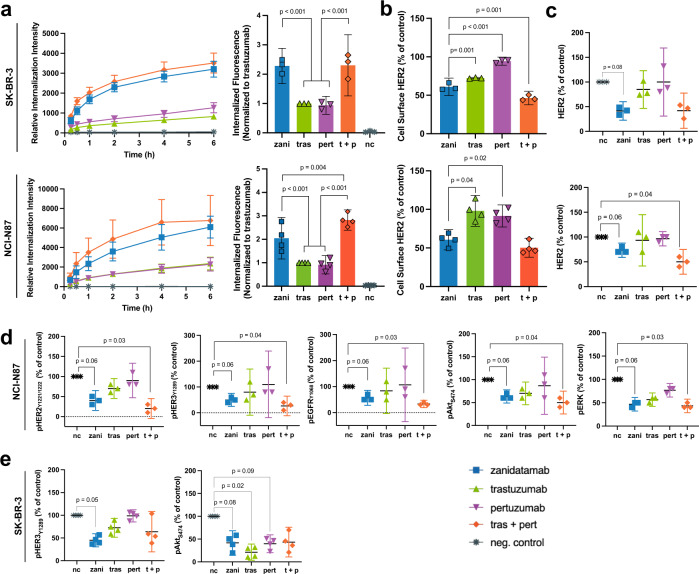
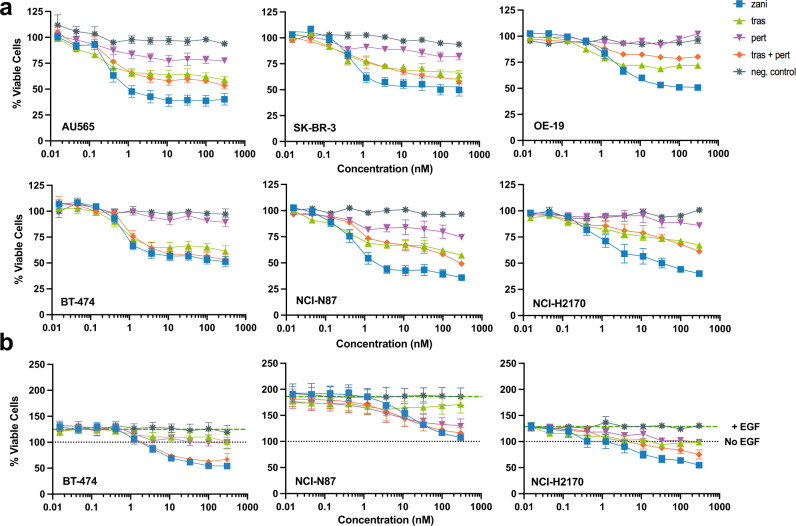
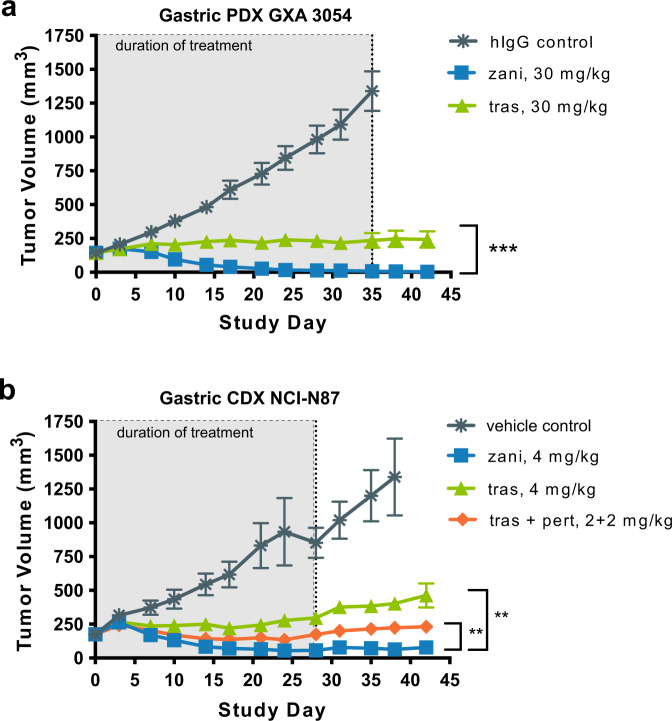
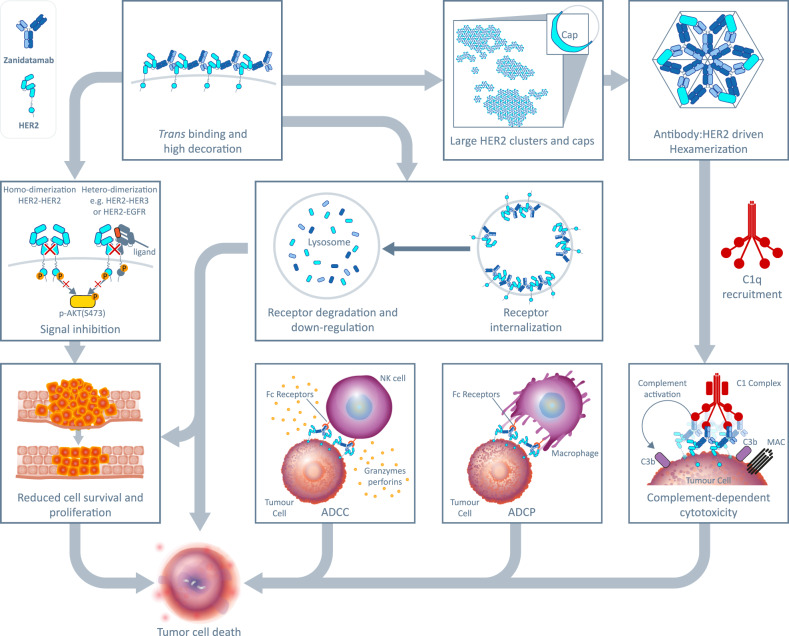
Human epidermal growth factor receptor 2 (HER2) is a receptor tyrosine kinase that plays an oncogenic role in breast, gastric and other solid tumors. However, anti-HER2 therapies are only currently approved for the treatment of breast and gastric/gastric esophageal junction cancers and treatment resistance remains a problem. Here, we engineer an anti-HER2 IgG1 bispecific, biparatopic antibody (Ab), zanidatamab, with unique and enhanced functionalities compared to both trastuzumab and the combination of trastuzumab plus pertuzumab (tras + pert). Zanidatamab binds adjacent HER2 molecules in trans and initiates distinct HER2 reorganization, as shown by polarized cell surface HER2 caps and large HER2 clusters, not observed with trastuzumab or tras + pert. Moreover, zanidatamab, but not trastuzumab nor tras + pert, elicit potent complement-dependent cytotoxicity (CDC) against high HER2-expressing tumor cells in vitro. Zanidatamab also mediates HER2 internalization and downregulation, inhibition of both cell signaling and tumor growth, antibody-dependent cellular cytotoxicity (ADCC) and phagocytosis (ADCP), and also shows superior in vivo antitumor activity compared to tras + pert in a HER2-expressing xenograft model. Collectively, we show that zanidatamab has multiple and distinct mechanisms of action derived from the structural effects of biparatopic HER2 engagement.


Conflict of interest statement

Zymeworks Inc. has filed patent applications relating to zanidatamab: PCT/CA2014/051140 (N.E.W., G.N., G.W., S.D., E.E.C., and M.S. are listed as inventors) and PCT/CA2015/051238 (N.E.W., G.N., G.W. are listed as inventors). These applications have issued in several jurisdictions, including the United States [US 10,000,576; US 10,947,319; US 11,325,981] and Japan [JP 6727379; JP 6817064; JP 6872482]. The other authors declare no competing interests.

Figures

Fig. 1
Fig. 1. Zanidatamab is a biparatopic anti-HER2 Ab that binds HER2-expressing tumor cells with greater Ab saturation than trastuzumab or pertuzumab.
a Zanidatamab is a humanized, biparatopic, immunoglobulin 1 (IgG1)-like Ab with an scFv (light blue) that binds the juxtamembrane ECD4 of HER2 and a Fab (dark blue) that binds the ECD2 dimerization domain of HER2, the same domains targeted by trastuzumab and pertuzumab, respectively. b Representative class-averaged TEM image, derived from 216 images, showing the 3-lobed structure of zanidatamab with putative assignments of the scFv, Fab, and Fc region from a single experiment. c Zanidatamab binds with greater Ab saturation to tumor cell lines compared to trastuzumab or pertuzumab. Flow cytometry was used to quantify the binding of zanidatamab, trastuzumab, pertuzumab, and tras + pert (1:1) to SK-BR-3 tumor cells. In c, data are mean ± SEM from n = 3 independent experiments. Gating strategy for Ab binding to SK-BR-3 cells (c) is shown in Supplementary Fig. 11a. Source data are provided in the Source Data file.
Fig. 2
Fig. 2. Zanidatamab binds HER2 in trans and forms large Ab:HER2 complexes in solution.
a Cartoon depicts the SPR experimental set up to distinguish between cis and trans Ab:receptor binding. The dissociation constant koff for the monospecific anti-HER2 Ab control (left) is expected to be independent of Ab surface density; the same is expected for a biparatopic Ab binding in cis. For a biparatopic Ab binding in trans, crosslinking of receptor is expected to increase with increasing Ab chip densities (right), causing koff to decrease. Reduction in koff observed with increasing zanidatamab and zanidatamab precursor surface concentrations, but not for the control trastuzumab, shows ability of zanidatamab and zanidatamab precursor to bind HER2 in trans (right, see Supplementary Table 3). Data from two independent experiments are shown. b AUC results for mixtures of HER2 ECD with anti-HER2 Abs at 1-, 2- and 5-fold HER2 excess. For reference, HER2 ECD and Abs were run separately and plotted with the HER2:Ab mixtures. For zanidatamab and tras + pert, higher order complexes were detected with increasing amounts when the excess of HER2 ECD was reduced. Tras or pert formed mainly 1:1 and 2:1 HER2:Ab complexes and only trace amounts of higher order complexes were detected. Complex compositions larger than 2:1 (HER2:Ab) are approximate. c Representative cryo-EM 2D class average, 3D reconstruction at 7.6 Å; resolution (middle) showing a core HER2 molecule bound to zanidatamab Fab and scFv, and a cartoon representation of the zanidatamab:HER2 complex observed by cryo-EM (right). The fuzzy halo observed in the 2D images is likely due to the Fc domain in multiple conformations. A model of HER2 (cyan) in complex with zanidatamab Fab (green) and scFv (blue) is also shown. The distance between the C-termini of the two antigen-binding domains cannot be spanned by a single zanidatamab molecule (see Supplementary Fig. 4). Because this structural constraint prevents zanidatamab from binding to HER2 in cis, a single zanidatamab molecule can only bind in trans and crosslink two HER2 molecules by binding to the ECD2 on one and the ECD4 on another. Source data are provided in the Source Data file.
Fig. 3
Fig. 3. Zanidatamab binding induces HER2 capping and the formation of large HER2 clusters on the cell surface.
a Illustration showing zanidatamab bound in trans to ECD2 and ECD4 of two HER2 molecules along with the anti-HER2 ECD1-AF647 used to detect HER2 localization following Ab treatment. HER2 extracellular domains ECD1-4 and tyrosine kinase (TK) domains are labeled. b Graphical representation of cell surface HER2 caps vis-a-vis microclusters and representative 3D reconstructed confocal microscopy images. c, d SK-BR-3 cells were treated with 200 nM anti-HER2 or negative control (NC) Ab palivizumab for the indicated times. Cells where then imaged by confocal microscopy following HER2 detection with 74 nM anti-HER2 ECD1-AF647 OAA (fluor to Ab ratio of 8.9). Percent of cells exhibiting microclusters or caps is shown as the mean ± SEM for three independent experiments (c). Representative confocal images are shown from 30-43 images (185-351 cells) per Ab treatment condition from three independent experiments, scale bar = 10 μm (d). (e) SK-BR-3 cells were treated with 200 nM anti-HER2 Abs or control Ab for 15 min and imaged by dSTORM super-resolution microscopy. Upper row shows HER2 dSTORM localizations (detected with 148 nM anti-HER2 ECD1-AF647 OAA) in representative ROIs. Color bars = localization density. Lower row shows HER2 clusters identified by the StormGraph clustering algorithm and color-coded by cluster areas (nm2). Scale bar = 500 nm. For each Ab treatment condition, 55-124 images (ROI) from multiple cells were imaged. f The number of localizations per cluster is graphed versus cluster area and the best-fit linear regression is shown. g Percent of clusters with > 1500 localizations. Numbers above the bars are fold-difference versus NC. h The mean cluster area was determined for each ROI. The violin plot shows the distributions of mean cluster areas for each Ab treatment. Pairwise comparisons were performed using a two-sided non-paired t-test on a log10 scale and p values were corrected using the Bonferroni method. Black brackets indicate comparison and p value (zani vs. tras df = 133, p = 0.005; zani vs. pert df = 135, zani vs. tras + pert (1:1) df = 147, and zani vs. NC df = 116, p < 0.001). Source data are provided in the Source Data file.
Fig. 4
Fig. 4. Zanidatamab mediates Fc effector functions including potent CDC, and ADCC and ADCP.
a Zanidatamab mediated CDC with normal human serum (NHS) in high HER2-expressing tumor cells (AU565, NCI-H2170, OE-19, NCI-N87, BT-474, SK-BR-3; HER2 3+); trastuzumab, pertuzumab, and tras + pert (1:1) are inactive. b Zanidatamab mediated the highest C1q and C3 fragment (C3b/iC3b/C3dg) deposition on NCI-N87 cells in the presence of NHS. Zanidatamab and tras + pert binding in presence of NHS resulted in enhanced C1q (left) C3b/iC3b/C3dg (right) deposition in NCI-N87 cells compared to trastuzumab, pertuzumab or negative control. Zanidatamab mediated concentration-dependent ADCC (c) and ADCP (d) in NCI-N87 cells with comparable activity to trastuzumab, pertuzumab and tras + pert. In ad, data are mean ± SEM from n = 3 (AU565, NCI-H2170, OE-19, BT-474, SK-BR-3) or n = 6 (NCI-N87) independent experiments. In bd data are mean ± SEM from n = 3 independent experiments. In c, d n = 3 independent experiments performed with biologically independent PBMC samples (c), or with macrophage derived from three biologically independent PBMC samples (d). Gating strategy for b, c and d is shown in Supplementary Fig. 12d, a, b, respectively. Source data are provided as a Source Data file.
Fig. 5
Fig. 5. Zanidatamab promotes Ab internalization, surface and total HER2 downregulation and signal inhibition in SK-BR-3 and NCI-N87 cells.
a Zanidatamab showed increased receptor-mediated internalization compared to trastuzumab or pertuzumab (15 min to 6 h), measured by high content microscopy (n = 3 independent experiments). (Right) Zanidatamab conferred significantly greater receptor-mediated internalization compared to trastuzumab or pertuzumab (adjusted p < 0.001) in SK-BR-3 cells or NCI-N87 cells (24 h), measured by flow cytometry (n = 3 SK-BR-3 or n = 4 NCI-N87 independent experiments). A two-way ANOVA controlling for experiment with Bonferroni correction for multiple comparisons was performed, data normalized to trastuzumab, df = 3 for ANOVA and df = 4 for t-tests. b Zanidatamab showed significantly greater surface HER2 downregulation compared to trastuzumab (p = 0.001) and pertuzumab (p < 0.001) in SK-BR-3 cells and compared to trastuzumab (p = 0.04) and pertuzumab (p = 0.02) in NCI-N87 cells, evaluated by flow cytometry. Tras + pert mediated significantly greater HER2 downregulation compared to zanidatamab (p = 0.001) in SK-BR-3 cells (n = 3 SK-BR-3 or n = 4 NCI-N87 independent experiments, two-sample two-sided t tests with Bonferroni correction for multiple comparisons, df = 4). c Zanidatamab reduced total HER2 (24 h) when compared to untreated cells (adjusted p = 0.08, SK-BR-3; adjusted p = 0.06, NCI-N87). d Zanidatamab mediated inhibition of pHER2, pHER3, pEGFR, pAKT and pERK (adjusted p = 0.06) in NCI-N87 cells compared to untreated cells (24 h). e Zanidatamab mediated inhibition pHER3 (adjusted p = 0.047) and pAKT (adjusted p = 0.082) in SK-BR-3 cells compared to untreated cells (15 min), evaluated by immunoblotting. In c (df = 2), d (df = 2) and e (df = 3), evaluation performed by immunoblotting. In c and d (n = 3) and in e (n = 4) independent experiments, one sample two-sided t-test compared to untreated cells value of 100% with p values adjustment using Benjamini & Hochberg false discovery, comparisons with adjusted p values < 0.1 shown. Data in a (left) is mean ± SEM, a (right), be, mean ± 95% CI. Gating strategy for a (right) and b is shown in Supplementary Fig. 12e, f. Source data are provided in the Source Data file.
Fig. 6
Fig. 6. Zanidatamab mediates ligand-independent and EGF-dependent growth inhibition in HER2-expressing tumor cells.
a Zanidatamab mediated ligand-independent tumor growth inhibition in HER2-expressing tumor cells including AU565, NCI-H2170, OE-19, BT-474, NCI-N87 and SK-BR-3 (HER2 3+). Data are mean ± SEM from n = 3 (SK-BR-3), n = 4 (OE-19), n = 6 (AU565, BT-474, NCI-H2170) or n = 12 (NCI-N87) independent experiments. See Supplementary Tables 6, 7 for complete data and pairwise comparisons, respectively. b Zanidatamab mediated EGF-dependent tumor growth inhibition in HER2-expressing cell lines, including BT-474, NCI-N87 and NCI-H2170 (HER2 3+). Percent viability is plotted relative to non-treated cells (no EGF, no Ab). Upper horizontal dashed line (green) represents % viable cells upon EGF stimulation (% Viability(+EGF)). Lower horizontal dotted line (gray) represents viability of non-treated cells referenced to 100%. Data are  mean ± SEM from n = 3 (NCI-N87, NCI-H2170) or n = 5 (BT-474) independent experiments. See Supplementary Tables 8, 9 complete data and pairwise comparisons, respectively. Source data are provided in the Source Data file.
Fig. 7
Fig. 7. Zanidatamab mediates antitumor activity in HER2-expressing xenograft tumors.
a Mean tumor volume of patient-derived gastric xenograft model GXA 3054 implanted in nude mice. Tumor bearing mice treated with indicated test articles at 30 mg/kg, IV, twice weekly for five weeks, n = 10 per group. ***p value = 3.17e−07. b Mean tumor volume of cell-derived gastric xenograft model NCI-N87 implanted in nude mice. Tumor bearing mice treated with; single agent zanidatamab or trastuzumab at 4 mg/kg; or trastuzumab + pertuzumab combination at 4 mg/kg total (2 + 2 mg/kg of each agent), IV, twice weekly for four weeks, n = 7 per group. Statistical significance for both models was determined by fitting a linear mixed-effects model on log-transformed tumor growth data and comparing growth rates among all treatment groups, derived from the fitted model. A one-sided F-test is used as an omnibus test on the null hypothesis that all growth rates are equal. A post-hoc two-sided Tukey’s test was used to infer differences in growth rates between treatment groups and account for multiple comparisons. **p < 0.01 vs. trastuzumab or tras + pert. In a and b data are mean ± SEM. Source data are provided as a Source Data file.
Fig. 8
Fig. 8. Zanidatamab has multiple mechanisms of action.
We hypothesize that the trans biparatopic HER2 binding properties of zanidatamab forms the foundation of its multiple mechanisms of action. Zanidatamab binding leads to approximately 1.5-fold increased cell surface Ab saturation as well as to receptor crosslinking. The large cell surface HER2 clusters mediated by zanidatamab engagement facilitate C1q binding, likely by promoting hexamerization, and elicit potent CDC in HER2-high cell lines. In all HER2-expressing cells, including HER2-low tumors, ADCC and ADCP activities were also observed. It is also likely that receptor crosslinking and clustering prevent HER2 homodimerization and heterodimerization with other signaling partners, leading to the ligand-independent and ligand-dependent signal inhibition observed. Additionally, large receptor clusters are not efficiently recycled from early endosomes, culminating in increased receptor internalization and degradation. Together, these mechanisms contribute to the overall effect of tumor cell death and growth inhibition of zanidatamab in vitro and in vivo.

References

    1. Yarden Y, Sliwkowski MX. Untangling the ErbB signalling network. Nat. Rev. Mol. Cell Biol. 2001;2:127–137. doi: 10.1038/35052073. - DOI - PubMed
    1. Bang YJ, et al. Trastuzumab in combination with chemotherapy versus chemotherapy alone for treatment of HER2-positive advanced gastric or gastro-oesophageal junction cancer (ToGA): a phase 3, open-label, randomised controlled trial. Lancet. 2010;376:687–697. doi: 10.1016/S0140-6736(10)61121-X. - DOI - PubMed
    1. Oh DY, Bang YJ. HER2-targeted therapies - a role beyond breast cancer. Nat. Rev. Clin. Oncol. 2020;17:33–48. doi: 10.1038/s41571-019-0268-3. - DOI - PubMed
    1. Rubin I, Yarden Y. The basic biology of HER2. Ann. Oncol. 2001;12:S3–S8. doi: 10.1093/annonc/12.suppl_1.S3. - DOI - PubMed
    1. HERCEPTIN® (trastuzumab). Prescribing Information (Genentech, Inc., South San Francisco, CA, 2018).

Publication types

MeSH terms