. 2023 Mar 13;14(1):1390.
doi: 10.1038/s41467-023-37096-6.

Polymerase θ inhibition activates the cGAS-STING pathway and cooperates with immune checkpoint blockade in models of BRCA-deficient cancer

Affiliations

Polymerase θ inhibition activates the cGAS-STING pathway and cooperates with immune checkpoint blockade in models of BRCA-deficient cancer

Jeffrey Patterson-Fortin et al. Nat Commun. .

Retraction in

Abstract

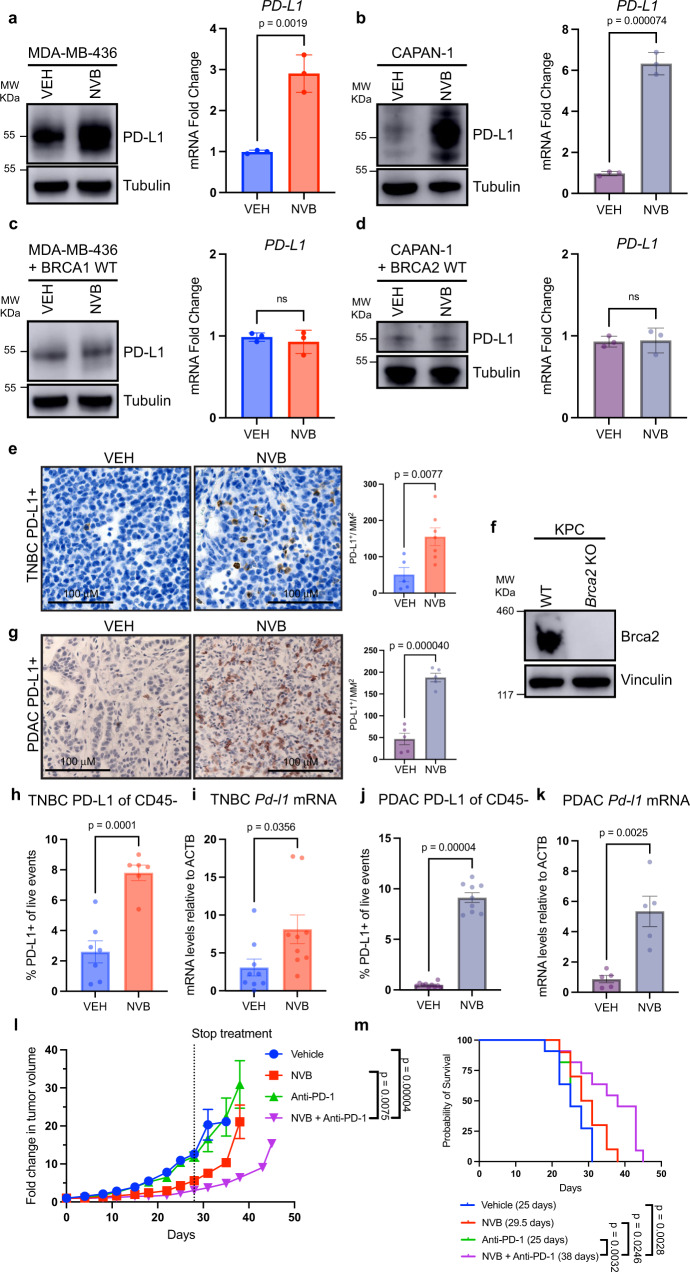
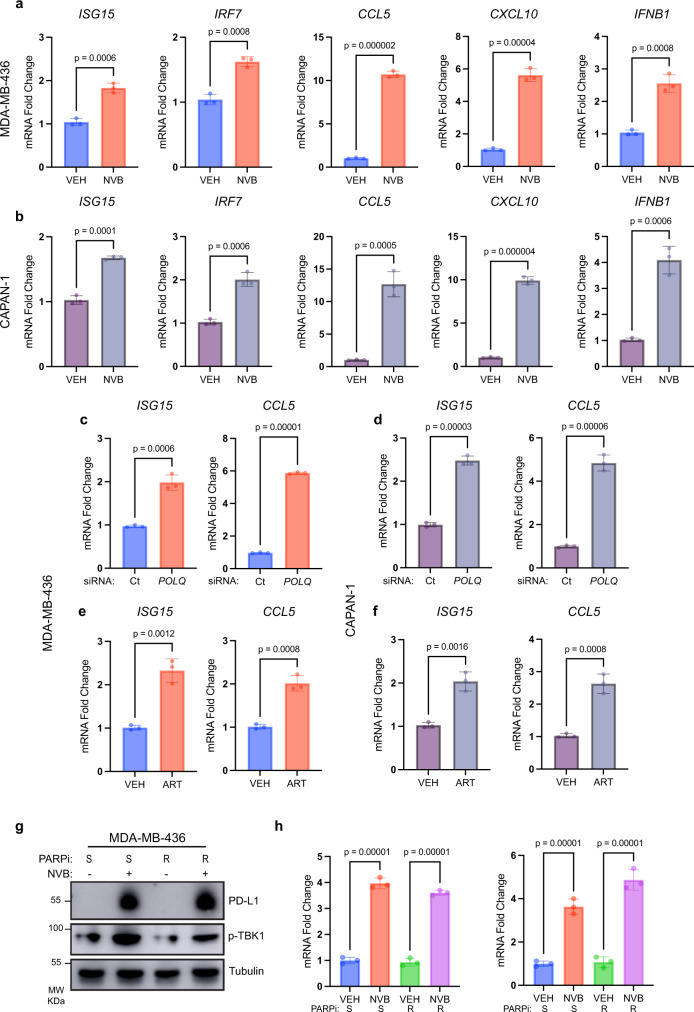
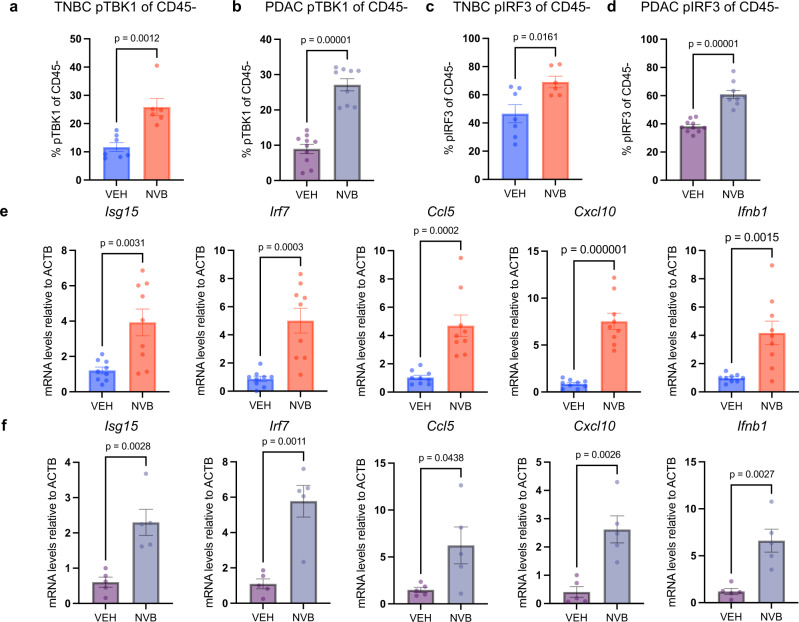
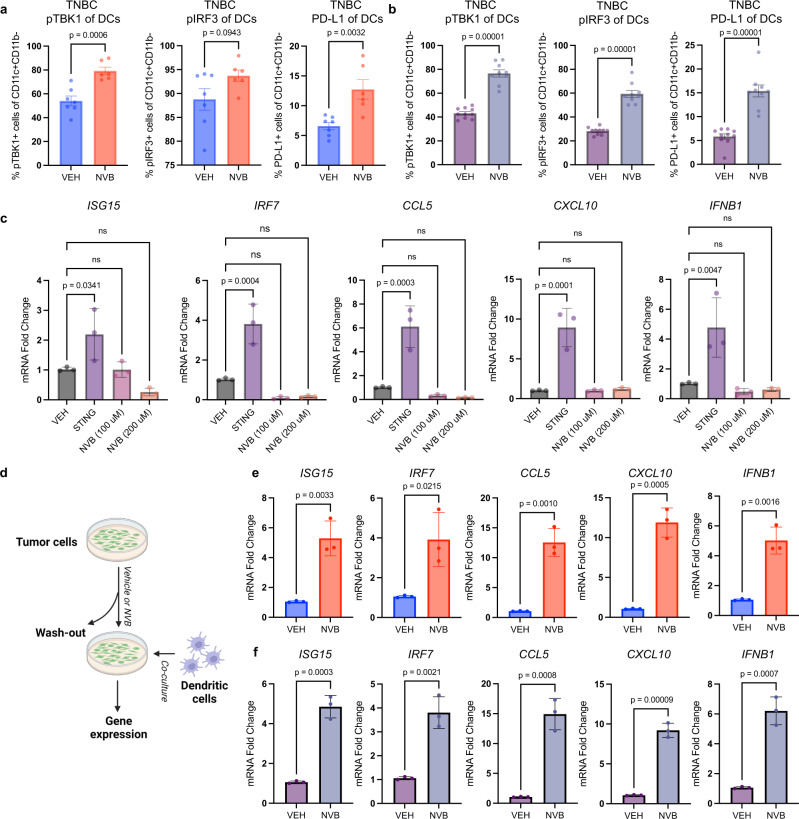
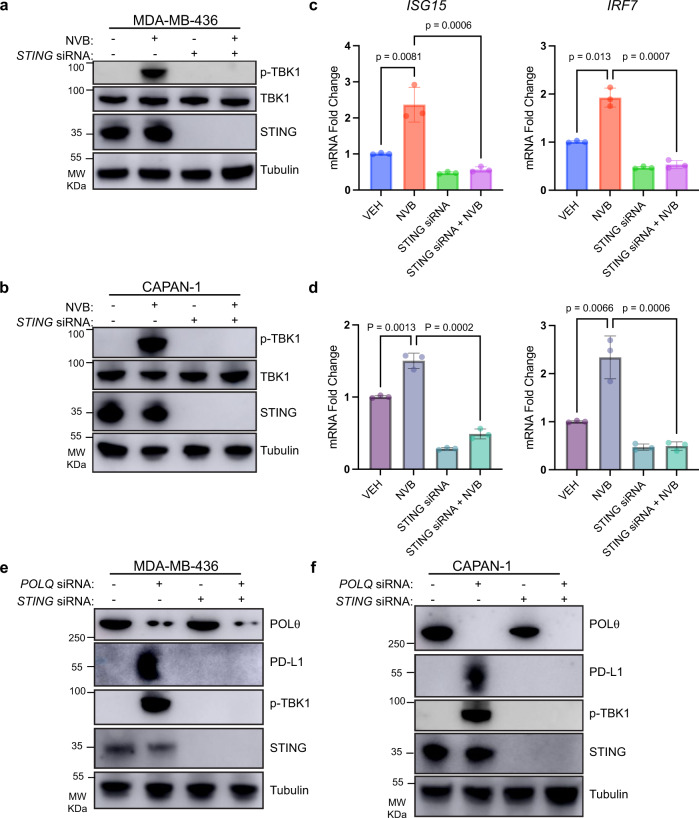
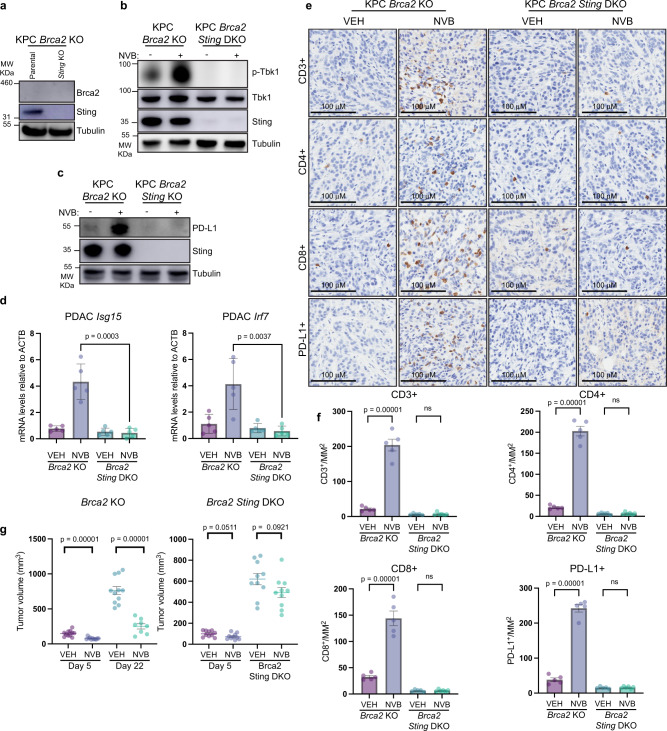
Recently developed inhibitors of polymerase theta (POLθ) have demonstrated synthetic lethality in BRCA-deficient tumor models. To examine the contribution of the immune microenvironment to antitumor efficacy, we characterized the effects of POLθ inhibition in immunocompetent models of BRCA1-deficient triple-negative breast cancer (TNBC) or BRCA2-deficient pancreatic ductal adenocarcinoma (PDAC). We demonstrate that genetic POLQ depletion or pharmacological POLθ inhibition induces both innate and adaptive immune responses in these models. POLθ inhibition resulted in increased micronuclei, cGAS/STING pathway activation, type I interferon gene expression, CD8+ T cell infiltration and activation, local paracrine activation of dendritic cells and upregulation of PD-L1 expression. Depletion of CD8+ T cells compromised the efficacy of POLθ inhibition, whereas antitumor effects were augmented in combination with anti-PD-1 immunotherapy. Collectively, our findings demonstrate that POLθ inhibition induces immune responses in a cGAS/STING-dependent manner and provide a rationale for combining POLθ inhibition with immune checkpoint blockade for the treatment of HR-deficient cancers.


Conflict of interest statement

J.L.G. is a consultant for Glaxo-Smith Kline (GSK), Codagenix, Verseau Therapeutics, Kymera, Kowa, Duke Street Bio., and Array BioPharma and receives sponsored research support from GSK, Array BioPharma, Merck and Eli Lilly. G.M.W. reports research funding from Merck & Co, institutional funding from Glaxo Smith Kline and Genentech, and US patent 20090258352, “A1 Pin1 as a marker for abnormal l cell growth,” licensed to Cell Signaling and R&D Systems. B.M.W. receives Research support from Celgene, Eli Lilly, Novartis, and Revolution Medicine; Consulting for Celgene, GRAIL, and Mirati. A.J.A. has consulted for Oncorus, Inc., Arrakis Therapeutics, Syros Pharmaceuticals, Boehringer Ingelheim, T-knife Therapeutics, AstraZeneca, Mirati Therapeutics, Revolution Medicines, Anji Pharmaceuticals, and Merck & Co., Inc. A.J.A. consults for and holds equity in Riva Therapeutics. A.J.A. has research funding from Mirati Therapeutics, Syros Pharmaceuticals, Bristol Myers Squibb, Revolution Medicines, Novartis, Novo Ventures and Deerfield, Inc. J.M.C. receives research funding to his institution from Merus, Roche, and Bristol Myers Squibb. He receives research support from Merck, AstraZeneca, Esperas Pharma, Bayer, Tesaro, Arcus Biosciences, and Apexigen; he received honoraria for being on advisory boards of Syros Pharmaceuticals, Incyte, and Blueprint Medicines. A.D.D. reports consulting for AstraZeneca, Bayer AG, Blacksmith/Lightstone Ventures, Bristol Myers Squibb, Cyteir Therapeutics, EMD Serono, Impact Therapeutics, PrimeFour Therapeutics, Pfizer, Tango Therapeutics, and Zentalis Pharmaceuticals/Zeno Management; is an Advisory Board member for Cyteir, and Impact Therapeutics; stockholder in Cedilla Therapeutics, Cyteir, Impact Therapeutics, and PrimeFour Therapeutics; and reports receiving commercial research grants from Bristol Myers Squibb, EMD Serono, Moderna, and Tango Therapeutics. G.I.S. has received research funding from Eli Lilly, Merck KGaA/EMD-Serono, Merck & Co., and Pfizer. He has served on advisory boards for Pfizer, Eli Lilly, Merck KGaA/EMD-Serono, Bicycle Therapeutics, Fusion Pharmaceuticals, Cybrexa Therapeutics, Bayer, Boehringer Ingelheim, ImmunoMet, Artios, Atrin, Concarlo Holdings, Syros, Zentalis, CytomX Therapeutics, Blueprint Medicines, Kymera Therapeutics, Janssen and Xinthera. In addition, he holds a patent entitled, “Dosage regimen for sapacitabine and seliciclib,” also issued to Cyclacel Pharmaceuticals, and a pending patent, entitled, “Compositions and Methods for Predicting Response and Resistance to CDK4/6 Inhibition,” together with Liam Cornell. The remaining authors declare no competing interests.

Figures

Fig. 1
Fig. 1. POLθ inhibition induces PD-L1 expression in vitro and in vivo and is enhanced by anti-PD-1 immunotherapy in HR-deficient cancers.
ad BRCA1-mutant MDA-MB-436 TNBC (a) cells, or BRCA2-mutant CAPAN-1 PDAC (b) cells, and their isogenic pairs, BRCA1-expressing MDA-MB-436 (c), or BRCA2-expressing CAPAN-1 (d), were exposed to 100 μM novobiocin (NVB) for 48 h. Left: Immunoblot for PD-L1 expression. Right: Quantification of PD-L1 mRNA levels by RT-qPCR. Transcript levels are measured relative to ACTB by qPCR. Data, mean +/− SD of three independent experiments, unpaired two-tailed t-test. e Tumor chunks derived from the K14-Cre-Brca1f/f;Trp53f/f GEMM were transplanted in syngeneic FVB/129P2 mice treated with vehicle (VEH, n = 5) or NVB (n = 7) at 75 mg/kg via intraperitoneal (IP) injection twice daily, were harvested after 5 days of treatment for PD-L1 expression by IHC. Staining was quantified using Aperio algorithms. (Left: Representative IHC images at 40x magnification, scale bars, 100 μM. Right: Quantification, Data, mean +/− SEM, unpaired two-tailed t-test. f Immunoblot analysis of Brca2 protein expression in CRISPR knockout KrasLSL-G12D; TP53LoxP; Pdx1-Cre; Rosa26YFP/YFP (KPC) cells. Vinculin serves as an internal loading control. Representative immunoblot of three independent experiments. g Brca2 KO KPC cells were injected into the flanks of syngeneic C57BL/6 mice and treated with VEH(n = 5) or NVB (n = 5) at 75 mg/kg via IP injection twice daily. After 5 days of treatment, tumors were harvested and subjected to IHC for PD-L1 expression. Left: Representative IHC images at 40x magnification, scale bars, 100 μM. Right: Quantification, Data, mean +/− SEM, unpaired two-tailed t-test. h, i PD-L1 protein (h) or mRNA (i) expression in K14-Cre-Brca1f/f;Trp53f/f TNBC tumors. VEH, n = 7; NVB, n = 6 in (h); VEH, n = 9; NVB, n = 9 in (i). j, k PD-L1 protein (j) or mRNA (k) expression in Brca2 KO KPC PDAC tumors. VEH, n = 10; NVB, n = 9 in (j); VEH, n = 5; NVB, n = 5 in k. Error bars, SEM. Statistical analyses were performed using unpaired two-tailed t-tests. l Brca2 KO KPC tumor-bearing syngeneic C57BL/6 mice were treated with VEH (n = 11) or NVB (75 mg/kg IP twice daily, n = 10), along with isotype control (n = 11) or an anti-PD-1 antibody (200 µg twice weekly, n = 11) for 28 days, and serial fold-change in tumor volume was recorded. Data, mean +/− SEM, one-way ANOVA analysis. m Kaplan–Meier analysis for time until tumor progression necessitated euthanasia. Median survivals are shown in parentheses for mice from 1l. Kaplan–Meier curves were analyzed by the log-rank test.
Fig. 2
Fig. 2. Efficacy of POLθ inhibition in HR-deficient cancers requires CD8+ T cells.
a, b K14-Cre-Brca1f/f;Trp53f/f TNBC tumors from syngeneic FVB/129P2 mice (VEH, n = 5; NVB, n = 7) (a), or Brca2 KO KPC PDAC tumors from syngeneic C57BL/6 mice (VEH, n = 7; NVB, n = 6) (b) were subjected to IHC for CD3, CD4, and CD8 expression. Left: Representative IHC images at 40x magnification, scale bars, 100 μM. Right: Quantification of IHC using Aperio algorithms. Data, mean +/−SEM, unpaired two-tailed t-tests. c, d K14-Cre-Brca1f/f;Trp53f/f tumors TNBC (VEH, n = 7; NVB, n = 6) (c), or Brca2 KO KPC PDAC tumors (VEH, n = 10; NVB, n = 9) (d) were harvested 5 days after treatment and analyzed by flow cytometry. Scatter plots show significant increases in CD45+, CD3+, CD8+, and Granzyme B+ cells in NVB-treated animals. Error bars, SEM. Statistical analyses were performed using unpaired two-tailed t-tests. e, f TNBC tumors (VEH, n = 7; NVB, n = 6) (e) or PDAC tumors (VEH, n = 10; NVB, n = 9) (f) were analyzed by flow cytometry. Scatter plots show CD4+ cells, CD4+ T regulatory (FoxP3+) cells. Error bars, SEM. Statistical analyses were performed using unpaired two-tailed t-tests. g, h TNBC tumors (VEH, n = 7; NVB, n = 6) (g) or PDAC tumors (VEH, n = 10; NVB, n = 9) (h) were analyzed by flow cytometry for macrophages (CD11b + , CD11c-). Error bars, SEM. Statistical analyses were performed using unpaired two-tailed t-tests. i K14-Cre-Brca1f/f;Trp53f/f GEMM tumor-bearing syngeneic FVB/129P2 mice were treated with vehicle (n = 6) or NVB (75 mg/kg twice daily; n = 8), along with isotype control (n = 6) or an anti-CD8 antibody (200 µg twice weekly; n = 8) for 28 days. Graph shows the serial fold-change in tumor volume. Data, mean +/−SEM, one-way ANOVA analysis. j Brca2 KO KPC PDAC tumor-bearing syngeneic C57BL/6 mice were treated with vehicle (n = 9) or NVB (75 mg/kg twice daily; n = 10), along with isotype control (n = 9) or an anti-CD8 antibody (200 µg twice weekly; n = 10) for 28 days. Graph shows the serial fold-change in tumor volume. Data, mean +/−SEM, one-way ANOVA analysis.
Fig. 3
Fig. 3. POLθ inhibition activates the cGAS/STING pathway in BRCA-deficient cancers.
ad The pair of MDA-MB-436 +/− BRCA1 isogenic cell lines (a), or the pair of CAPAN-1 +/− BRCA2 isogenic cell lines (b) were treated with vehicle (VEH) or 100 μM NVB for 48 h, fixed and stained with picogreen, and subjected to immunofluorescence (IF) for cGAS. a, b and Supplementary Fig. 3a, b, Representative IF images at 100x magnification, scale bars, 10 μM. c, d Quantification of the number of cGAS-colocalized micronuclei expressed as a percentage of total nuclei (n = 100 imaged cells / treatment group). Significance of difference determined by one-way ANOVA. e, f Analysis of 2′3′-cGAMP levels by ELISA in the isogenic cell line pair MDA-MD-436 +/− BRCA1 (e), and the isogenic cell line pair CAPAN-1 +/− BRCA2 (f) treated with VEH or 100 μM NVB for 48 h. Data, mean +/− SD of three independent experiments, one-way ANOVA. g MDA-MD-436 (left) and CAPAN-1 (right) cell lines cell lines were treated with VEH or 100 μM NVB for 48 h and whole-cell lysates were subjected to immunoblotting with representative immunoblot of three independent experiments. h MDA-MD-436 (left) and CAPAN-1 (right) cell lines cell lines were transfected with siRNA targeting POLQ and whole-cell lysates were subjected to immunoblotting with representative immunoblot of three independent experiments. i MDA-MD-436 (left) and CAPAN-1 (right) cell lines were treated with VEH or 1 μM ART558 (ART) for 48 h. Whole-cell lysates were subjected to immunoblotting with representative immunoblot of three independent experiments. j, k Isogenic cell line pairs (MDA-MD-436 +/− BRCA1, j) and (CAPAN-1 +/− BRCA2, k) were treated with DMSO or 100 μM NVB for 48 h, and subsequently subjected to immunofluorescence for pIRF3Ser396. For representative IF images, see Supplementary Fig. 3c, d. Quantification of each cell line (n = 100 imaged cells/treatment group), data, mean +/− SD, one-way ANOVA. l, m Representative IF images of respective cell lines, MDA-MD-436 (l) or CAPAN-1 (m), treated with 100 μM NVB for 48 h and subjected to IF for γH2AX and pIRF3Ser396.
Fig. 4
Fig. 4. POLθ inhibition induces an in vitro pro-inflammatory response in BRCA-deficient cancers.
a, b MDA-MD-436 (a) cells or CAPAN-1 (b) were treated with DMSO or 100 μM NVB for 48 h. RNA was extracted and qPCR performed. ISG15, IRF7, CCL5, CXCL10, and IFNB1 mRNA levels were normalized to ACTB internal control. Data, mean +/−SD of 3 independent experiments, unpaired two-way t-tests. c, d Indicated cell lines (MDA-MD-436, c; CAPAN-1, d) were transfected with siRNA targeting POLQ, and RNA was extracted, and qPCR performed. ISG15, and CCL5 mRNA levels were normalized to ACTB internal control. Data, mean +/−SD of 3 independent experiments. Statistical analyses were performed using unpaired two-tailed t-tests. e, f Indicated cell lines (MDA-MD-436, e; CAPAN-1, f) were treated with 1 μM ART558 (ART) for 48 h, and RNA was extracted, and qPCR performed. ISG15, and CCL5 mRNA levels were normalized to ACTB internal control. Data, mean +/−SD of 3 independent experiments. Statistical analyses were performed using unpaired two-tailed t-tests. g PARP inhibitor (PARPi) sensitive or resistant MDA-MB-436 cell lines were treated with DMSO or 100 μM NVB for 48 h, and whole-cell lysates were subjected to immunoblotting. POLθ inhibition increased TBK1 phosphorylation and PD-L1 expression in both PARPi sensitive and resistant MDA-MB-436 cells, with representative immunoblot of three independent experiments. h PARPi resistant MDA-MB-436 cell lines were treated with DMSO or 100 μM NVB for 48 h, and RNA was extracted, and qPCR performed for ISG15 and CCL5, normalized to ACTB internal control. Data, mean +/−SD of three independent experiments, unpaired two-tailed t-tests.
Fig. 5
Fig. 5. POLθ inhibition induces an in vivo pro-inflammatory response in BRCA-deficient cancers.
ad TNBC tumors from vehicle- or NVB-treated mice from 1h (VEH, n = 7; NVB, n = 6) were harvested 5 days after treatment and analyzed by flow cytometry for TBK1 and pIRF3 expression (a, c). PDAC tumors from vehicle- or NVB-treated mice from 1j (VEH, n = 10; NVB, n = 9) harvested 5 days after treatment and analyzed by flow cytometry for TBK1 and pIRF3 expression (b, d). Scatter plots show significant increases in pTBK1+ and pIRF3+ in CD45- cells from NVB-treated animals. Error bars, SEM. Statistical analyses were performed using unpaired two-tailed t-tests. e, f Whole-tumor qPCR was performed on RNA from TNBC (VEH, n = 9; NVB, n = 9) (e) or PDAC (VEH, n = 5; NVB, n = 5) (f) tumors. Scatter plots show significant increases in Isg15, Irf7, Ccl5, Cxcl10, and Ifnb1 mRNA levels normalized to ACTB control from NVB-treated animals. Error bars, SEM. Statistical analyses were performed using unpaired two-tailed t-tests.
Fig. 6
Fig. 6. POLθ inhibition in HR-deficient tumors induces the cGAS/STING pathway in dendritic cells.
a, b TNBC tumors from 1h (VEH, n = 7; NVB, n = 6) or PDAC tumors from 1j (VEH, n = 10; NVB, n = 9), were harvested 5 days after treatment and analyzed by flow cytometry. Scatter plots demonstrate increases in pTBK1+, pIRF3+, and PD-L1 in dendritic cells (DCs). Error bars, SEM. Statistical analyses were performed using unpaired two-tailed t-tests. c Human dendritic cells were treated with 100 μM and 200 μM NVB for 48 h. After 48 h of incubation, DCs were collected and processed for qPCR analysis. qPCR analysis of ISG15, IRF7, CCL5, CXCL10, and IFNB1 mRNA levels normalized to ACTB control. 10 μM ADU-S100 (labeled as STING) was used as a positive control. Data, mean +/− SD of 3 independent experiments, one-way ANOVA. d Illustration of co-culture system using human dendritic cells and NVB-treated tumor cells. HR-deficient tumor cells were treated with vehicle or 100 μM NVB for 48 h, after which were removed and DCs were co-cultured for 24 h. Floating cells representing DCs were collected and processed for qPCR analysis. Created using Biorender. e, f qPCR analysis of ISG15, IRF7, CCL5, CXCL10, and IFNB1 mRNA levels normalized to ACTB control in DCs co-cultured with untreated and NVB-treated MDA-MB-436 cells (e), or CAPAN-1 cells (f). Data, mean +/− SD of 3 independent experiments, unpaired two-tailed t-tests.
Fig. 7
Fig. 7. cGAS/STING pathway activation is required for POLθ inhibition-mediated pro-inflammatory response.
a, b MDA-MB-436 (a) or CAPAN-1 (b) cells were depleted of STING by siRNA and then treated with vehicle or 100 μM NVB for 48 h and subjected to immunoblotting. STING depletion as shown by immunoblotting for STING protein levels, abolishes NVB-mediated TBK1 phosphorylation in MDA-MB-436 (a), and CAPAN-1 (b) cells. c, d MDA-MB-436 or CAPAN-1 cells depleted of STING by siRNA and treated with 100 μM NVB for 48 h were subjected to qPCR. STING depletion abolishes NVB-mediated upregulation of ISG15 and IRF7 mRNA levels normalized to ACTB control in MDA-MB-436 (c), and CAPAN-1 (d) cells. Data, mean +/− SD of 3 independent experiments, one-way ANOVA. e, f MDA-MD-436 (e) or CAPAN-1 (f) cells were depleted of STING, POLQ, or the combination by siRNA and subjected to immunoblotting. Combination STING and POLQ siRNA-mediated depletion, as shown by immunoblotting for STING and POLQ protein levels, abolishes TBK1 phosphorylation and increased expression of PD-L1. Representative immunoblot of three independent experiments.
Fig. 8
Fig. 8. cGAS/STING pathway activation is required for POLθ inhibition-mediated antitumor efficacy and immune checkpoint activation.
a Immunoblot analysis of STING protein expression in Sting CRISPR knockout KPC Brca2 KO cells. Tubulin serves as an internal loading control. Representative immunoblot of three independent experiments. b Immunoblot analysis of TBK1 phosphorylation in KPC Brca2 KO cells and KPC Brca2 Sting DKO cells upon 100 μM NVB treatment for 48 h. Sting depletion abolishes NVB-mediated Tbk1 phosphorylation. Representative immunoblot of three independent experiments. c Immunoblot analysis of PD-L1 expression in KPC Brca2 KO cells and KPC Brca2 Sting DKO cells upon 100 μM NVB treatment for 48 h. Sting depletion abolishes NVB-mediated PD-L1 upregulation. Representative immunoblot of three independent experiments. d PDAC tumors (Brca2 KO, or Brca2 Sting DKO from vehicle- or twice daily 75 mg/kg NVB-treated mice (n = 5 per treatment group) were harvested 5 days after treatment and analyzed by whole-tumor qPCR. Scatter plots show significant increases in Isg15 and Irf7. mRNA levels normalized to ACTB control from NVB-treated animals harboring Brca2 KO PDAC tumors but not Brca2 Sting DKO PDAC tumors. Error bars, SEM. Statistical analyses were performed using one-way ANOVA. e, f PDAC tumors Brca2 KO (VEH, n = 5; NVB, n = 5), or Brca2 Sting DKO (VEH, n = 5; NVB, n = 6) from vehicle- or twice daily 75 mg/kg NVB-treated mice were harvested 5 days after treatment and analyzed by IHC for CD3, CD4, CD8, and PD-L1 expression. Representative IHC images at 40x magnification, scale bars, 100 μM (e). Quantification of IHC staining using Aperio algorithms. Data, mean +/− SEM, unpaired two-tailed t-tests (f). g KPC Brca2 KO (VEH, n = 10; NVB, n = 10) or KPC Brca2 Sting DKO (VEH, n = 10; NVB, n = 10) cells were transplanted in syngeneic C57/BL6 mice and treated with vehicle (VEH) or NVB. Tumor volumes (mm3) were measured at days 5 and 22. Error bars, SEM. Statistical analysis was performed using unpaired two-way t-tests.

References

    1. Patel KJ, et al. Involvement of Brca2 in DNA repair. Mol. Cell. 1998;1:347–357. doi: 10.1016/S1097-2765(00)80035-0. - DOI - PubMed
    1. Venkitaraman AR. Cancer susceptibility and the functions of BRCA1 and BRCA2. Cell. 2002;108:171–182. doi: 10.1016/S0092-8674(02)00615-3. - DOI - PubMed
    1. Helleday T, Petermann E, Lundin C, Hodgson B, Sharma RA. DNA repair pathways as targets for cancer therapy. Nat. Rev. Cancer. 2008;8:193–204. doi: 10.1038/nrc2342. - DOI - PubMed
    1. Lord CJ, Ashworth A. PARP inhibitors: Synthetic lethality in the clinic. Science. 2017;355:1152–1158. doi: 10.1126/science.aam7344. - DOI - PMC - PubMed
    1. Zhou J, et al. A first-in-class polymerase theta inhibitor selectively targets homologous-recombination-deficient tumors. Nat. Cancer. 2021;2:598–610. doi: 10.1038/s43018-021-00203-x. - DOI - PMC - PubMed

Publication types

MeSH terms

Substances