. 2023 Mar 13;14(1):1397.
doi: 10.1038/s41467-023-37155-y.

Trifunctional nanoprecipitates ductilize and toughen a strong laminated metastable titanium alloy

Affiliations

Trifunctional nanoprecipitates ductilize and toughen a strong laminated metastable titanium alloy

Chongle Zhang et al. Nat Commun. .

Abstract

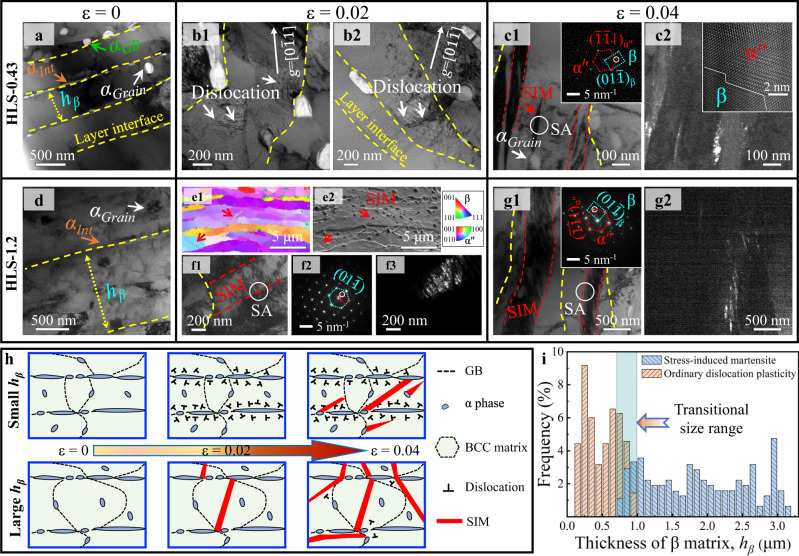
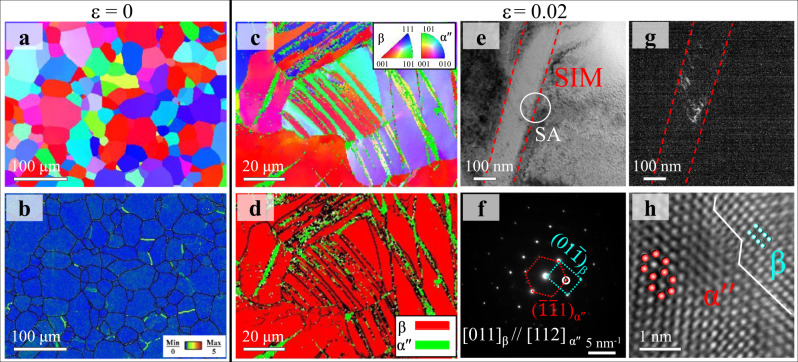
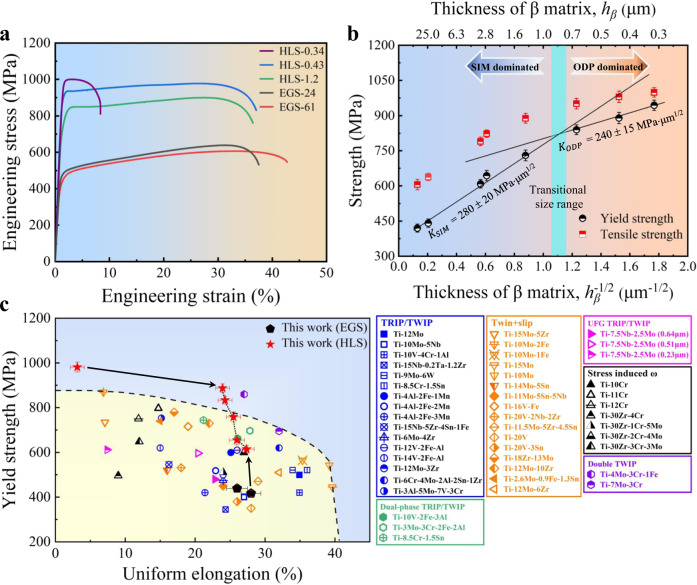
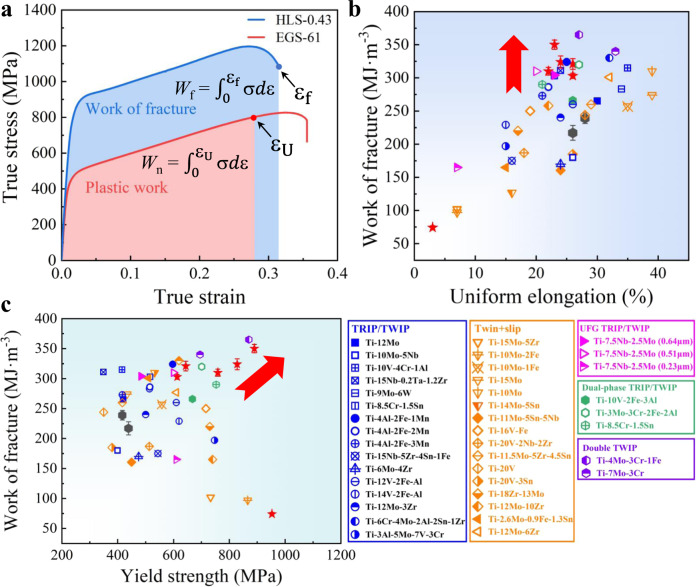
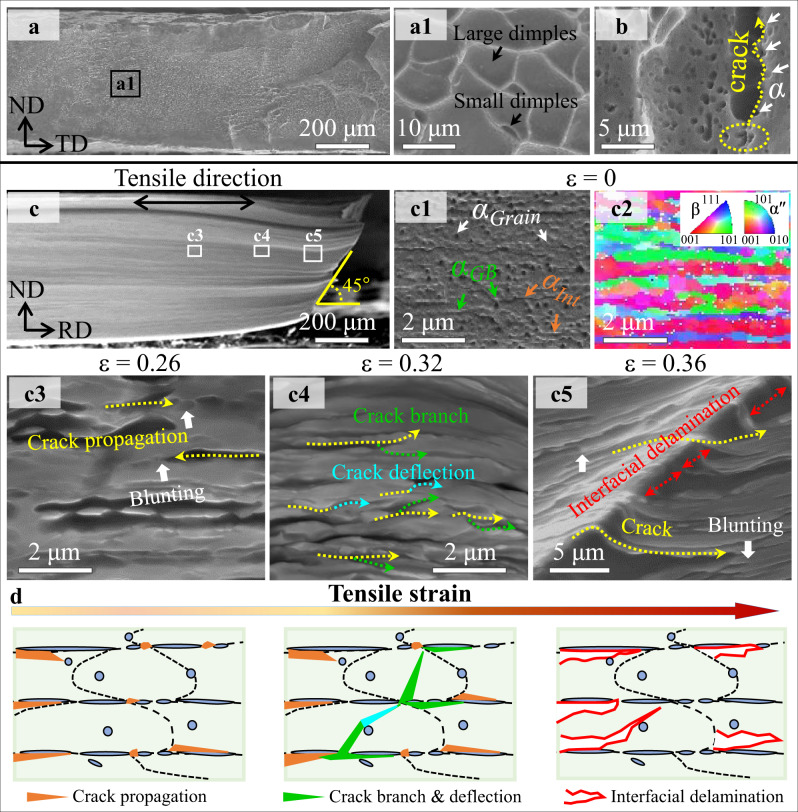
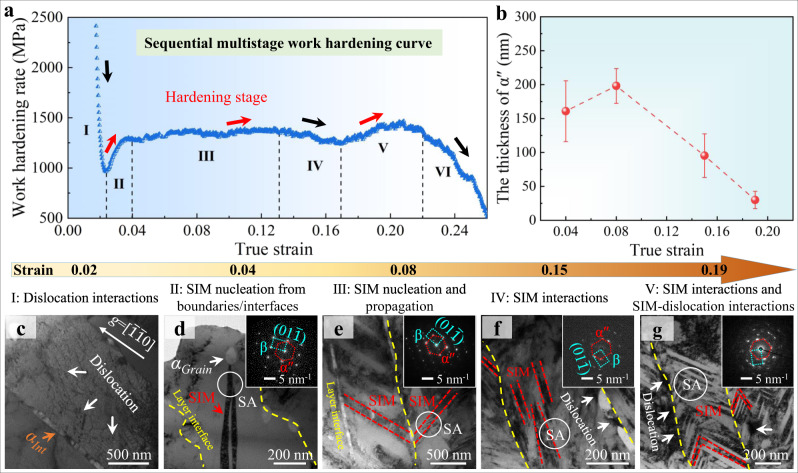
Metastability-engineering, e.g., transformation-induced plasticity (TRIP), can enhance the ductility of alloys, however it often comes at the expense of relatively low yield strength. Here, using a metastable Ti-1Al-8.5Mo-2.8Cr-2.7Zr (wt.%) alloy as a model material, we fabricate a heterogeneous laminated structure decorated by multiple-morphological α-nanoprecipitates. The hard α nanoprecipitate in our alloy acts not only as a strengthener to the material, but also as a local stress raiser to activate TRIP in the soft matrix for great uniform elongation and as a promoter to trigger interfacial delamination toughening for superior fracture resistance. By elaborately manipulating the activation sequence of lamellar-thickness-dependent deformation mechanisms in Ti-1Al-8.5Mo-2.8Cr-2.7Zr alloys, the yield strength of the present submicron-laminated alloy is twice that of equiaxed-coarse grained alloys with the same composition, yet without sacrificing the large uniform elongation. The desired mechanical properties enabled by this strategy combining the laminated metastable structure and trifunctional nanoprecipitates provide new insights into designing ultra-strong and ductile materials with great toughness.


Conflict of interest statement

The authors declare no competing interests.

Figures

Fig. 1
Fig. 1. Deformation mechanisms in HLS-0.43 and HLS-1.2 β-Ti alloys activated in the initial plastic deformation stage.
ac HLS-0.43 β-Ti alloys. a At a strain ɛ = 0, a bright-field TEM (BF-TEM) image shows the layered structure and multiple phases. b1-b2 At a strain ɛ = 0.02, dislocations are generated from the α/β interface and pile up against the opposite interface, and no SIM is observed in the β layers. c1 At a strain ɛ = 0.04, a BF-TEM image shows SIM bands are nucleated from the α/β interface and in a region adjacent to αGrain inside the β-layer, indicated by red dashed lines and red arrow, respectively, which are verified by the SAED pattern in c1. c2 The DF-TEM image of c1. The inset is the corresponding HR-TEM image in c2, showing the α″/β interface highlighted by the white line. dg HLS-1.2 β-Ti alloys. d A BF-TEM image of upstretched HLS-0.43 β-Ti alloys. e1-e2 The inverse pole figure (IPF) and corresponding SEM maps show the activation of SIM. f1 A typical DF-TEM image shows SIM initiated from the α/β interface, as verified by f1 the SAED pattern and f3 the DF-TEM image of SIM. g1 At a strain ɛ = 0.04, a BF-TEM image shows two SIM bands was activated, indicated by red dashed lines, as verified by the SAED pattern in g1 and g2 the DF-TEM image. h Schematic illustration of the deformation mechanism evolution of two different β-layer thickness samples during deformation. i Histogram showing the activation of deformation mechanisms, i.e., ODP and SIM, in β-layers at a strain ɛ = 0.02. Beam parallel to a <011>β zone axis in c1 and g1. Beam parallel to a < 111¯ >β zone axis in f2.
Fig. 2
Fig. 2. Deformation mechanisms of the EGS-61 β-Ti alloy at the initial stage of plastic deformation.
At a strain ɛ = 0, a the inverse pole figure (IPF) image and b the corresponding kernel average misorientation (KAM) image. c At a strain ɛ = 0.02, the IPF image shows the plate-like deformation bands that were identified to be SIM α″, as verified by d the corresponding α″ phase map. e A typical BF-TEM image shows a SIM band with a width ∼of 150 nm activated in the deformed EGS-61 sample, as verified by f the SAED pattern and g the DF-TEM image of SIM. h A typical HR-TEM image shows the β/α″ interface, as marked by the white line.
Fig. 3
Fig. 3. The mechanical responses of β-Ti alloys.
a The engineering stress–strain curves. b The yield/tensile strength of the present β-Ti alloys with different β-layer thicknesses. The predicted critical stress for the activation of SIM and ODP is associated with different H–P slopes, i.e., KSIM = 280 ± 20 MPa μm1/2 for SIM and KODP = 240 ± 15 MPa μm1/2 for ODP, revealing a critical size of ~0.80 ± 0.07 μm for the SIM to ODP transition. c A comparison of yield strength vs. uniform elongation of our β-Ti alloys with reported metastable β-Ti alloys, including TRIP/TWIP Ti alloys: Ti-12Mo,, Ti-10Mo-5Nb, Ti-10V-4Cr-1Al, Ti-15Nb-0.2Ta-1.2Zr, Ti-9Mo-6W, Ti-8.5Cr-1.5Sn, (Ti-4Al-2Fe-1Mn, Ti-4Al-2Fe-2Mn and Ti-4Al-2Fe-3Mn), Ti-15Nb-5Zr-4Sn-1Fe, Ti-6Mo-4Zr, (Ti-12V-2Fe-1Al and Ti-14V-2Fe-1Al), and Ti-12Mo-3Zr; Dual-phase TRIP/TWIP Ti alloys: Ti-10V-2Fe-3Al, Ti-3Mo-3Cr-2Fe-2Al, Ti-8.5Cr-1.2Sn; Twin+slip Ti alloys: Ti-3Al-5Mo-7V-3Cr, (Ti-15Mo-5Zr, Ti-10Mo-2Fe, Ti-10Mo-1Fe and Ti-15Mo), Ti-10Mo, (Ti-14Mo-5Sn and Ti-11Mo-5Sn-5Nb), Ti-16V-1Fe, Ti-20V-2Nb-2Zr, (Ti-11.5Mo-5Zr-4.5Sn, Ti-20V-3Sn and Ti-20V), Ti-6Cr-4Mo-2Al-2Sn-1Zr, Ti-18Zr-13Mo, (Ti-12Mo-10Zr and Ti-12Mo-6Zr), Ti-2.6Mo-0.9Fe-1.3Sn; UFG TRIP/TWIP Ti alloys: Ti-7.5Nb-2.5Mo (with different β grain sizes); Stress-induced ω Ti alloys: (Ti-10Cr, Ti-11Cr, and Ti-12Cr), (Ti-30Zr-4Cr, Ti-30Zr-1Cr-5Mo, Ti-30Zr-2Cr-4Mo and Ti-30Zr-3Cr-3Mo); Double TWIP Ti alloys: Ti-7Mo-3Cr and Ti-4Mo-3Cr-1Fe alloys. Error bars indicate standard deviations for three tests. More details (alloy composition and corresponding references) can be found in Supplementary Table 5.
Fig. 4
Fig. 4. The fracture properties of β-Ti alloys.
a The true stress–strain curves of HLS-0.43 and EGS-61 β-Ti alloys. The red and blue colored areas represent the integration performed to estimate the plastic work and work of fracture, respectively. Comparisons of b the work of fracture vs. true uniform strain and c the work of fracture vs. yield strength of our β-Ti alloys with reported metastable β-Ti alloys, including TRIP/TWIP Ti alloys: Ti-12Mo,, Ti-10Mo-5Nb, Ti-10V-4Cr-1Al, Ti-15Nb-0.2Ta-1.2Zr, Ti-9Mo-6W, Ti-8.5Cr-1.5Sn, (Ti-4Al-2Fe-1Mn, Ti-4Al-2Fe-2Mn and Ti-4Al-2Fe-3Mn), Ti-15Nb-5Zr-4Sn-1Fe, Ti-6Mo-4Zr, (Ti-12V-2Fe-1Al and Ti-14V-2Fe-1Al), Ti-12Mo-3Zr and Ti-6Cr-4Mo-2Al-2Sn-1Zr; Dual-phase TRIP/TWIP Ti alloys: Ti-10V-2Fe-3Al, Ti-3Mo-3Cr-2Fe-2Al, Ti-8.5Cr-1.2Sn; Twin+slip Ti alloys: Ti-3Al-5Mo-7V-3Cr, (Ti-15Mo-5Zr, Ti-10Mo-2Fe, Ti-10Mo-1Fe and Ti-15Mo), Ti-10Mo, (Ti-14Mo-5Sn and Ti-11Mo-5Sn-5Nb), Ti-16V-1Fe, Ti-20V-2Nb-2Zr, (Ti-11.5Mo-5Zr-4.5Sn, Ti-20V-3Sn and Ti-20V), Ti-18Zr-13Mo, (Ti-12Mo-10Zr and Ti-12Mo-6Zr), Ti-2.6Mo-0.9Fe-1.3Sn, UFG TRIP/TWIP Ti alloys: Ti-7.5Nb-2.5Mo (with different β grain sizes); Double TWIP Ti alloys: Ti-7Mo-3Cr and Ti-4Mo-3Cr-1Fe alloys. Error bars indicate standard deviations for three tests.
Fig. 5
Fig. 5. Fracture behavior and the underlying mechanism of HLS-0.43 β-Ti alloys.
a An SEM image of the fracture surface of HLS-0.43 β-Ti alloys. a1 A magnified image of the fracture surface shows massive dimples. b An SEM image shows that these cracks are initially nucleated at α/β layer interfaces. c An SEM image of the post-fractured HLS-0.43 sample along rolling direction. c1-c2 The SEM and corresponding EBSD images show the configurations of undeformed α nanoprecipitates at ε = 0. c3 The SEM images show crack initiation and propagation along the α/β interfaces at ε = 0.26, and cracks were blunted via αGrain nanoprecipitates (white arrows), c4 crack deflection (cyan arrows) and branch (green arrows) at ε = 0.32, and c5 interface delamination at ε = 0.36. d Schematic illustration of the fracture process of HLS-0.43 β-Ti alloys during post-uniform elongation in terms of crack deflection and branch and interfacial delamination caused by α nanoprecipitates.
Fig. 6
Fig. 6. The multistage work-hardening behavior and the underlying mechanisms in HLS-0.43 β-Ti alloys.
a A representative work-hardening rate curve of HLS-0.43 β-Ti alloys. b Profiles of martensitic thickness vs. true strain, revealing a maximum thickness of martensitic plates at a strain of ε = 0.08. Below this strain, martensites have just nucleated so that they can grow up to large thickness with increasing ε; while beyond this strain these submicron-sized martensites interplay, leading to microstructural refinement and the formation/nucleation of nanomartensites. cg TEM images show the mechanisms of multistage work-hardening in HLS-0.43 β-Ti alloys: c dislocation-interface interactions, ε = 0.02; d SIM nucleation from the α/β interface/boundary, ε = 0.04; e SIM nucleation from the α/β interface and propagation, ε = 0.08; f massive SIM interactions leading to refinement of submicron-sized martensitic plates, ε = 0.15; g SIM interactions and nanomartensite-dislocation interactions, ε = 0.19. Error bars indicate standard deviations for three statistics. Beam parallel to a <011>β zone axis in dg.

References

    1. Banerjee D, Williams JC. Perspectives on titanium science and technology. Acta Mater. 2013;61:844–879. doi: 10.1016/j.actamat.2012.10.043. - DOI
    1. Lütjering, G. & Williams, J. C. Titanium (Springer Science & Business Media, 2007).
    1. Ritchie RO. The conflicts between strength and toughness. Nat. Mater. 2011;10:817–822. doi: 10.1038/nmat3115. - DOI - PubMed
    1. Devaraj A, et al. A low-cost hierarchical nanostructured beta-titanium alloy with high strength. Nat. Commun. 2016;7:11176. doi: 10.1038/ncomms11176. - DOI - PMC - PubMed
    1. Lu K, Lu L, Suresh S. Strengthening materials by engineering coherent internal boundaries at the nanoscale. Science. 2009;324:349–352. doi: 10.1126/science.1159610. - DOI - PubMed