. 2023 Mar;4(3):365-381.
doi: 10.1038/s43018-023-00523-0. Epub 2023 Mar 13.

SULT1A1-dependent sulfonation of alkylators is a lineage-dependent vulnerability of liver cancers

Affiliations

SULT1A1-dependent sulfonation of alkylators is a lineage-dependent vulnerability of liver cancers

Lei Shi et al. Nat Cancer. 2023 Mar.

Abstract

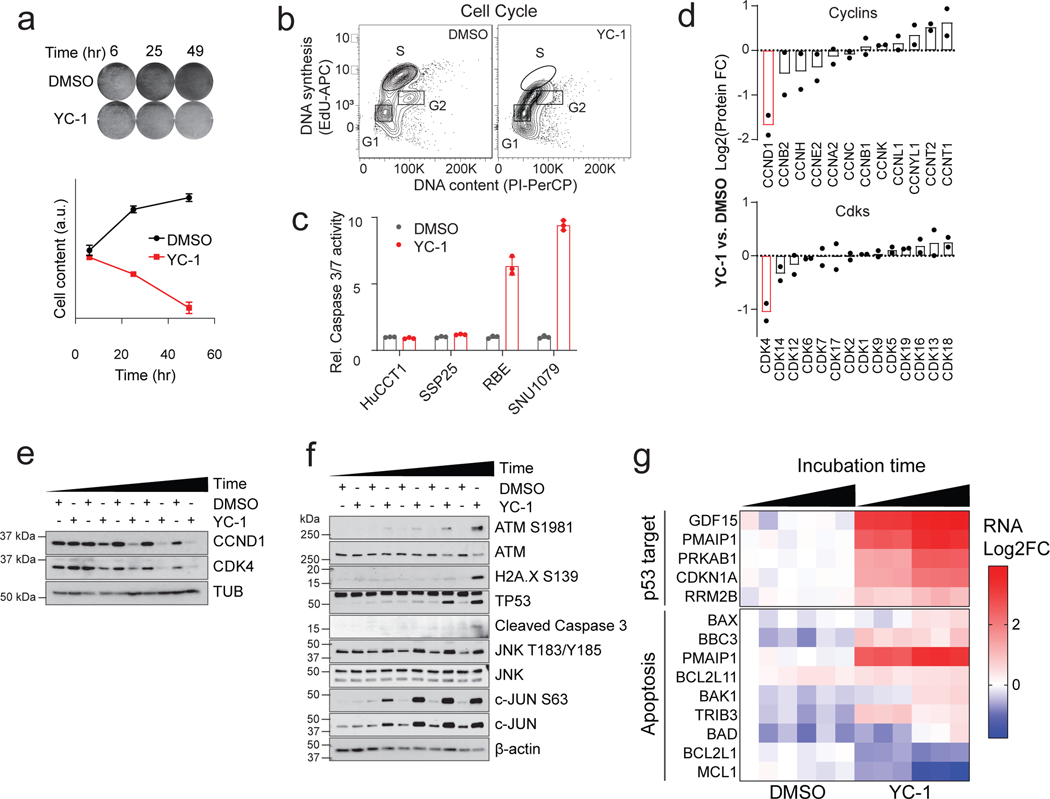
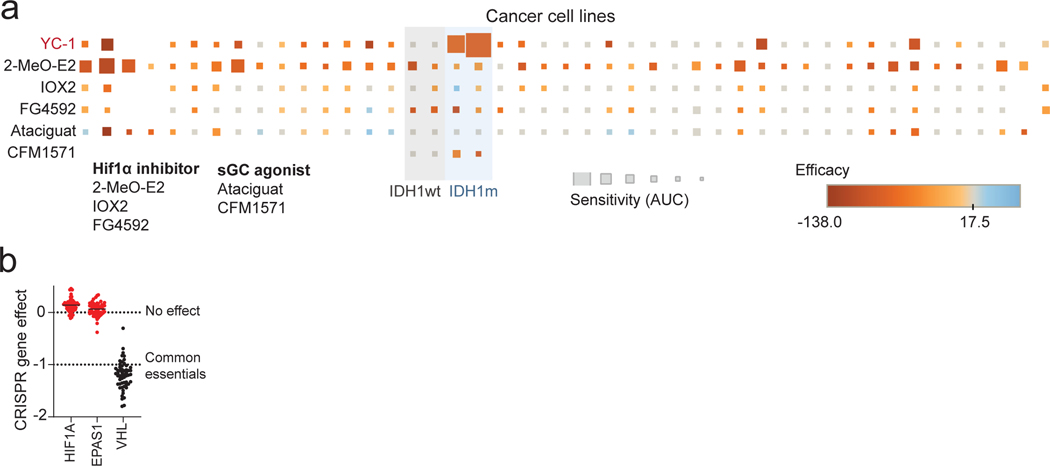
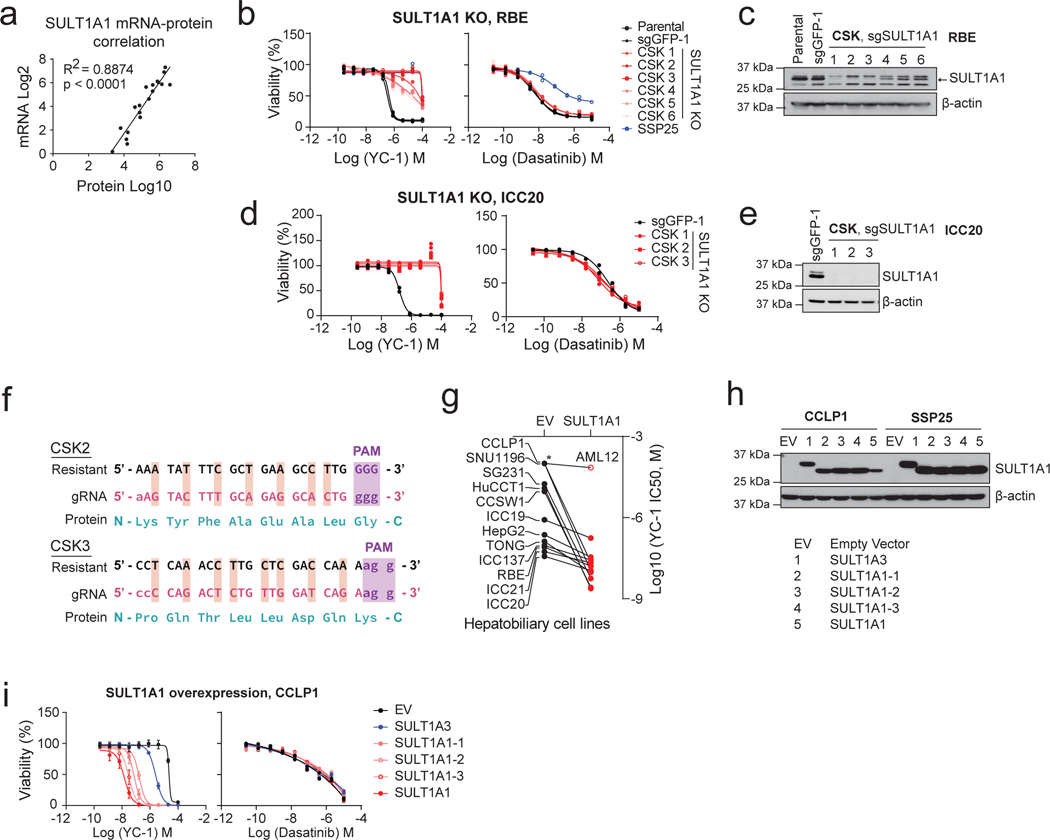
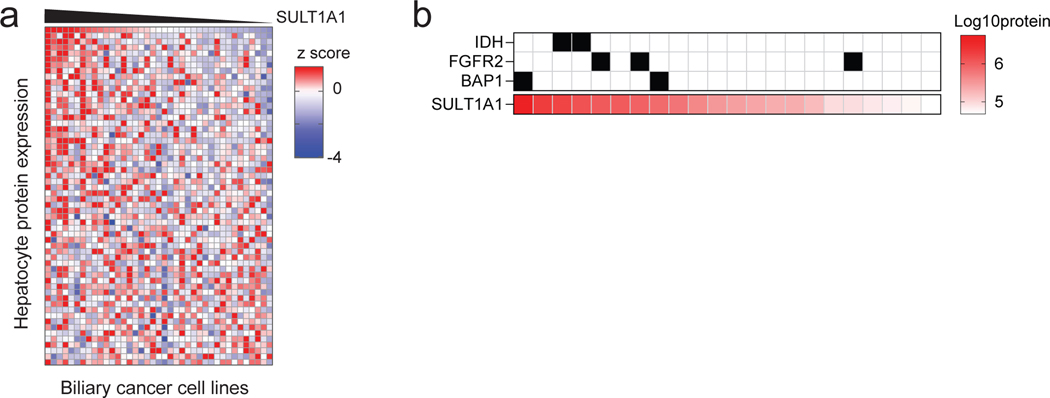
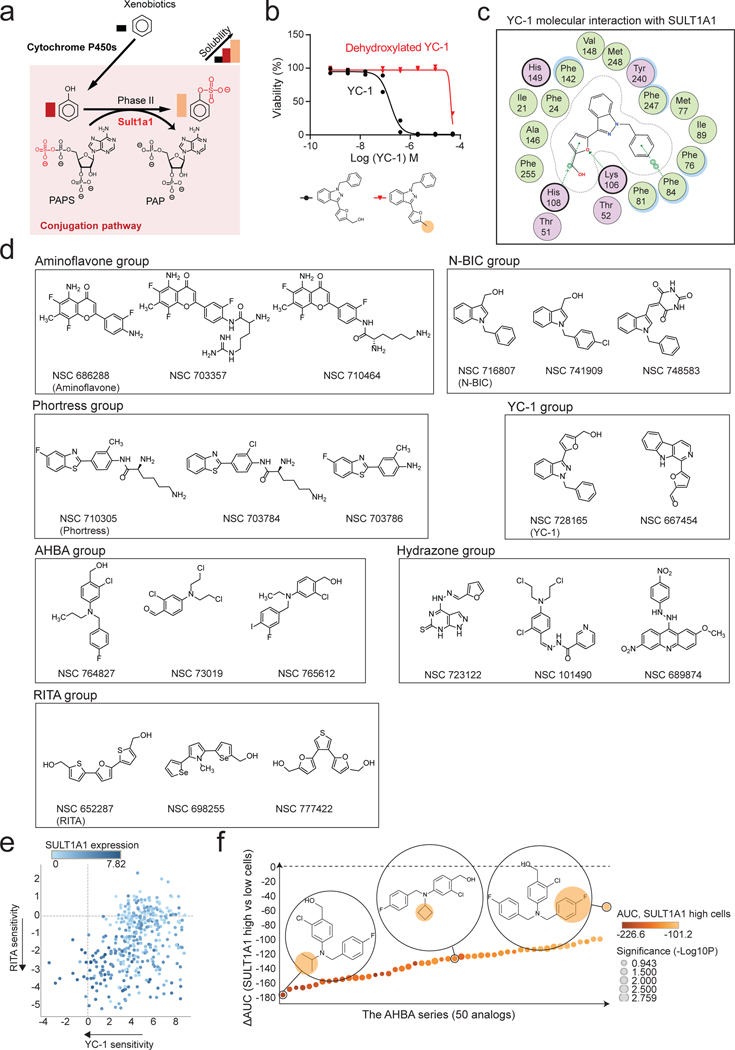
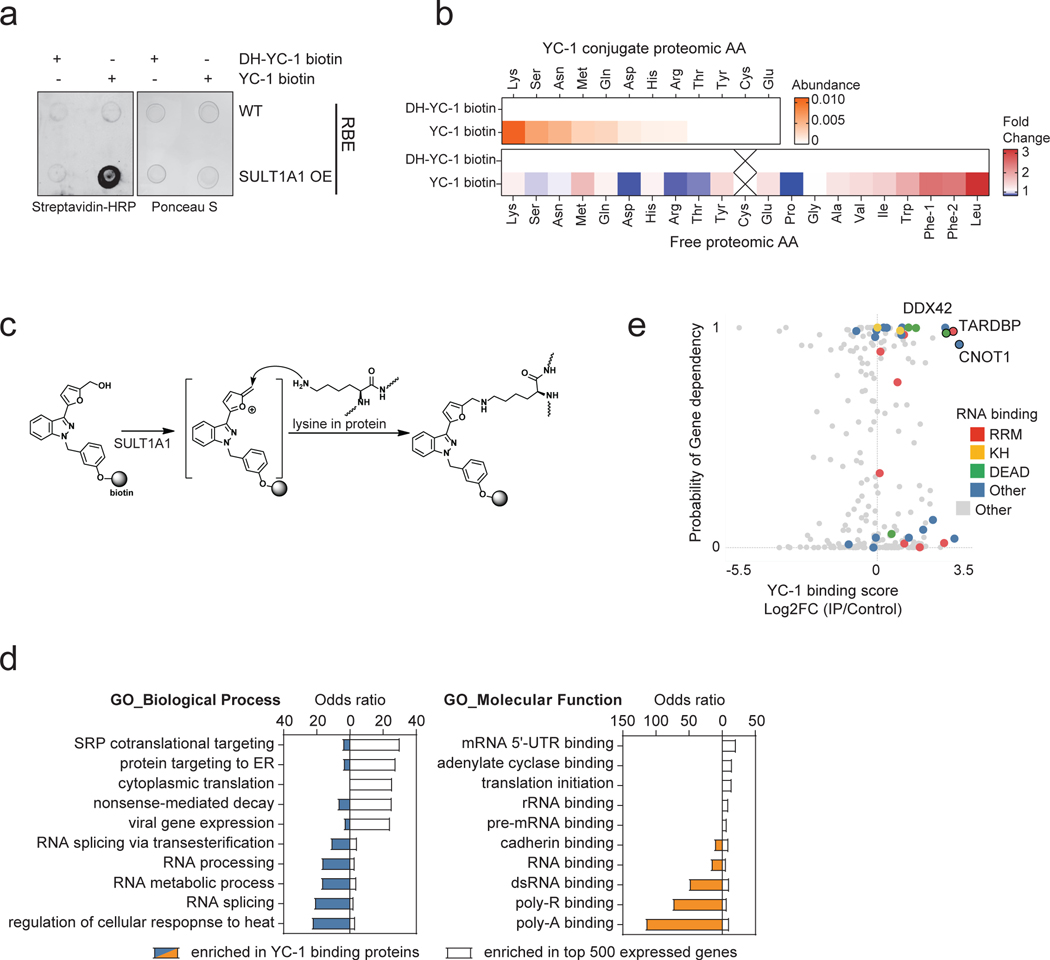
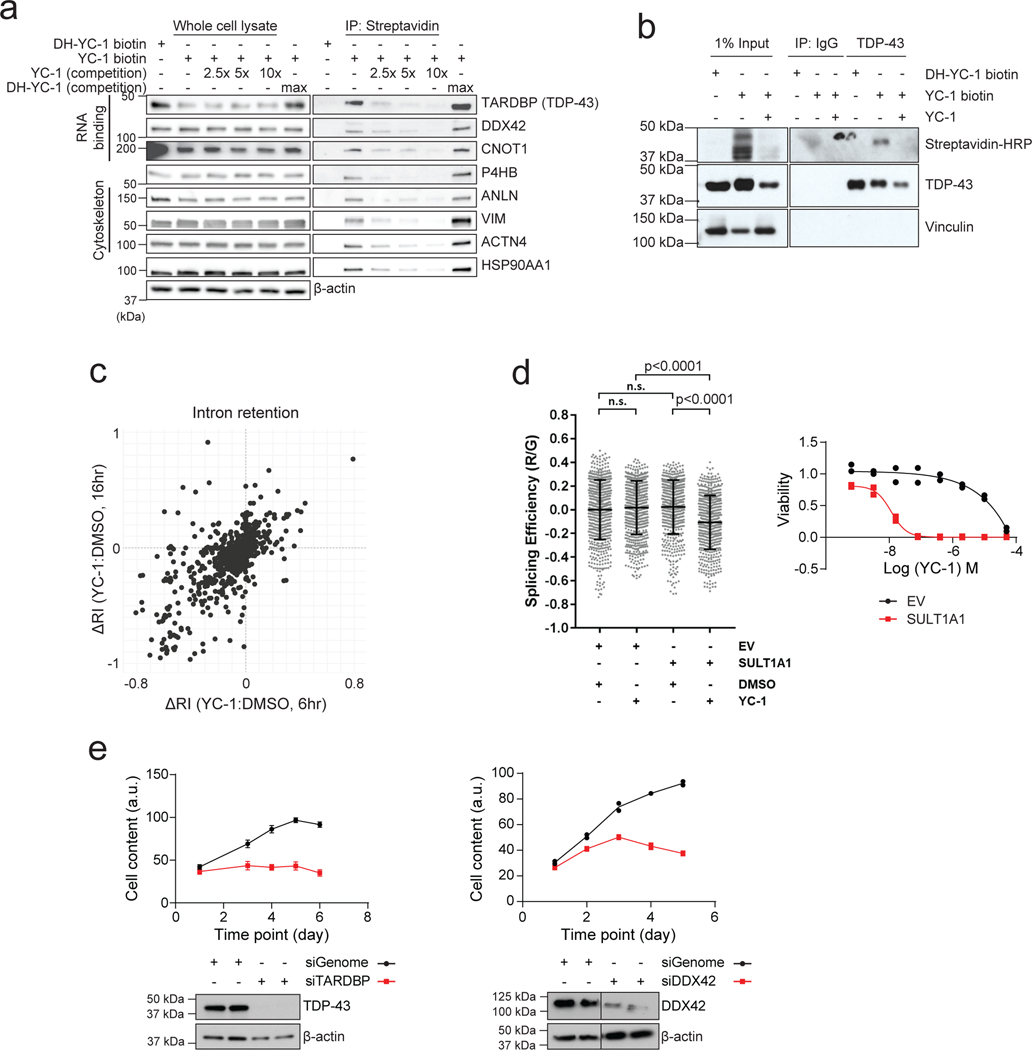
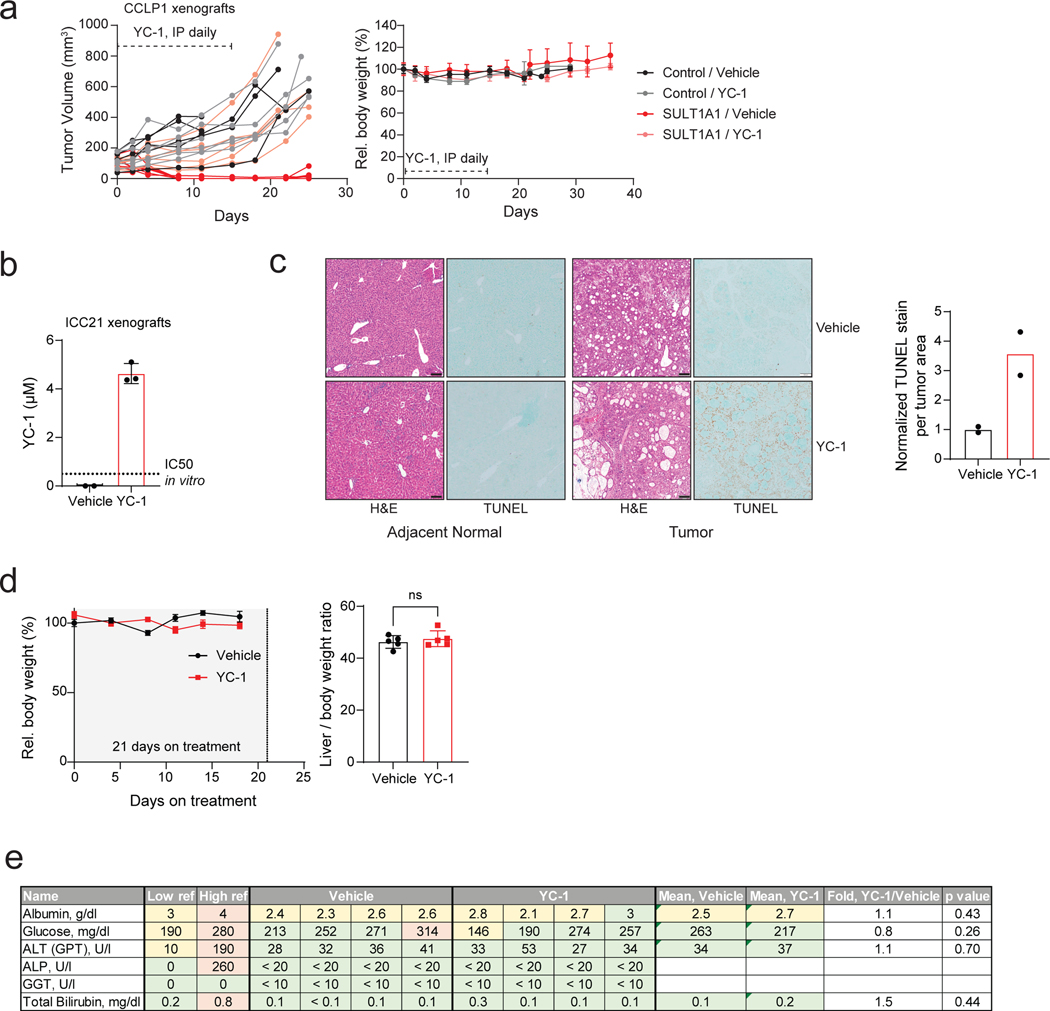
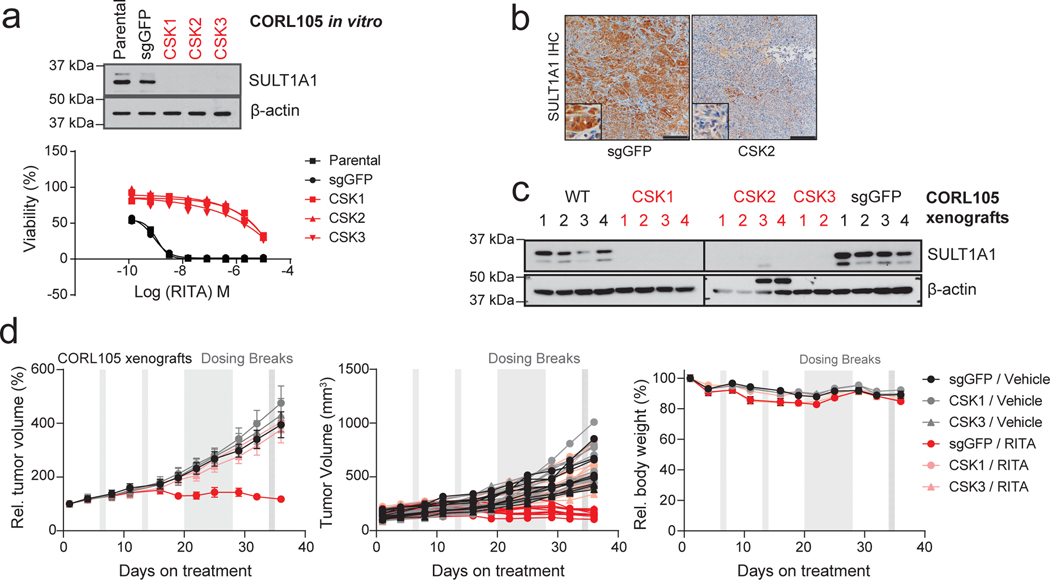
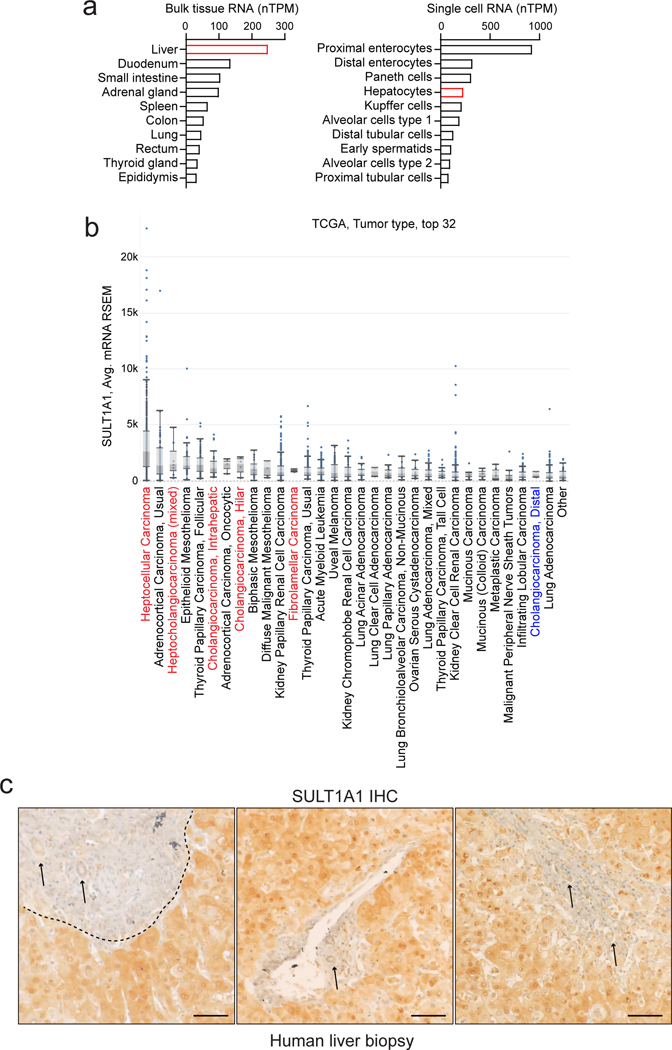
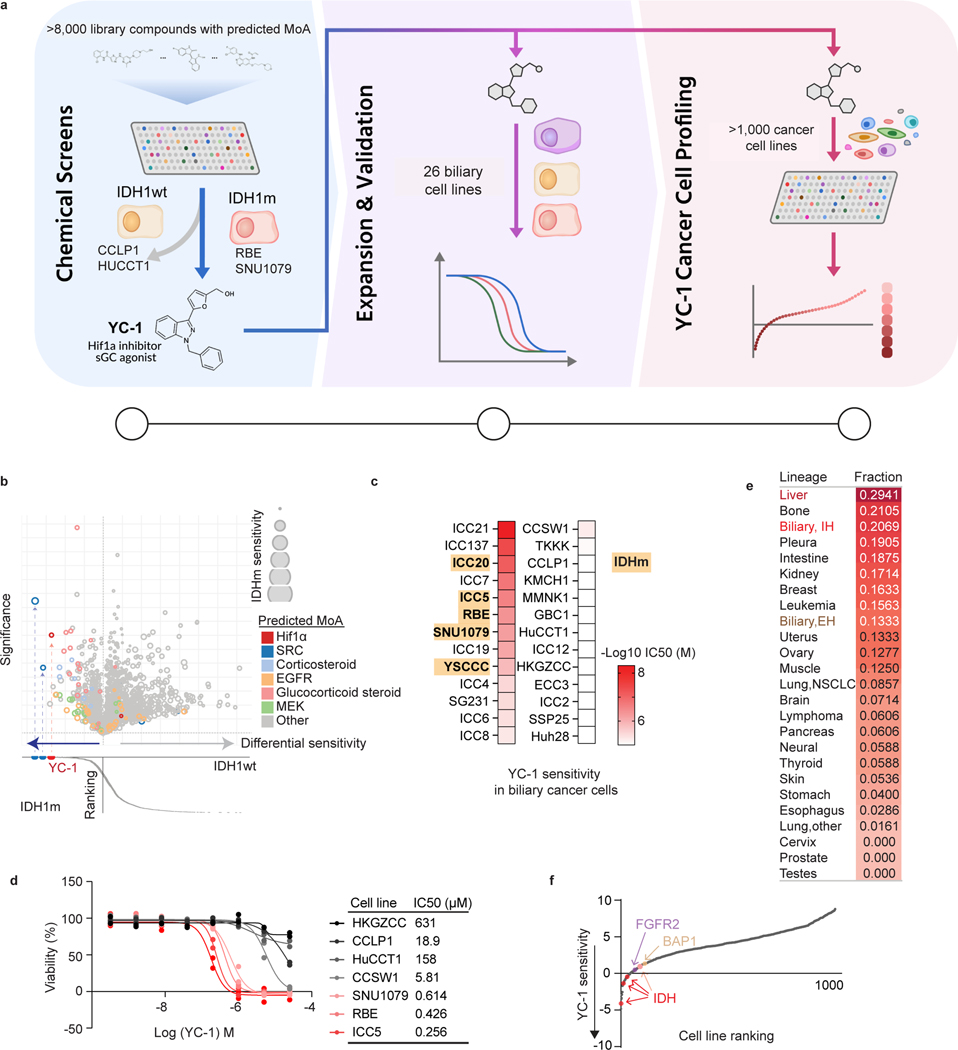
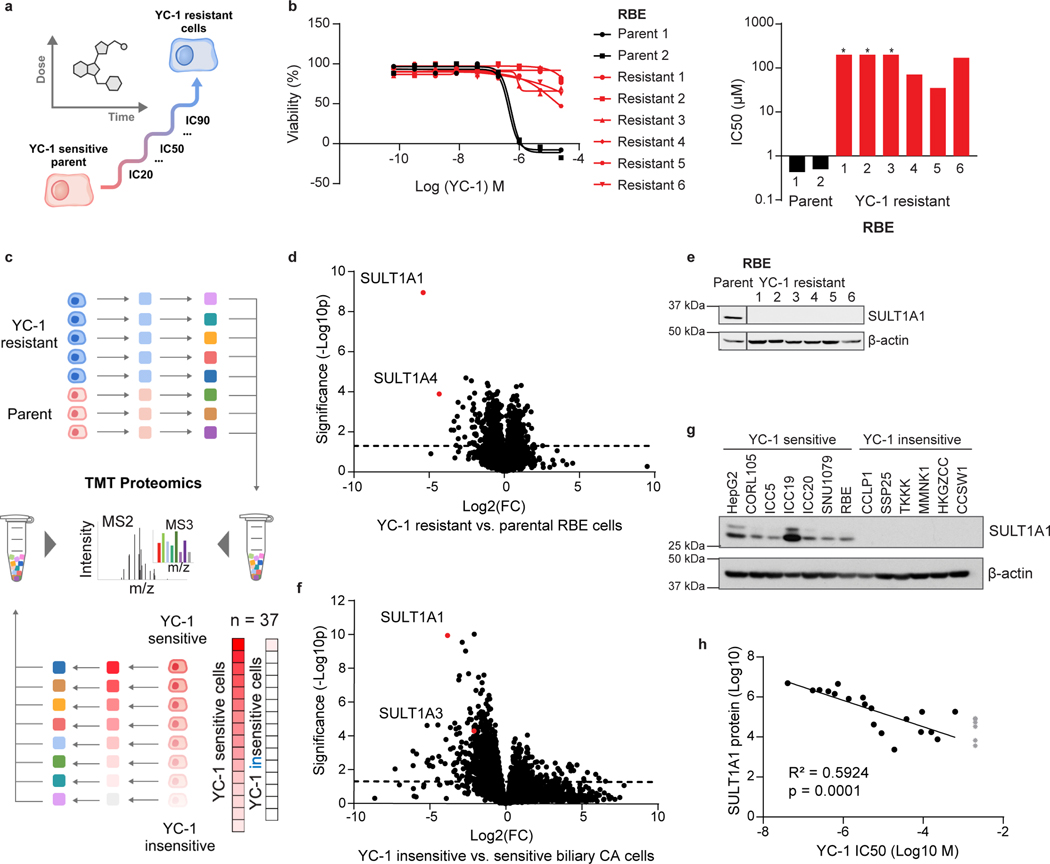
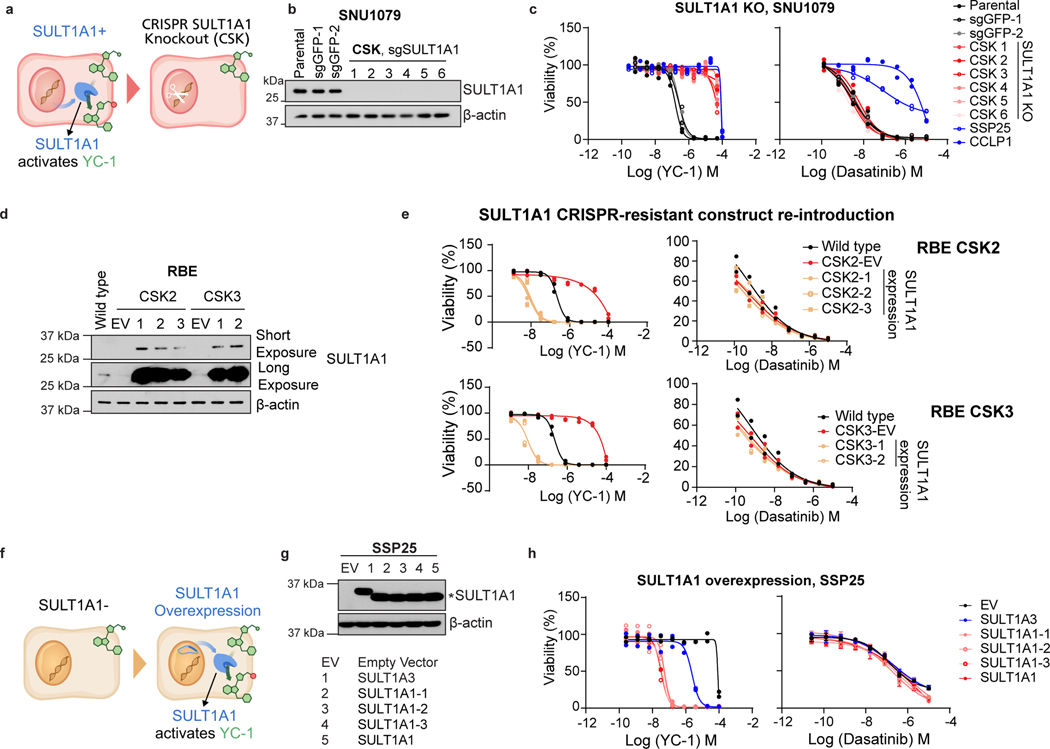
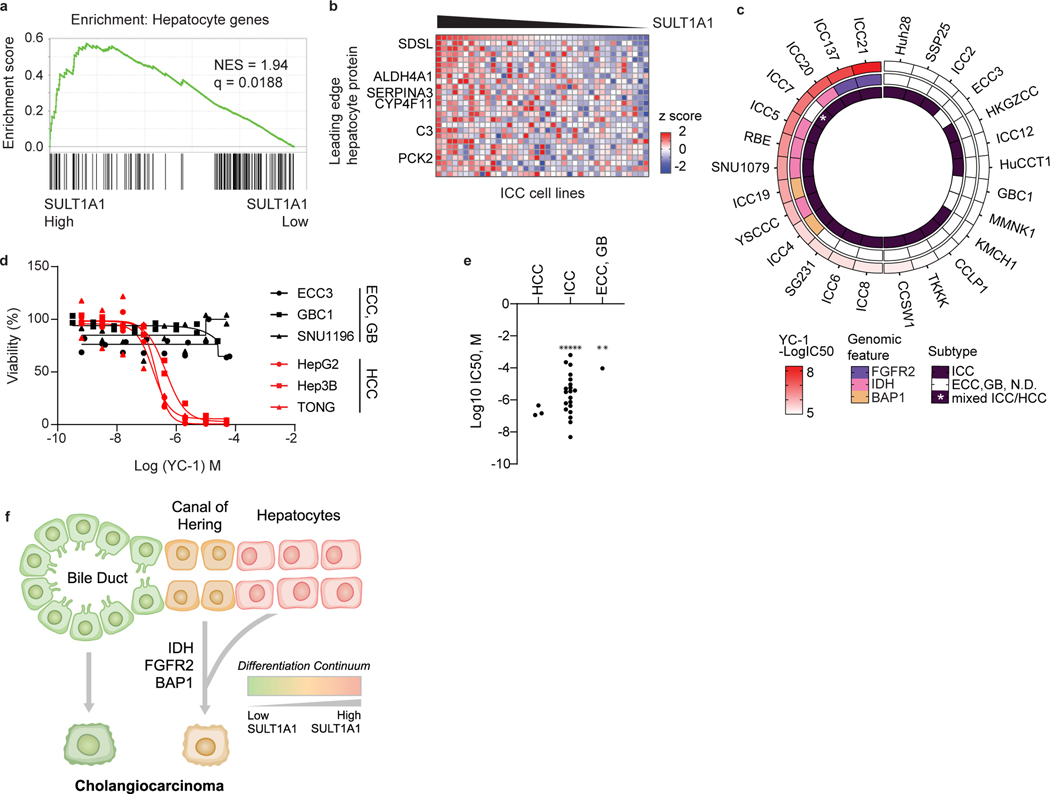
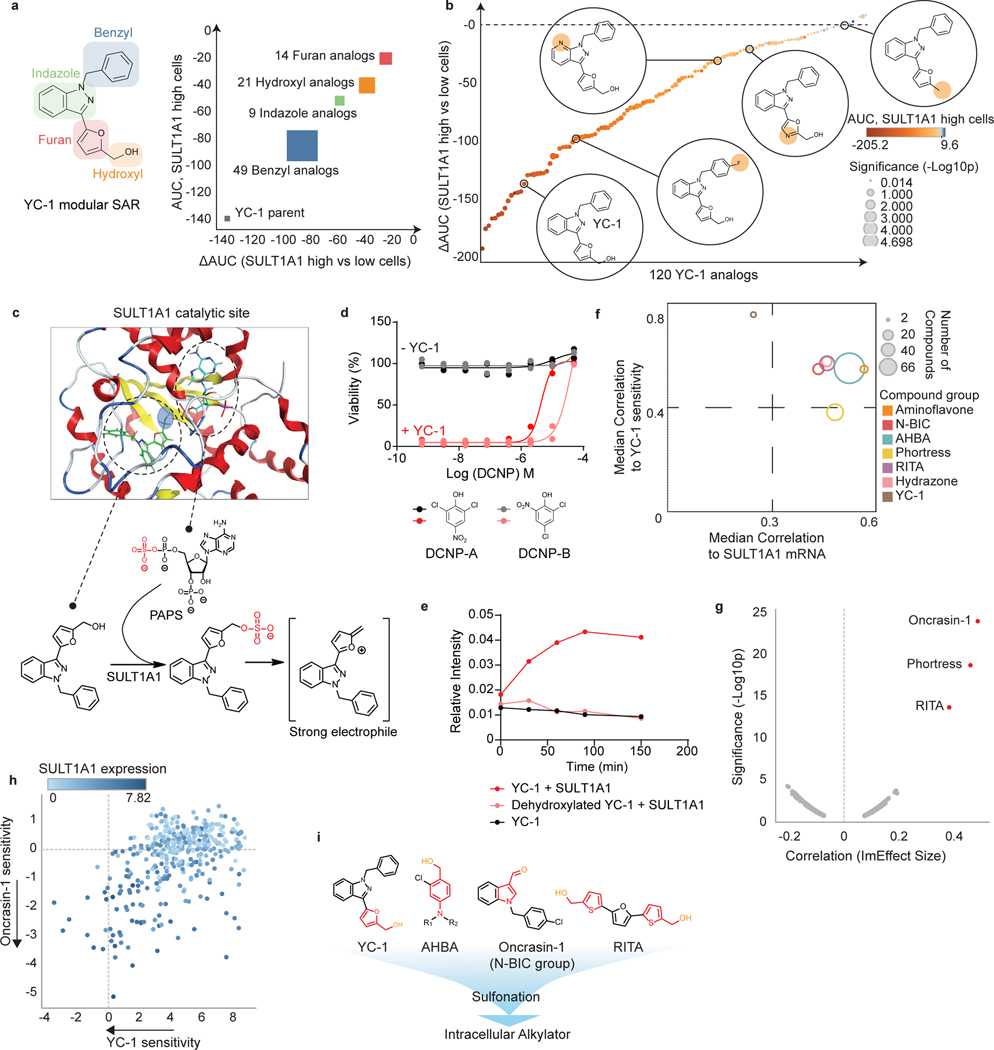
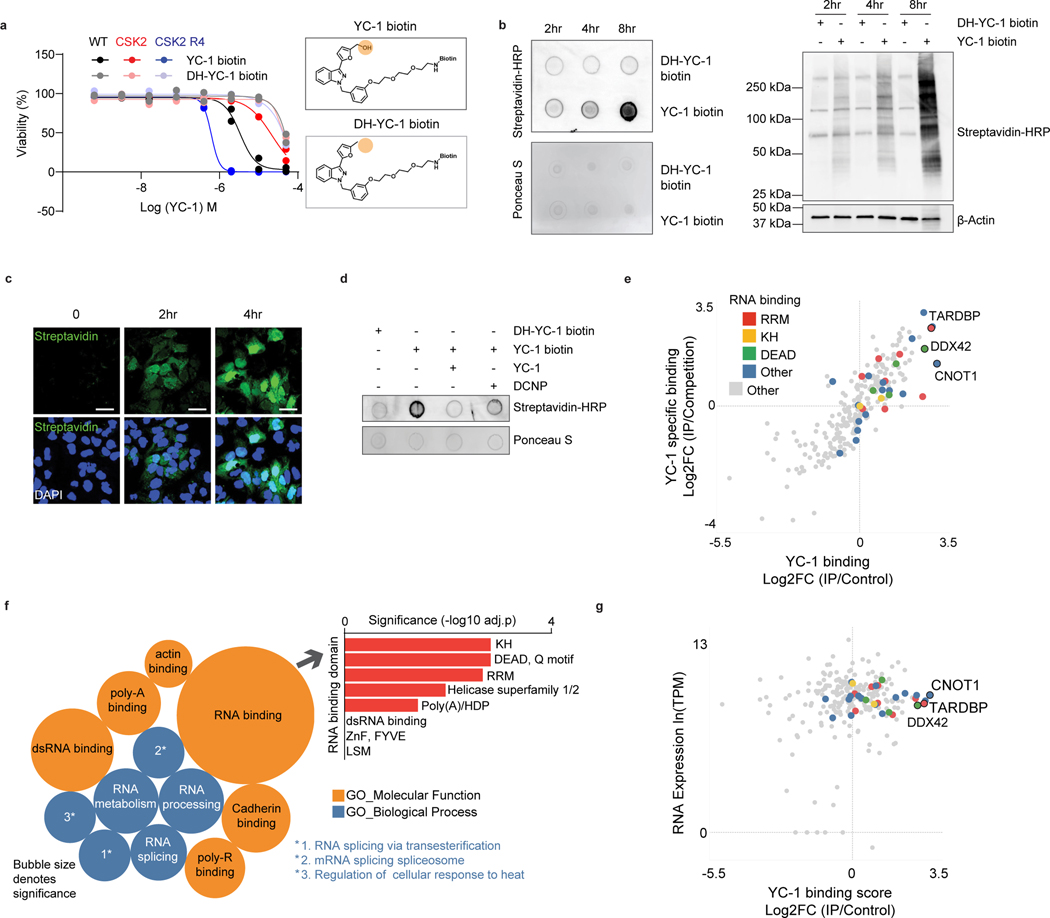
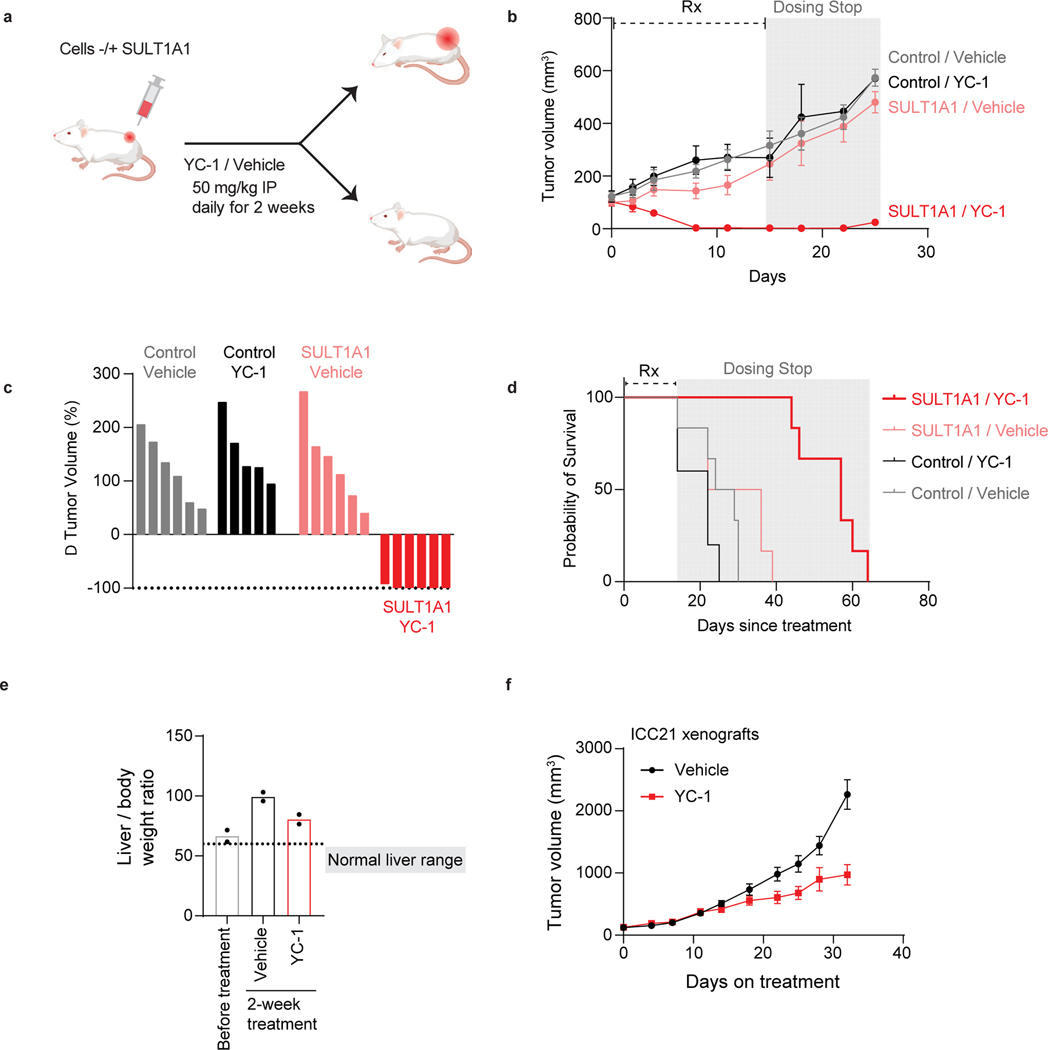
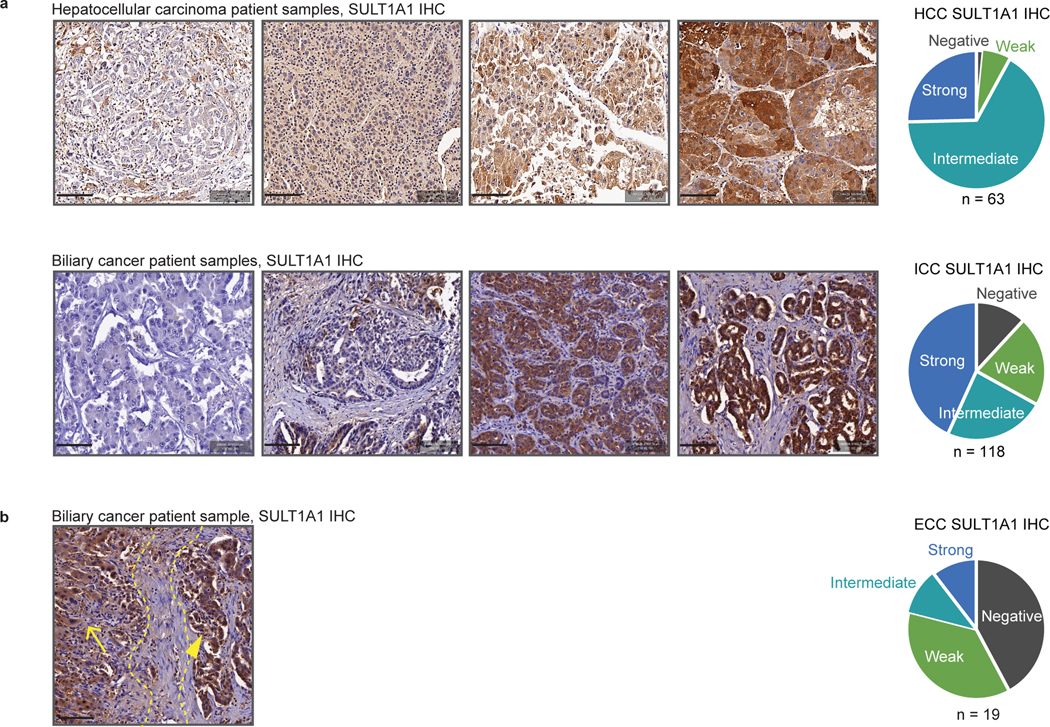
Adult liver malignancies, including intrahepatic cholangiocarcinoma and hepatocellular carcinoma, are the second leading cause of cancer-related deaths worldwide. Most individuals are treated with either combination chemotherapy or immunotherapy, respectively, without specific biomarkers for selection. Here using high-throughput screens, proteomics and in vitro resistance models, we identify the small molecule YC-1 as selectively active against a defined subset of cell lines derived from both liver cancer types. We demonstrate that selectivity is determined by expression of the liver-resident cytosolic sulfotransferase enzyme SULT1A1, which sulfonates YC-1. Sulfonation stimulates covalent binding of YC-1 to lysine residues in protein targets, enriching for RNA-binding factors. Computational analysis defined a wider group of structurally related SULT1A1-activated small molecules with distinct target profiles, which together constitute an untapped small-molecule class. These studies provide a foundation for preclinical development of these agents and point to the broader potential of exploiting SULT1A1 activity for selective targeting strategies.


Figures

Extended Data Figure 1.
Extended Data Figure 1.. Characterization of cellular response to YC-1
a, RBE cells were treated with YC-1 (1 μM) or vehicle for the indicated times and then stained with crystal violet. Data are quantified in the lower graph. Error bars are mean ± SD. Data shown were from one of the three performed experiments with similar results. b, RBE cells synchronized at the entry of S phase by double thymidine block were treated with YC-1 (1 μM) or vehicle and at the same time released into S phase. The DNA content (PI) and DNA synthesis (EdU incorporation) were analyzed after 4 hours by flow cytometry. Refer to Supplementary Figure 1 for gating strategy. c, Cleaved caspase-3 assay showing that YC-1 selectively induces apoptosis in responsive ICC cell lines (RBE and SNU1079 are IDH1 mutant). Error bars are mean ± SD. Data shown were from one of the two performed experiments with similar results. d-g, Analysis of RBE cells treated with YC-1 or DMSO. (d) Quantitative proteomics for cyclin and CDK protein levels, n = 2 biologically independent cell lines (RBE and SNU1079); Immunoblots for (e) cell cycle markers and (f) stress response markers. (g) Heatmap of YC-1 induced gene expression changes in p53 and apoptosis pathways.
Extended Data Figure 2.
Extended Data Figure 2.. YC-1 sensitivity does not correlate to known mechanisms of action
a, A panel of cancer cell lines, including IDHm and IDH WT ICC cells lines used in the initial chemical screens (shaded columns), were profiled for sensitivity to known HIF1α inhibitors and sGC agonists with highest dose of ~40 μM covering the effective range. Square size denotes sensitivity (AUC) of each cell line to a given compound, square color denotes the efficacy of the compound. b, Scatter plot of normalized CRISPR dependency scores (DepMap) of HIF1A, HIF2A (EPAS1) and VHL (as control) in hepatobiliary cell lines. Immunoblots in (e) and (f) were performed two times with similar results. Error bars (a, c, d) are mean ± SD.
Extended Data Figure 3.
Extended Data Figure 3.. YC-1 sensitivity is determined by SULT1A1 expression levels
a, Correlation between SULT1A1 mRNA and protein across biliary tract cancer cell lines. Significance was analyzed using two-tailed Student’s t-test. P < 0.05 was considered statistically significant. b, RBE control cells (parental and sgGFP cells) or CRISPR-induced SULT1A1 KO derivatives (CSK1–6) were tested for sensitivity to YC-1 (left) or dasatinib (right). SSP25 is an insensitive cell line shown as reference. Immunoblot confirming loss of SULT1A1 is shown in (c). d, ICC20 control sgGFP engineered cells or SULT1A1 KO derivatives (CSK1–3) were tested for sensitivity to YC-1 (left) or dasatinib (right). Immunoblot confirming loss of SULT1A1 is shown in (e). f, Schematic of CRISPR-resistant SULT1A1 expression constructs. g, Scatter plot showing ectopic expression of SULT1A1 sensitizes twelve hepatobiliary cancer cell lines to YC-1. The murine hepatocyte cell line, AML12, is not sensitized. Asterisk denotes IC50 value too high to extrapolate. h, Immunoblot of CCLP1 and SSP25 cells engineered to overexpressed naturally occurring SULT1A1 variants. i, YC-1 sensitivity of CCLP1 cells expressing SULT1A1 or SULT1A3. SULT1A1–1 (SULT1A1 V220M, V223M, F247L); SULT1A1– 2 (SULT1A1 S44N, V164A, V223M); SULT1A1–3 (SULT1A1 V223M). Immunoblots (c, e, h) were performed two times with similar results. Two biologically independent replicates are shown (b, d, i right). Error bars in k, left panel are mean ± SD. n=4 biologically independent experiments.
Extended Data Figure 4.
Extended Data Figure 4.. SULT1A1 expression associates with hepatocyte lineage
a, Full heatmap of hepatocyte protein expression in ICC cell lines according to GSEA using the phenotype of SULT1A1 protein levels. Serves as supporting data for Fig. 4b. b, SULT1A1 protein expression in biliary cancer PDXs. Corresponding genomic markers are annotated for hot-spot IDH1/IDH2 mutations, FGFR2 fusions, and mutation of BAP1.
Extended Data Figure 5.
Extended Data Figure 5.. Benzyl alcohol moiety determines YC-1 toxicity and defines a class of SULT1A1-activatable compounds
a, Schematic of SULT1A1-mediated sulfonation reaction in modulating xenobiotic solubility. b, Response of RBE cells (IC50) to parent YC-1 or dehydroxlated analog. Two biologically independent experiments are shown. c, Computational modeling showing 2-dimentional depiction of YC-1 molecular interactions with amino acid residues within SULT1A1 catalytic site. Serves as supporting data for Fig. 4c. d, Exemplar compounds of each chemical group identified from the NCI-60 database as having activity profiles similar to YC-1. e, Scatter plot showing correlation between YC-1 and RITA sensitivity profiles across 398 cancer cell lines. Relative SULT1A1 mRNA levels are depicted by the color scheme. f, Graph showing the ranked activity of AHBA series compounds in terms of differential sensitivity toward SULT1A1-high cells (RBE and SNU1079) versus SULT1A1-low cells (SSP25 and CCLP1) (y-axis). The color code represents the average sensitivity (AUC) of SULT1A1-high cells to each analog. Bubble sizes denote significance (p-value). Significance was analyzed using two-tailed Student’s t-test. P < 0.05 was considered statistically significant.
Extended Data Figure 6.
Extended Data Figure 6.. Proteomic identification of YC-1 binding targets
a, Dot blot of protein lysates from RBE parental cells (WT) RBE cells overexpressing SULT1A1 were treated with YC-1 biotin or DH-YC-1 biotin. Blots were probed with HRP-conjugated streptavidin (left). Ponceau S staining serves as the total protein loading control (right). b, Proteins extracted from RBE cells treated with YC-1 Biotin or DH-YC-1 Biotin were subjected to streptavidin affinity purification, digested to single amino acids, and analyzed by mass- spectrometry. Top: Heat map representing YC-1-conjugated amino acids. Bottom: Heat map representing amino acids not conjugated to YC-1 and serving to illustrate relative amino acid content of the purified proteins. c, Schematic of the predicted electrophilic reaction between sulfonated YC-1 biotin and lysine residue in proteins. d, Bar chart of odds ratios of enriched Gene Ontology classes among YC-1 binding proteins (bars to the left) in comparison to those from the most expressed 500 genes in RBE cells (bars to the right). e, Scatter plot of specific YC-1 binding score (x-axis) and probability of gene dependency from the Broad DepMap (y- axis) of YC-1 binding proteins. In (e), color code indicates proteins with common RNA binding domains identified by EnrichR analysis.
Extended Data Figure 7.
Extended Data Figure 7.. YC-1 covalently binds RNA processing factors and influences RNA splicing
a, Immunoblot from streptavidin affinity purification validating YC-1 binding proteins. RBE cells were treated with YC-1 biotin or DH-YC-1 biotin control in the presence of excess non- biotinylated YC-1 or DH-YC-1 as indicated. Left: Expression of candidate YC-1 binding proteins in whole cell lysates. Right: Immunoblot after Streptavidin capture, showing dose-dependent competition by parent YC-1. b, Immunoblot from TARDBP immunoprecipitation validating direct YC-1 binding. RBE cells were treated as in (a). The immunoblots (a, b) were performed two times with similar results. c, Scatter plot of genes with altered intron retention identified from RNA-seq analysis of RBE and SNU1079 cells treated with YC-1 or vehicle for 6 and 16 hours. N = 3 biological replicates per condition. ΔRI is the intron retention score calculated by the SALMON software package. d, Left, a TARDBP splicing efficiency assay assessing SULT1A1 dependent YC-1 impact on TARDBP RNA splicing activity. 293T cells exogenously expressing SULT1A1 or empty vector were transiently transfected with the reporter module containing plasmid and treated with YC-1 or DMSO vehicle and analyzed by fluorescent confocal microscope with GFP (G) and mCherry (R) laser. Statistical significance annotated between individual conditions (Welch unpaired t-test). n=3 biologically independent experiments with cells from two independent images per experiment included (>500 cells in total). “n.s.” denotes not significant. Right, YC-1 sensitivity assay confirming stable SULT1A1 expression. Two biologically independent experiments are shown. e, siRNA targeting TARDBP (left) or DDX42 (right) reduced target protein expression and cell number monitored for 5–6 days post transfection. Error bars in left panel are mean ± SD. Data shown were from one of the two performed experiments with similar results.
Extended Data Figure 8.
Extended Data Figure 8.. SULT1A1 determines YC-1 efficacy in vivo
a, SULT1A1-positive and SULT1A1-negative (Control) CCLP1 cells were implanted subcutaneously into NSG mice. Once tumors reached ~100 mm3, mice were treated with YC-1 (50 mg/kg) or vehicle for 14 days. Mice were then monitored for disease progression in the absence of treatment. Left: Graph of individual serial tumor volumes. These data are presented in the form of mean volumes in Figure 6b of the main figures. Right: Serial changes in body weight. Error bars are mean ± SEM. n=5–6 independent animals per group. b-e, Study of SULT1A1-high expressing ICC21 xenografts in response to YC-1 treatment. b, YC-1 concentration was assayed with three independent ICC21 xenograft tumor samples with YC-1 or vehicle treatment by mass spectrometry. Dashed line marks the in vitro ICC21 sensitivity to YC-1 treatment (IC50). Error bars are mean ± SD. n=3 independent samples per group. c, Tissue sections of ICC21 orthotopic tumors (middle panels) and adjacent normal (left panels) subjected to H&E and TUNEL staining. TUNEL staining was quantified in graph at the right and two independent animals per group are shown. Scale bar, 100 μm. d, Serial changes in body weight (left) were monitored for three weeks for subcutaneous tumor-bearing mice on YC-1 treatment and the liver and body weight ratios (right) were recorded at the euthanization point. Error bars are mean ± SEM. n=5 independent animals per group, two-tailed, unpaired Student’s t-test. e, table displaying plasma markers indicative of liver function from vehicle and YC-1 treated mouse plasma samples (p values derived by two-tailed, unpaired Student’s t-test).
Extended Data Figure 9.
Extended Data Figure 9.. SULT1A1 determines RITA efficacy in vivo.
a-d, Study of SULT1A1-dependent sensitivity of CORL105 xenograft model to RITA. CORL105 is an IDH1-R132C mutant lung adenocarcinoma cell line with high endogenous SULT1A1 levels, which has robust growth in vivo. a, Generation of CORL105 derivatives with CRISPR- mediated SULT1A1 KO. Upper, Immunoblot showing loss of SULT1A1 protein expression upon CRISPR-mediated deletion of SULT1A1 (CSK1–3) and robust SULT1A1 detection in parental CORL105 cells and control sgGFP cells. The immunoblot was performed two times with similar results. Lower, demonstration that CORL105 cells are highly sensitive to RITA in a SULT1A1- dependent manner. Two biologically independent experiments are shown. b, Representative immunohistochemistry staining from CORL105 control (sgGFP) and SULT1A1 KO (CSK2) xenografts, showing loss of staining with the SULT1A1 antibody in the SULT1A1 KO model. Serves as validation of SULT1A1 antibody specificity for IHC studies. Similar results were obtained in samples from 2–4 independent animals per group and three groups with independent sgRNA designs targeting SULT1A1 gene. Scale bar, 200 μm. c, Immunoblot confirming SULT1A1 protein loss in xenograft tumors generated from SULT1A1 KO CORL105 cells. The immunoblot was performed a single time, with multiple independent tumors analyzed per condition. d, Mice harboring tumors of 100–150 mm3 were treated with RITA (100 mg/kg) or vehicle daily with intermitted dosing breaks. Graphs show serial monitoring of group tumor volume (left), individual tumor volume (middle) and body weight (right). Dosing breaks are denoted by grey shading. Error bars are mean ± SEM . n=5–10 independent animals per group.
Extended Data Figure 10.
Extended Data Figure 10.. SULT1A1 expression is prominent in liver cancers.
a, Normalized SULT1A1 RNA expression across bulk normal tissues (left, top 10) and single cell types (right, top 10) in human body (retrieved from proteinatlas.org). b, Box and whisker plot derived from TCGA analysis of SULT1A1 expression in patient samples showing top 32 tumor types ranked by median SULT1A1 mRNA expression. Liver cancer types (x-axis) are coded red. Note that extrahepatic cholangiocarcinoma is negative for SULT1A1 (coded blue). The center of the box indicates the median, upper and lower lines indicate upper and lower quartiles and the mark with the greatest and lowest values indicate maximum and minimum. c, Representative immunohistochemical images of SULT1A1 staining in normal human liver from multiple patients, demonstrating expression in the hepatocytes. Arrows point to normal bile ducts with no SULT1A1 staining. Similar results were obtained from multiple samples from independent patients that were processed at independent times. Scale bar, 200 μm.
Figure 1.
Figure 1.. Identification of selective YC-1 activity against liver cancer subsets
a, Schematic of drug screening and validation studies. b, Graphs of results of small molecule screen with MIPe library in IDHm ICC cell lines (SNU1079 and RBE) and IDH1 WT ICC cell lines (HUCCT1 and CCLP1). Upper graph: differential sensitivity (x-axis) and significance (y-axis; -logP) of compounds towards IDHm versus IDH1 WT lines. Relative sensitivity of the IDHm cells is denoted by size of the bubble. Lower graph: ranking of individual compounds according to differential sensitivity. Significance was analyzed using two-tailed Student’s t-test. P < 0.05 was considered statistically significant. The screen was performed once using a concentration-response profile (stepwise 5-fold dilutions of drug between 92.1 μM and 0.006 μM). c, Heatmap of YC-1 sensitivity in 25 biliary cancer cell lines and in MMNK1 cells (immortalized bile duct). IDHm cell lines are highlighted. d, IC50 measurements for YC-1 in select IDHm (red) and IDH WT (black/grey) ICC cell lines. Two biologically independent experiments are shown. e, Compiled results of YC-1 sensitivity in 1022 cancer cell lines. The data show the ranked fraction of YC-1-sensitive cell lines in each cancer type. The screen was performed once using 9-point two-fold dilution series of YC-1. f, Graph showing that ICC cell lines with IDH1/IDH2, FGFR2 and BAP1 genomic alterations rank among the most sensitive in the screen. “YC-1 sensitivity” (y-axis) denotes Log10 transformed YC-1 IC50s in μM. Red dots represent RBE, SNU1079 and ICC5 cells (IDH1-R132C/S/L mutant), and the pink dot represents YSCCC cells (IDH1-R100Q mutant).
Figure 2.
Figure 2.. YC-1 sensitivity correlates to SULT1A1 expression levels
a, Schematic of acquired YC-1 resistance experiment. b, Sensitivity (IC50) to YC-1 of parental RBE cells and acquired resistance models. IC50 curves (b) and computed values (c) are shown. Asterisk indicates IC50 too high to calculate based on (b). Graphs show means of technical replicates. c, Schematic of TMT proteomics analysis of parental and YC-1-resistant RBE cells (upper portion, corresponds with panel [d]), and of a large panel of ICC cell lines (lower, corresponds with panel [f]). d, Volcano plot of proteomics data comparing parental and resistant RBE cell lines, highlighting significant depletion of SULT1A1 in resistant lines (two-tailed, unpaired Student’s t-test). e, Immunoblot validating SULT1A1 loss in resistant cells. Samples are from the same gel and exposure. The cropping removes an irrelevant lane. f, TMT proteomics comparing 5 YC-1-sensitive (IC50 median = 0.256 μM) and 32 YC-1-insensitive (IC50 median = 18.9 μM, not including cell lines with no response) biliary cell lines (two-tailed, unpaired Student’s t-test). g, Immunoblot for SULT1A1 in the indicated cell lines. Each is biliary, with the exception of HepG2 (HCC) and CORL105 (SULT1A1-high lung cancer). h, Graph of correlation between SULT1A1 protein levels and YC-1 IC50 across a set of 19 biliary tract cell lines. Asterisk indicates no response to YC-1. The linear regression line is shown. Immunoblots (e, g) were from one of the two performed experiments with similar results.
Figure 3.
Figure 3.. SULT1A1 determines YC-1 sensitivity
a, Schematic for genetic knockout of SULT1A1 in ICC cells. b, Immunoblot for SULT1A1 in SNU1079 parental cells or CRISPR engineered derivatives with control sgGFP or sgSULT1A1 KO (CSK1–6). c, SNU1079 parental cells or the engineered derivatives were tested for sensitivity to YC-1 (left) or dasatinib (right). SSP25 and CCLP1 are ICC cell lines that are insensitive to both drugs and shown for reference. Two biologically independent experiments are shown. d, Immunoblot demonstrating restored expression of SULT1A1 using a CRISPR-resistant construct in RBE SULT1A1 KO cells. e, Re-expression of CRISPR-resistant SULT1A1 re-sensitizes SULT1A1 KO RBE cells to YC-1. Data shows mean measurements from two biologically independent experiments. f, Schematic for ectopic overexpression of SULT1A1 in ICC cells. g, Immunoblot confirming overexpression of SULT1A1 (denoted by *), corresponding to panel h. Several common germline variants of SULT1A1 were tested: SULT1A1–1 (V220M, V223M, F247L), SULT1A1–2 (S44N, V164A, V223M) and SULT1A1–3 (V223M). h, Ectopic expression of SULT1A1 sensitizes SSP25 cells to YC-1. Two biologically independent experiments are shown on the left panel. Error bars in the right panel are mean ± SD, n=4 biologically independent experiments. SULT1A3 only modestly increases sensitivity. Immunoblots (b, d, g) were from one of the two performed experiments with similar results.
Figure 4.
Figure 4.. SULT1A1 expression associates with hepatocyte lineage
a, b, GSEA (a) and heatmap (b) of hepatocyte protein expression in ICC cell lines according to SULT1A1 protein levels. Significance was calculated as false discovery rate by the GSEA package. Q < 0.25 was considered statistically significant. c, Circos plot of 28 biliary tract cell lines depicting YC-1 sensitivity, biliary cancer type, and specific molecular features (i.e., IDH1 mutation, FGFR2 fusion, and absence of BAP1 protein expression). Asterisk indicates mixed ICC/HCC histology. ECC, extrahepatic cholangiocarcinoma; GB, gallbladder carcinoma; N.D., normal duct. d, YC-1 sensitivity measurement in representative HCC, ECC, and GB cell lines. Two biologically independent experiments are shown. e, Scatter plot comparing YC-1 IC50s of cell lines between liver cancer subtypes. Asterisks indicate cell lines exhibiting no response to YC-1 (IC50 not calculable). f, Model relating SULT1A1 expression, liver lineage marker expression, and genomic alterations in ICC.
Figure 5.
Figure 5.. Benzyl alcohol moiety determines YC-1 toxicity and defines a class of SULT1A1-activatable compounds
a, b, A set of 120 analogs of YC-1 were generated and screened for activity against two SULT1A1-high cell lines (RBE and SNU1079) and two SULT1A1-low cell lines (CCLP1 and SSP25). a, Schematic of chemical moieties of YC-1 (left) and summary of SAR data for the YC-1 analogs grouped according to modifications in the indicated chemical groups. The y-axis represents shifts in AUC of the specific YC-1 analogs versus parental YC-1 in SULT1A1-high cell lines. The x-axis compares the activity of the analogs versus parental YC-1 in terms of differential sensitivity toward SULT1A1-high cell lines relative SULT1A1-low lines. b, Graph showing the ranked activity of YC-1 analogs (or parent compound) in terms of differential sensitivity toward SULT1A1-high cells versus SULT1A1-low cells (y-axis). The color code represents that relative sensitivity of SULT1A1-high cells to each analog. Bubble sizes denote significance (p-value). c, Structural modeling analysis showing docking of YC-1 in the SULT1A1 crystal structure (PDB: 3U3M). The lower panel show schematic of predicted sulfonation of YC-1 by SULT1A1. d, Treatment of RBE cells with YC-1 in the presence or absence of a potent (DCNP-A) or less potent (DCNP-B) SULT1A1 inhibitor. Two biologically independent experiments are shown. e, In vitro enzymatic assay showing that SULT1A1 modifies YC-1 but not its dehydroxylated analog. YC-1 or dehydroxylated YC-1 were incubated with recombinant SULT1A1 protein in the presence of p-nitrophenylsulfate and 5′-phosphoadenosine-3′-phosphosulfate (for an additional control, YC-1 was incubated in the reaction buffer without SULT1A1). The reaction was monitored by released p-nitrophenol with UV absorbance at 405nm. Data shown are mean measurements from one of the two performed experiments with similar results. f, Results of computational analysis of NCI-60 database using CellMiner showing compound groups whose activity profiles are highly correlated with that of YC-1 (y-axis) and with SULT1A1 mRNA levels (x-axis). The bubble size represents number of compounds with a given group. g, Volcano plot of computational analysis of the PRISM database showing correlation of sensitivity profiles of compounds with YC-1 profiles. Pearson correlations (ImEffect size on x axis) were computed between the sensitivity profile of YC-1 (Supplementary Table 3 and Fig. 1f) and the DepMap PRISM Drug Sensitivity data. For visualization purpose, only drugs with Pearson correlation > 0.07 are shown. h, Scatter plot showing correlation between YC-1 and Oncrasin-1 sensitivity profiles across 398 cancer cell lines. Relative SULT1A1 mRNA levels are depicted by the color scheme. i, Chemical structures of representative SULT1A1 activatable compounds. Note the common benzyl alcohol moieties. Significance (b, f) was analyzed using two-tailed Student’s t-test. P < 0.05 was considered statistically significant.
Figure 6.
Figure 6.. Proteomic identification of YC-1 binding targets
a, Activity of YC-1 biotin and dehydroxylated (DH) YC-1 biotin against parental RBE cells and derivative lines with SULT1A1 KO (CSK2) and SULT1A1 KO with SULT1A1 re-expression (CSK2 R4). Two biologically independent experiments are shown. b, Dot blot (upper) and western blot (lower) of protein lysates from RBE cells treated with YC-1 biotin or DH-YC-1 biotin for the indicated times. Blots were probed with HRP-conjugated streptavidin. Ponceau S staining for dot blot and β-actin for western blot serve as the total protein loading control. c, Immunofluorescence images of RBE cells treated with YC-1 biotin. Fixed cells were stained with Streptavidin-FITC to detect YC-1 biotin and with DAPI for visualization of the nucleus. Scale bar, 17 μm. d, Dot blot of protein lysates of RBE cells treated as indicated for specificity and SULT1A1 dependency. e, Scatterplot of results of YC-1 pulldown proteins. Enrichment is revealed by binding to YC-1 biotin relative to dehydroxylated inactive YC-1 biotin control (x-axis) and YC-1 biotin binding competed by parent YC-1 (y-axis). Proteins with specific RNA binding domains are color coded. f, Bubble chart of YC-1 binding proteins displaying enrichments based on the Gene Ontology Molecular Function and Biological Process databases (See Methods). The bar graph (right) depicts enrichment among different classes of RNA binding domains. Significance was calculated as adjusted p value using two-sided Fisher’s exact test and the Benjamini-Hochberg method for correction for multiple hypotheses testing. Adjusted p value < 0.05 was considered statistically significant. Immunoblot and immunofluorescence in (b) and (c) were performed two times with similar results. g, Graph showing correlation between specific YC-1 binding score for proteins detected in YC-1 pull-downs and mRNA expression of the associated gene. In (e and g), color code indicates proteins with common RNA binding domains identified by EnrichR analysis.
Figure 7.
Figure 7.. SULT1A1 determines YC-1 efficacy in vivo
a-d, SULT1A1-positive and SULT1A1-negative (Control) CCLP1 cells were implanted subcutaneously into NSG mice. Once tumors reached ~100 mm3, mice were treated with YC-1 (50 mg/kg) or vehicle for 14 days. Mice were then monitored for disease progression in the absence of treatment. b, Graph of serial tumor volumes. Error bars are mean ± SD. c, Waterfall plot of best tumor response under treatment. N = 6 mice per group, except the Control, YC-1 group (N=5 mice) d, Survival analysis of mice during treatment and after cessation of treatment. N = 6 tumors per group, except the Control, YC-1 group (N=5 tumors). e, ICC21 liver orthotopic xenografts were used to assess YC-1 efficacy. Mice were treated with YC-1 or vehicle for 14 days as above, starting at a tested time point with observable liver mass. Liver and body weight ratio at each end point was used as surrogate for tumor mass. Below dashed line is the range liver and body weight ratio of a healthy mouse liver falls within. Statistical significance annotated comparing treatment conditions. Two independent animals per group are shown. f, ICC21 subcutaneous xenografts were treated with YC-1 or vehicle as above until the vehicle group reached the end point. Error bars are mean ± SEM. n=6 independent animals per group.
Figure 8.
Figure 8.. SULT1A1 is frequently expressed in liver cancer patient tumor samples
a, Representative IHC staining for SULT1A1 expression in HCC and cholangiocarcinoma (ICC and extrahepatic cholangiocarcinoma [ECC]) patient samples showing examples of negative, low, medium, and high expression. Semi-quantitative measure of staining intensity shown on the pie charts (right). N: Number of samples from independent patients examined (HCC, N = 63; ICC, N = 118; ECC, N = 19). Scale bars span 100 μm each. b, Representative IHC staining for SULT1A1 expression in ICC patient sample showing SULT1A1 expression in tumor cells (right) and adjacent normal liver hepatocytes (left). 6 tissue cores from 6 cases were analyzed. Yellow dashed lines demarcate the tumor and adjacent normal liver areas, marked by arrowhead and arrow, respectively. Scale bar spans 100 μm.

Comment in

References

    1. Bray F. et al. Global cancer statistics 2018: GLOBOCAN estimates of incidence and mortality worldwide for 36 cancers in 185 countries. CA Cancer J Clin 68, 394–424 (2018). - PubMed
    1. Dasgupta P. et al. Global Trends in Incidence Rates of Primary Adult Liver Cancers: A Systematic Review and Meta-Analysis. Front Oncol 10, 171 (2020). - PMC - PubMed
    1. Valle JW, Kelley RK, Nervi B, Oh DY & Zhu AX Biliary tract cancer. Lancet 397, 428–444 (2021). - PubMed
    1. Llovet JM et al. Molecular pathogenesis and systemic therapies for hepatocellular carcinoma. Nat Cancer 3, 386–401 (2022). - PMC - PubMed
    1. Cancer Genome Atlas Research Network. Electronic address, w.b.e. & Cancer Genome Atlas Research, N. Comprehensive and Integrative Genomic Characterization of Hepatocellular Carcinoma. Cell 169, 1327–1341 e1323 (2017). - PMC - PubMed

Publication types