. 2023 Apr;4(4):468-484.
doi: 10.1038/s43018-023-00525-y. Epub 2023 Mar 13.

Age-associated microenvironmental changes highlight the role of PDGF-C in ER+ breast cancer metastatic relapse

Affiliations

Age-associated microenvironmental changes highlight the role of PDGF-C in ER+ breast cancer metastatic relapse

Frances K Turrell et al. Nat Cancer. 2023 Apr.

Abstract

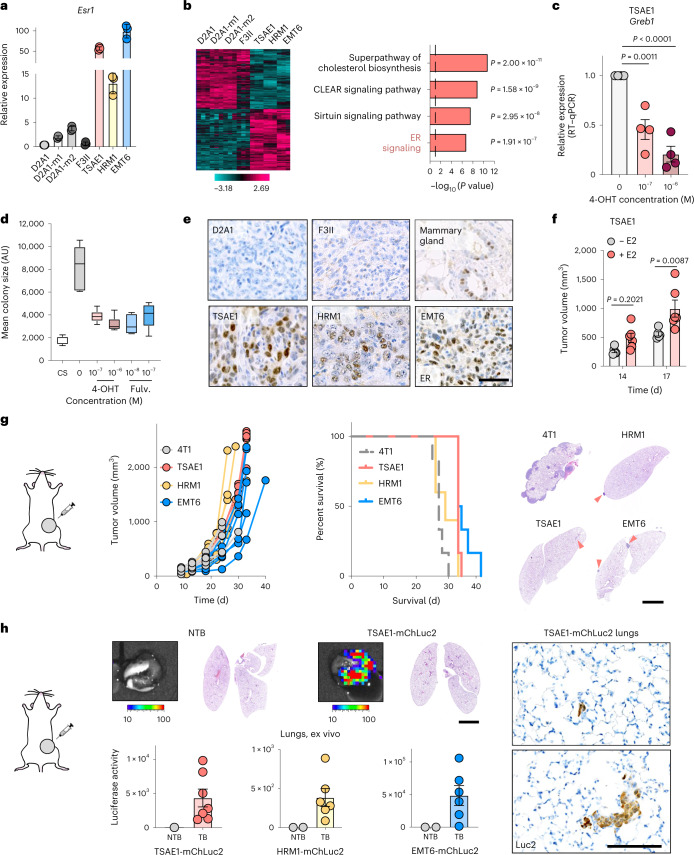
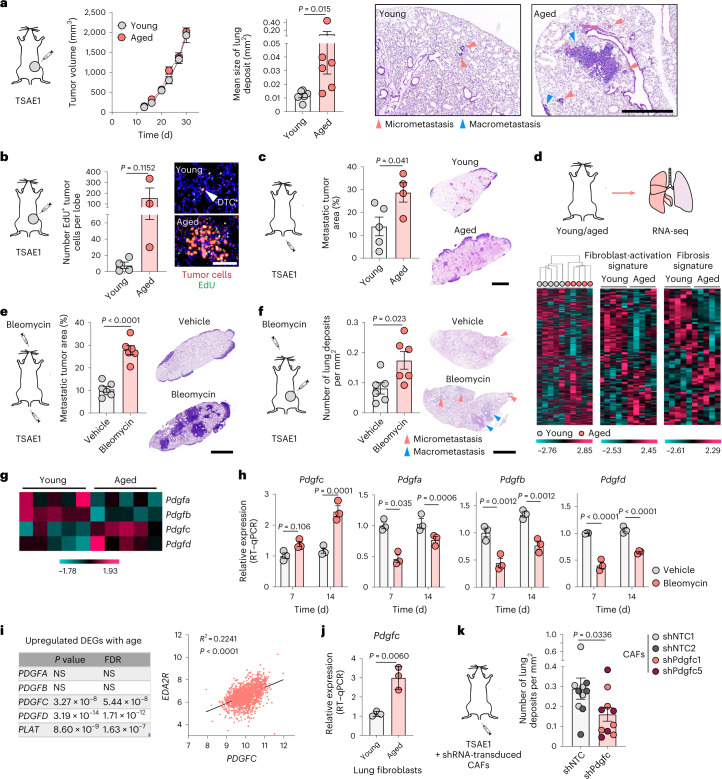
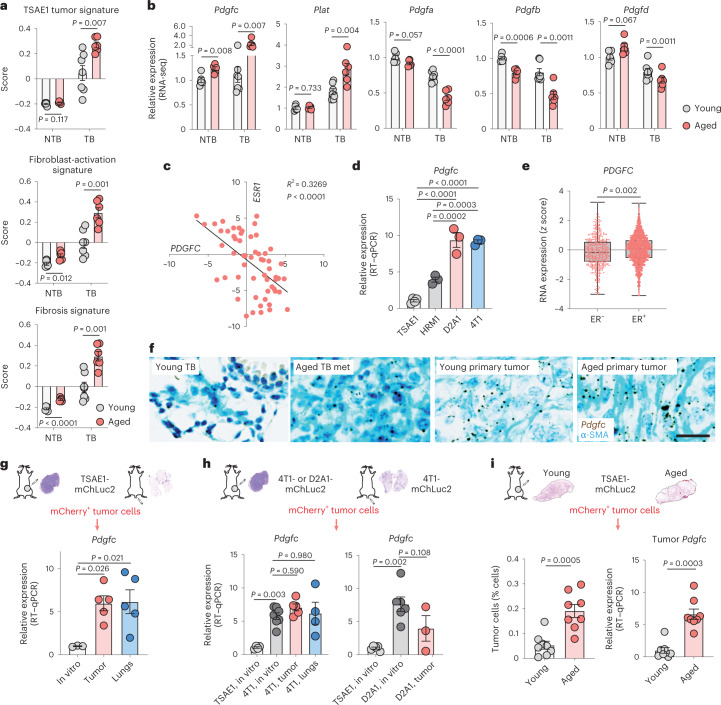
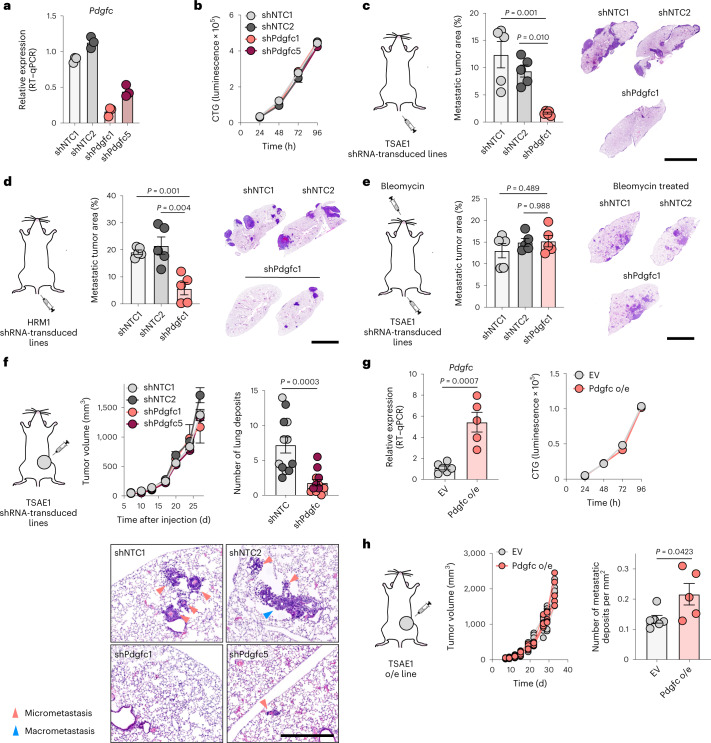
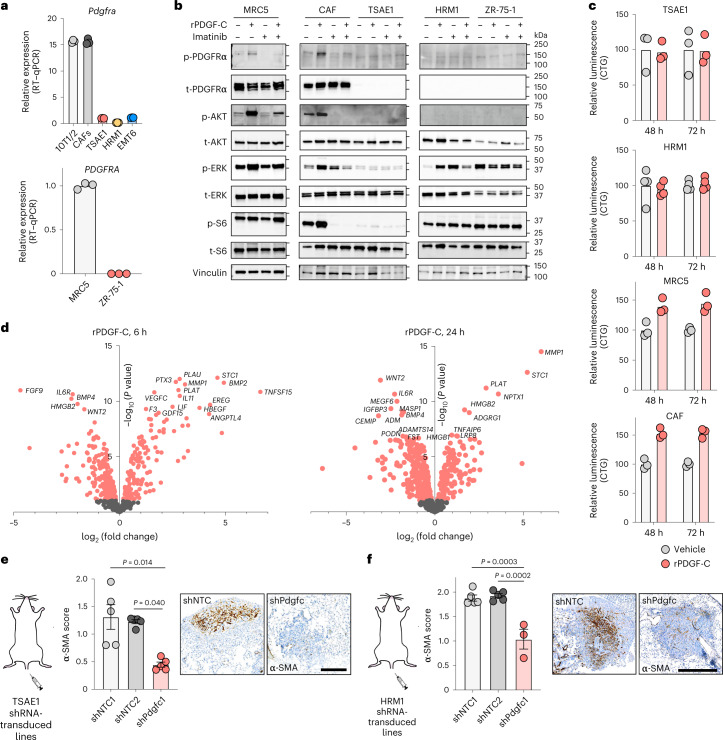
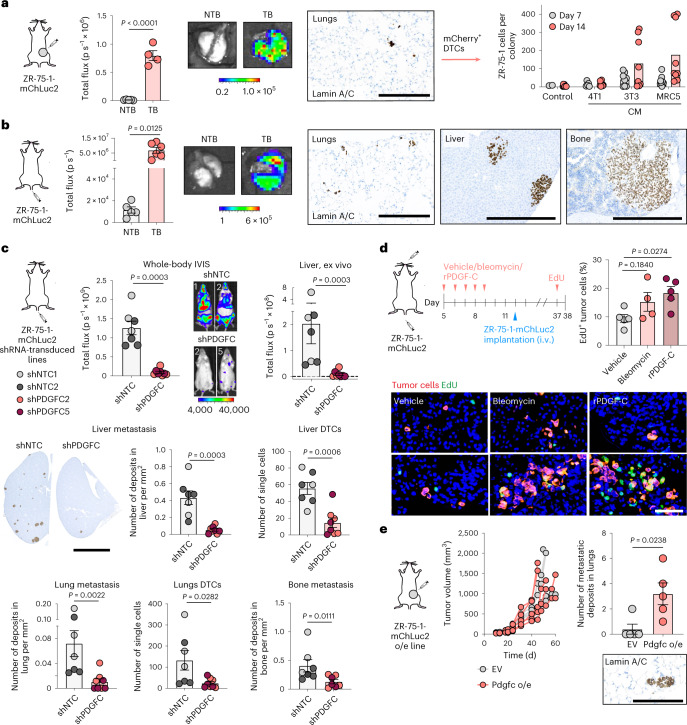
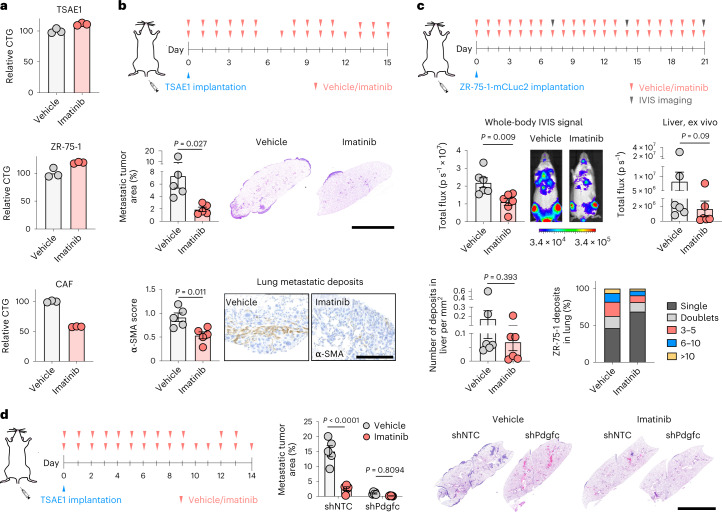
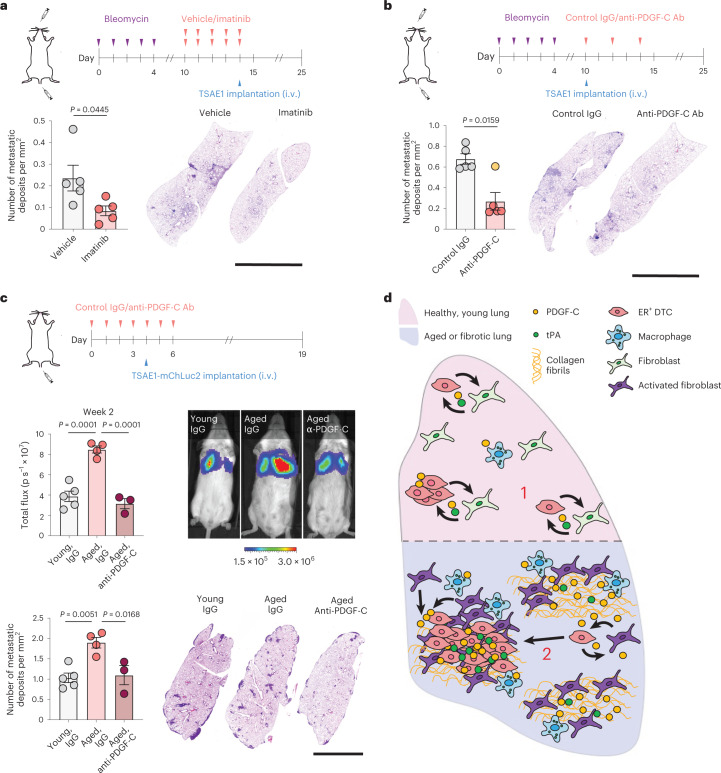
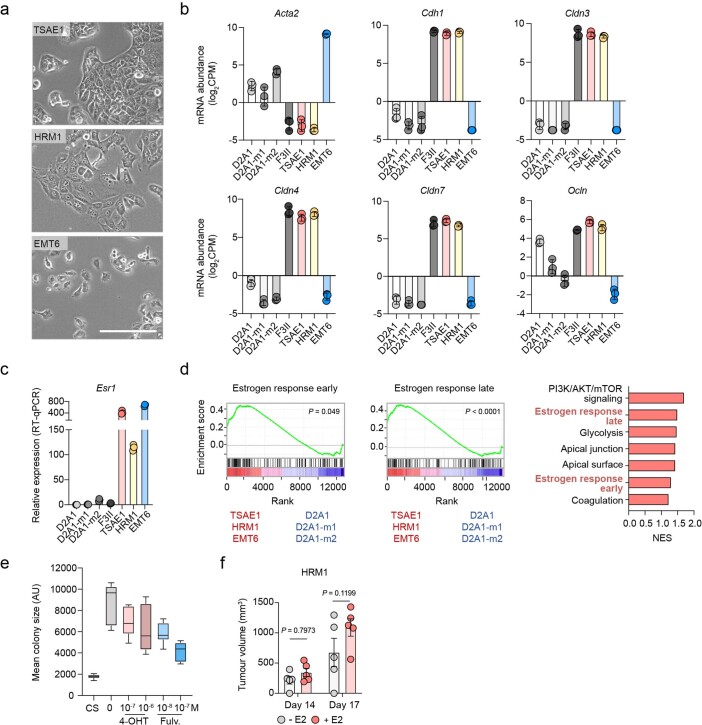
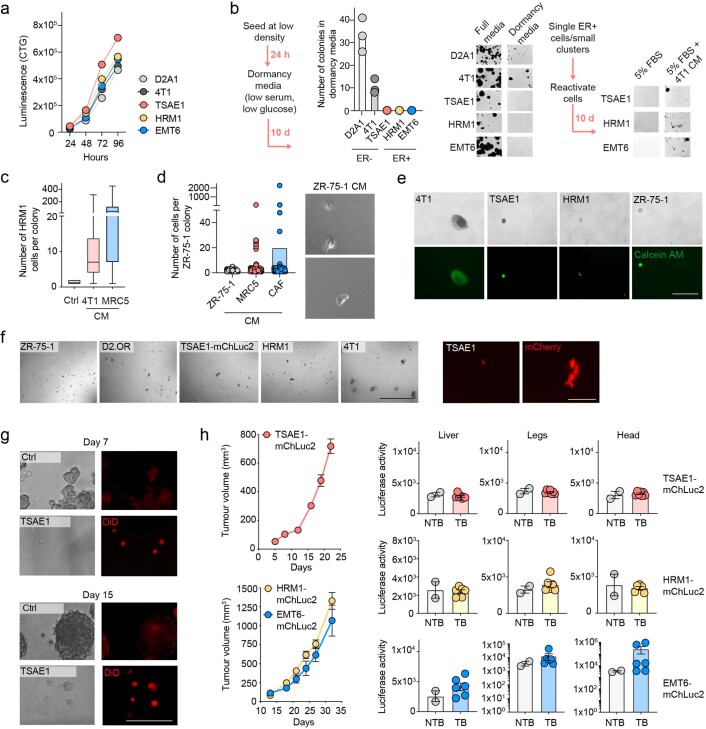
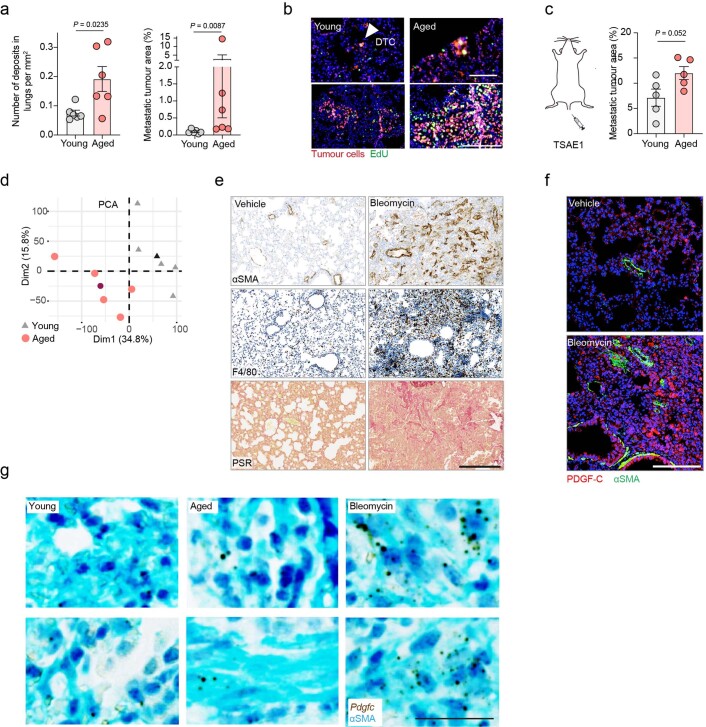
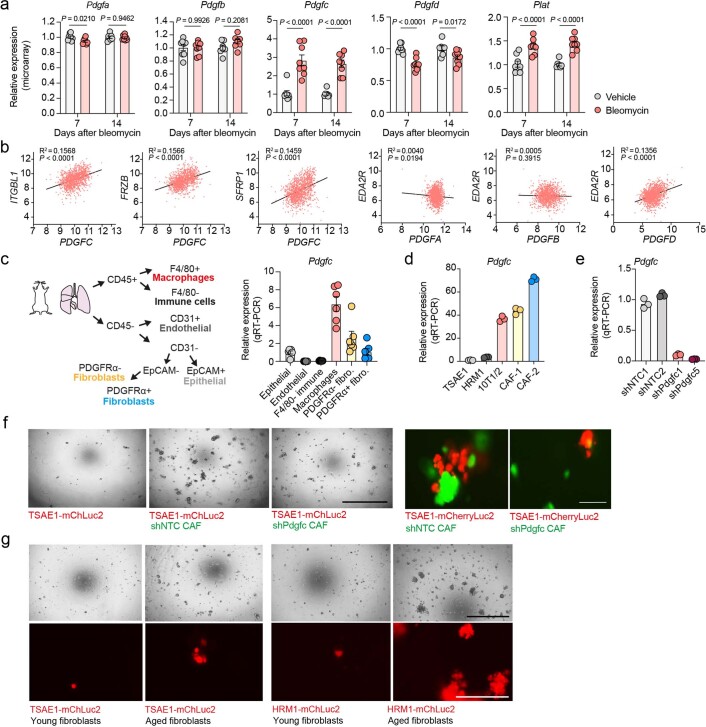
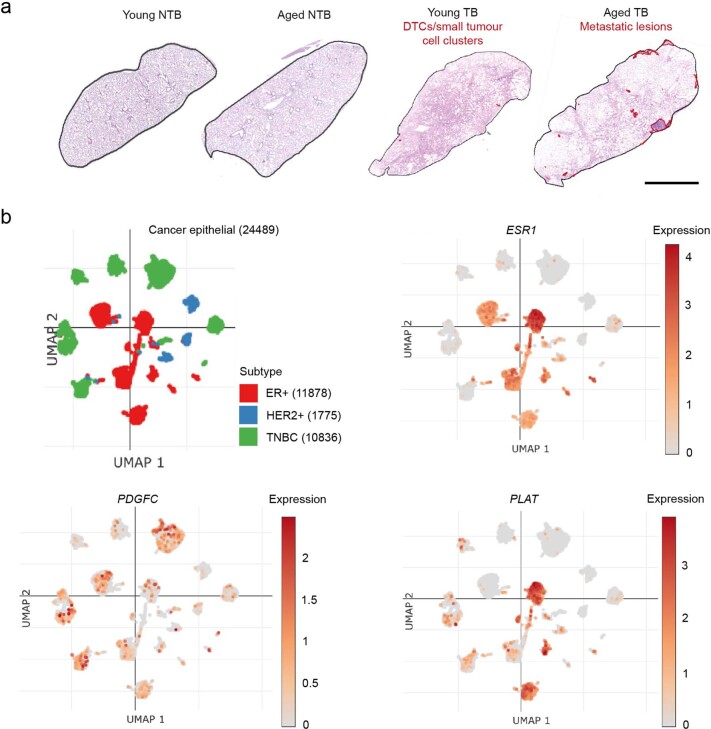
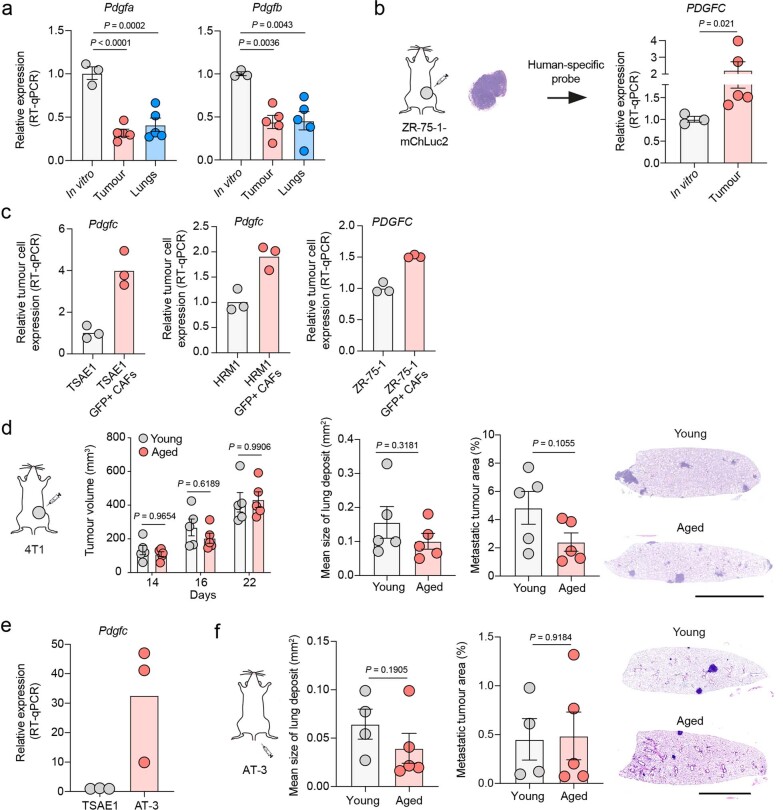
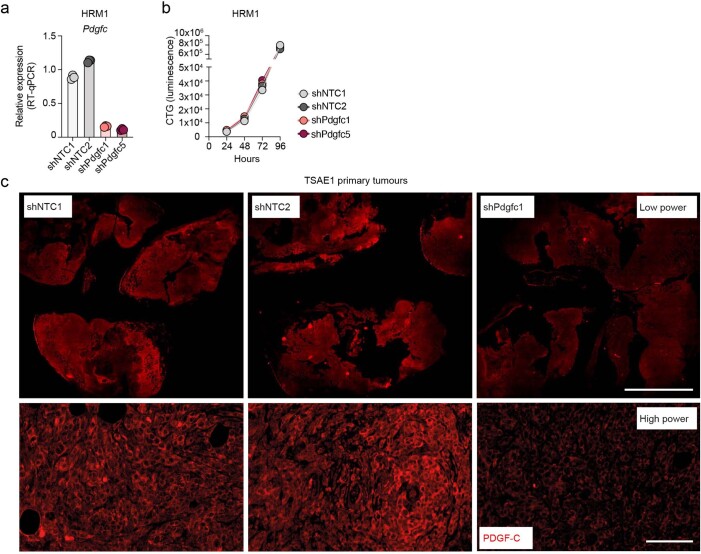
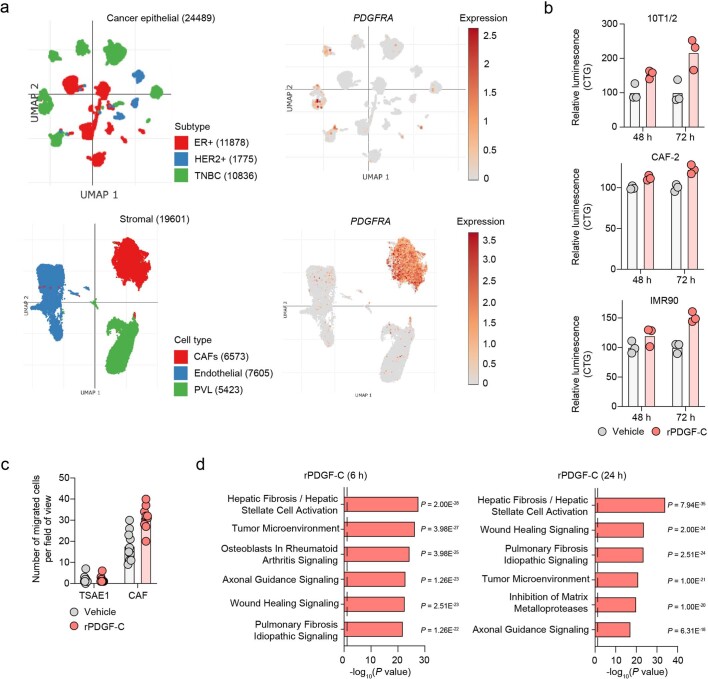
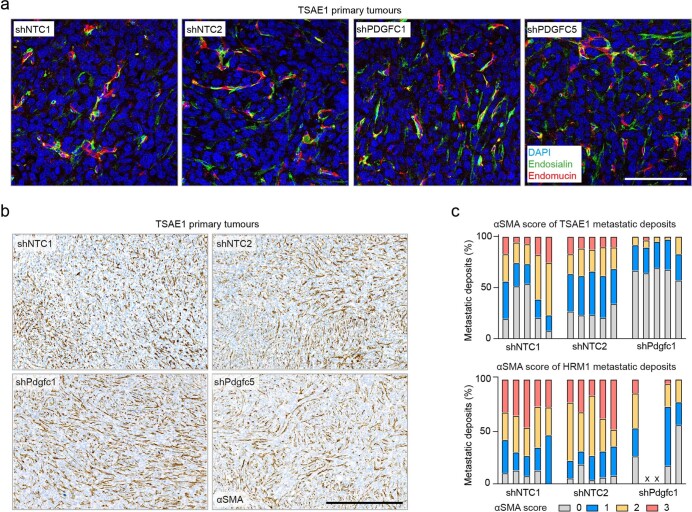
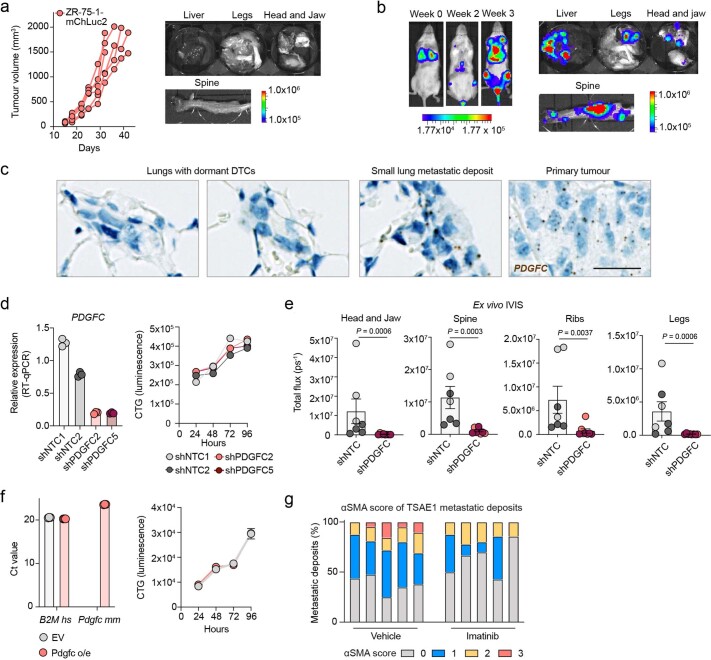
Patients with estrogen receptor (ER)-positive breast cancer are at risk of metastatic relapse for decades after primary tumor resection and treatment, a consequence of dormant disseminated tumor cells (DTCs) reawakening at secondary sites. Here we use syngeneic ER+ mouse models in which DTCs display a dormant phenotype in young mice but accelerated metastatic outgrowth in an aged or fibrotic microenvironment. In young mice, low-level Pdgfc expression by ER+ DTCs is required for their maintenance in secondary sites but is insufficient to support development of macrometastases. By contrast, the platelet-derived growth factor (PDGF)-Chi environment of aging or fibrotic lungs promotes DTC proliferation and upregulates tumor cell Pdgfc expression stimulating further stromal activation, events that can be blocked by pharmacological inhibition of PDGFRα or with a PDGF-C-blocking antibody. These results highlight the role of the changing microenvironment in regulating DTC outgrowth and the opportunity to target PDGF-C signaling to limit metastatic relapse in ER+ breast cancer.


Conflict of interest statement

The authors declare no competing interests.

Figures

Fig. 1
Fig. 1. Mouse models of ER+ breast cancer metastatic relapse.
a,b, RNA-seq analysis of mouse mammary tumor cell lines. a, Esr1 expression. b, Left, heatmap showing significantly differentially expressed genes (|log2 (fold change)| > 0.585, P value < 0.05) between ER (F3II, D2A1, D2A1-m1, D2A1-m2) and ER+ (TSAE1, HRM1, EMT6) lines. Right, Ingenuity Pathway Analysis showing the top four significantly (P < 0.05, right-tailed Fisher’s exact test) upregulated pathways (ER+ versus ER lines). Dashed line, P value cutoff. CLEAR, coordinated lysosomal expression and regulation. c, Greb1 expression in TSAE1 cells treated with vehicle or 4-OHT for 24 h (n = 4 biological repeats). d, Mean TSAE1 colony size per well (n = 6 wells per condition) in Matrigel following treatment with vehicle, 4-OHT or fulvestrant (fulv.) for 7 d in phenol red-free DMEM or medium with charcoal-stripped (CS) fetal bovine serum (FBS). Representative of four independent repeats. AU, arbitrary units. e, Primary tumors in BALB/c (TSAE1, EMT6, F3II, D2A1) or FVB (HRM1) mice stained for ER-α (scale bar, 50 µm). f, TSAE1 cells injected orthotopically (BALB/c) without (n = 5 mice) or with (n = 6 mice) estradiol (E2) pellets. g, Tumor cells injected orthotopically (TSAE1, EMT6, 4T1, n = 6 BALB/c mice per group; HRM1, n = 5 FVB mice). Left, tumor growth. Middle, survival analysis. All mice with TSAE1, HRM1 or EMT6 tumors were culled due to primary tumor size limit (solid lines); all mice with 4T1 tumors were culled due to symptoms of metastatic disease (dashed line). Right, hematoxylin and eosin (H&E)-stained lung sections (scale bar, 2.5 mm), with arrowheads indicating small metastatic deposits. h, mChLuc2-tagged tumor cells injected orthotopically (TSAE1, n = 7 and EMT6, n = 6 BALB/c mice; HRM1, n = 6 FVB mice). Mice were culled on day 33 (HRM1-mChLuc2 and EMT6-mChLuc2) or day 27 (TSAE1-mChLuc2). Top, representative lung ex vivo IVIS images (scale bar, counts) and H&E-stained lung sections (scale bar, 2.5 mm). Bottom, ex vivo IVIS quantification (total counts). Right, representative images for luciferase-stained TSAE1-mChLuc2 TB lungs (scale bar, 125 µm). a,c,f,h, Data are presented as mean values ±s.d. (a) or ±s.e.m. (c,f,h); one-way ANOVA with multiple comparisons (c), a box plot showing 25th and 75th percentiles, the median (line) and minimum and maximum values (whiskers) (d) or two-way ANOVA with multiple comparisons (f). Source data
Fig. 2
Fig. 2. An aged microenvironment supports ER+ DTC metastatic outgrowth.
All experiments used TSAE1 cells inoculated into BALB/c mice. a, Orthotopic inoculation into young or aged (15-month-old) mice (n = 6 mice per group). Left, tumor growth. Right, quantification of lung metastatic burden (day 30) and representative images (scale bar, 1 mm). Additional quantification is shown in Extended Data Fig. 3a. b, Orthotopic inoculation into n = 4 young or n = 3 aged (>12-month-old) mice. EdU was injected 24 h before culling (day 33), and EdU+ tumor cells in formalin-fixed paraffin-embedded (FFPE) tissue sections were quantified; representative images are shown (scale bar, 100 μm). Additional images are shown in Extended Data Fig. 3b. c, Intravenous inoculation into n = 5 young and n = 4 aged (9-month-old) mice. Metastatic lung burden (day 15), images (scale bar, 2.5 mm). d, RNA-seq profiling of NTB lungs from young (12-week-old) and aged (13-month-old) mice (n = 5 mice per group). Left, hierarchical clustering. Right, expression of ‘fibroblast-activation signature’ and ‘fibrosis signature’ genes. e, Intravenous inoculation into young mice 3 d after vehicle or bleomycin treatment (n = 6 mice per group). Metastatic lung burden (15 d after inoculation), representative images (scale, 2.5 mm). f, Orthotopic inoculation into young mice (day 1), treated with vehicle or bleomycin starting at day 10 (n = 6 mice per group). Metastatic lung burden (day 32), representative images (scale, 2.5 mm). g, Expression in NTB lungs of young and aged mice (RNA-seq). h, NTB mice treated with vehicle or bleomycin and culled 7 or 14 d later (n = 3 mice per group; RT–qPCR). i, Correlation analysis of PDGFC and EDA2R expression in human non-cancerous lung samples (n = 1,197 patients; GSE23546). DEG, differentially expressed gene; FDR, false discovery rate. j, Pdgfc expression (RT–qPCR) in primary fibroblasts (three independent repeats). k, Intravenous inoculation into young mice. On days 3 and 8, mice were injected intravenously with shNTC- or shPdgfc mouse GFP+ CAFs (n = 5 mice per group). Metastatic lung burden (day 10; shNTC and shPdgfc, n = 10 mice per group). ac,e,f,h,j,k, Data are presented as mean values ± s.e.m.; two-tailed Mann–Whitney U-test (a,k), two-tailed t-test (b,c,e,f,j), two-tailed Pearson’s correlation (i) or two-way ANOVA with multiple comparisons (h). Source data
Fig. 3
Fig. 3. ER+ tumor cells contribute to elevated PDGF-C in the metastatic microenvironment.
a,b, RNA-seq profiling of lungs from young or aged (13-month-old) BALB/c mice (n = 7 or n = 6 mice, respectively) inoculated orthotopically with TSAE1 cells (TB; day 29). NTB mice are from Fig. 2d. See Extended Data Fig. 5a for histology. a, Scores for TSAE1 tumor signature, fibroblast-activation signature and fibrosis signature (Methods). b, PdgfaPdgfd and Plat expression. c, Correlation analysis of ESR1 and PDGFC expression in human breast cancer cell lines (Cancer Cell Line Encyclopedia (CCLE)). d, Pdgfc expression (RT–qPCR) in mouse tumor lines in vitro (three independent repeats; TSAE1, four). e, PDGFC expression in human breast cancers (METABRIC dataset; ER, n = 445 patients; ER+, n = 1,459 patients). f, Pdgfc RNAscope analysis of mouse tissue from a,b; counterstained for α-SMA (cyan). Representative images of TB young mouse lungs, metastatic deposits (met) in TB aged lungs and primary tumors (scale bar, 25 µm). gi, mChLuc2-tagged tumor cells were isolated by flow cytometry from primary (orthotopic inoculation) and metastatic (intravenous inoculation) tumors in young mice. g, Pdgfc expression in TSAE1-mChLuc2 cells (day 16, orthotopic; day 15, intravenous; n = 5 mice per group) compared to cells in vitro (n = 3 biological repeats). h, Left, Pdgfc expression in 4T1-mChLuc2 cells from primary tumors (day 14, n = 5 mice), or lung metastases (day 10, n = 4 mice), compared to in vitro cultures (TSAE1, n = 4; 4T1, n = 7 biological repeats). Right, Pdgfc expression in D2A1-mChLuc2 cells from primary tumors (days 20–25, n = 3 mice) compared to in vitro cultures (TSAE1, n = 5; D2A1, n = 6 biological repeats). i, TSAE1-mChLuc2 cells inoculated orthotopically into young or aged (10–13-month-old) mice. mCherry+ tumor cells were isolated from the lungs (days 31–35; n = 8 mice per group). Left, tumor cell quantification. Right, Pdgfc expression in isolated tumor cells. a,b,d,gi, Data are presented as mean values ± s.e.m.; multiple t-tests (a,b), Pearson’s correlation (two tailed) (c), one-way ANOVA with multiple comparisons (d,g,h), a box plot showing 25th and 75th percentiles, the median (line) and minimum and maximum values (whiskers) (e), two-tailed t-test (e,i, left) or two-tailed Mann–Whitney U-test (i, right). Source data
Fig. 4
Fig. 4. Tumor cell-derived PDGF-C in ER+ metastatic outgrowth.
a, Pdgfc expression (RT–qPCR) in TSAE1 cells transduced with shNTC1, shNTC2, shPdgfc1 or shPdgfc5. Representative of five independent repeats. b, In vitro proliferation of TSAE1 cells transduced with shNTC or shPdgfc. Representative of two independent repeats. c, TSAE1 cells transduced with shNTC or shPdgfc were injected intravenously into young BALB/c mice (n = 5 mice per group). Metastatic lung burden (day 14), with representative H&E-stained sections (scale bar, 5 mm). d, HRM1 cells transduced with shNTC or shPdgfc (Extended Data Fig. 7a,b) were injected intravenously into young FVB mice (n = 5 mice per group). Metastatic lung burden (day 30). Two mice with shPdgfc tumors had no metastatic deposits. Representative H&E-stained sections (scale bar, 5 mm). e, TSAE1 cells transduced with shNTC or shPdgfc were injected intravenously into bleomycin-treated young BALB/c mice (n = 5 mice per group) as described in Fig. 2e. Metastatic lung burden (day 11 after TSAE1 inoculation), with representative H&E-stained sections (scale bar, 5 mm). f, TSAE1 cells transduced with shNTC or shPdgfc were injected orthotopically into young BALB/c mice (n = 6 mice per group). Left, tumor growth. Right, quantification of lung metastatic deposits (day 28; shNTC and shPdgfc, n = 12 mice per group). Bottom, representative H&E-stained sections (scale bar, 500 µm). See Extended Data Fig. 9a,b for primary tumor immunostaining. g, TSAE1 cells carrying control vector (EV) or expressing Pdgfc (Pdgfc o/e). Left, Pdgfc expression (RT–qPCR) in TSAE1 tumors (EV, n = 6 mice; Pdgfc overexpression, n = 5 mice). Right, in vitro proliferation. Representative of two independent repeats. h, Young BALB/c mice were injected orthotopically with TSAE1 cells carrying EV (n = 6 mice) or overexpressing (o/e) Pdgfc (n = 5 mice). Mice were culled on days 30–35. Left, tumor growth for individual mice. Right, quantification of lung metastatic deposits. Data are presented as mean values ± s.e.m. (ch); one-way ANOVA with multiple comparisons (ce) or two-tailed t-test (fh). Source data
Fig. 5
Fig. 5. PDGF-C signals through PDGFRα to activate fibroblasts.
a, Pdgfra and PDGFRA expression (RT–qPCR) in mouse (top) and human (bottom) fibroblasts (gray) and tumor cell lines (colored). Representative data of two independent repeats, multiple cell lines. b, Western blot analysis of fibroblasts and ER+ tumor cells following treatment with vehicle, rPDGF-C (100 ng ml−1) and/or imatinib (1 µM). Representative data of two independent repeats, multiple cell lines. p, phosphorylated; t, total. c, CellTiter-Glo (CTG) analysis of fibroblasts and ER+ tumor cells treated with vehicle or rPDGF-C (100 ng ml−1). Representative data from two (HRM1), three (TSAE1, CAF) and six (MRC5) independent repeats per cell line. d, RNA-seq analysis of MRC5 fibroblasts treated with vehicle or rPDGF-C for 6 h (left) or 24 h (right). Genes differentially expressed following treatment (two-tailed t-test, P < 0.01) are highlighted in red with the top 20 significantly altered genes labeled. e,f, Lungs from BALB/c mice were injected intravenously with TSAE1 tumor cells (from Fig. 4c), or FVB mice were injected intravenously with HRM1 tumor cells (from Fig. 4d), respectively, and stained for α-SMA. Metastatic deposits were scored for the number of α-SMA+ cells (Extended Data Fig. 9c). Representative images (scale bar, 500 µm). Note that two HRM1-shPdgfc mice had no detectable lung deposits (Fig. 4d). Data are presented as mean values; ±s.e.m., Kruskal–Wallis test with multiple comparisons (e,f). Source data
Fig. 6
Fig. 6. Tumor-derived PDGF-C is required for metastatic outgrowth.
All experiments involved ZR-75-1-mChLuc2 cells inoculated into young NSG mice. a, Orthotopic inoculation (TB), with NTB controls (n = 5 mice per group). Left, ex vivo IVIS imaging of lungs (days 34–43; n = 4 TB mice as one mouse was used for tumor cell isolation; scale bar, radiance, p s−1 cm−2 sr−1). Right, TB lungs stained for human lamin A/C (scale bar, 250 µm). Tumor cells sorted from lungs (n = 1 TB mouse) were treated with control medium or 4T1 or fibroblast (MRC5 or 3T3) CM. Number of cells per colony (days 7 and 14). b, Intravenous inoculation (TB; n = 6 mice). Left, ex vivo IVIS imaging of lungs (day 29; scale bar, radiance, p s−1 cm−2 sr−1). NTB control mice were from a. Right, human lamin A/C staining of lungs, liver and hind leg bones (scale bars; lungs, 250 µm; liver and bones, 500 µm). c, Cells transduced with shNTC1, shNTC2, shPDGFC2 or shPDGFC5 were injected intravenously (shNTCs and shPDGFCs; n = 7 or 8 mice per group, respectively). Top left, whole-body IVIS signal (day 28; scale bar, counts). Top right, ex vivo IVIS signal in livers (day 29). Bottom left, quantification of metastatic deposits and DTCs with representative human lamin A/C-stained liver sections (scale bar, 5 mm). Only three shPDGFC5 hind leg bone samples were available. d, Mice were treated daily for 5 d with vehicle, bleomycin or rPDGF-C. On day 12, ZR-75-1-mChLuc2 cells were inoculated intravenously (i.v.) (n = 5 vehicle- or rPDGF-C-treated mice; n = 4 bleomycin-treated mice). Mice were injected with EdU (day 37) and culled 24 h later. Percentage of EdU+ human (lamin A/C+) tumor cells, representative images (scale bar, 50 µm). e, Cells carrying EV or overexpressing (o/e) Pdgfc cells were injected orthotopically (n = 5 mice per group). Mice were culled on days 45–60. Left, tumor growth for individual mice. Right, quantification of lung metastatic deposits, with representative human lamin A/C staining (scale bar, 125 µm). Data are presented as mean values; ±s.e.m. (a, left; be, right); two-tailed t-test (ac, middle right), one-way ANOVA with multiple comparisons (d) or two-tailed Mann–Whitney U-test (c, top, middle left, bottom; e). Source data
Fig. 7
Fig. 7. Pharmacological inhibition of PDGFRα with imatinib limits metastatic outgrowth of ER+ DTCs.
a, CellTiter-Glo analysis of ER+ tumor cells and fibroblasts after 72 h of vehicle or imatinib (1 µM) treatment (representative data of two independent repeats, multiple cell lines). b, TSAE1 cells were injected intravenously into young BALB/c mice, with mice receiving vehicle or imatinib as indicated (n = 5 mice per group). Middle, lung metastatic burden (day 15), with representative lung sections (scale bar, 5 mm). Bottom, lungs were stained for α-SMA, and metastatic deposits were scored for the number of α-SMA-positive cells (Extended Data Fig. 10g), with representative images (scale bar, 500 µm). c, ZR-75-1-mChLuc2 cells were injected intravenously into young NSG mice, with mice receiving vehicle or imatinib treatment as indicated (n = 6 mice per group). Middle left, whole-body IVIS signal on day 14. IVIS signal quantification, with representative images (scale bar shows radiance, p s−1 cm−2 sr−1). Middle right, quantification of ex vivo IVIS signal in livers (day 21). Bottom left, number of liver metastatic deposits. Bottom right, percentage of tumor deposits in the lungs that are single cells, doublets, 3–5 tumor cells, 6–10 tumor cells or >10 tumor cells. d, TSAE1 tumor cells transduced with shNTC1 or shPdgfc1 were inoculated intravenously into young BALB/c mice, which were treated with vehicle or imatinib as indicated (n = 5 mice per group). Metastatic lung burden (day 14), with representative lung sections shown (scale bar, 5 mm). Data are presented as mean values; ±s.e.m. (bd); two-tailed t-test (b,c (top left)), two-tailed Mann–Whitney U-test (c, top right and bottom) or two-way ANOVA with multiple comparisons (d). Source data
Fig. 8
Fig. 8. Inhibition of PDGF-C signaling in the aged or fibrotic microenvironment limits metastatic outgrowth of ER+ tumor cells.
a,b, Young mice were pretreated with bleomycin and then received either vehicle or imatinib (a) or immunoglobulin (Ig)G control or anti-PDGF-C antibody (Ab) (b), as indicated (n = 5 mice per group). Mice were injected intravenously with TSAE1 cells on day 14 (a) or day 10 (b), and experiments ended on day 25. The number of lung metastatic deposits was quantified, with representative lung sections shown (scale bar, 5 mm). For b, an outlier was identified (yellow circle) using the outlier analysis in GraphPad Prism (ROUT method, q = 1%). The P value shown excludes the outlier (P = 0.0556 with the outlier included). c, Aged (>12-month-old) BALB/c mice were treated with control IgG (n = 4 mice) or PDGF-C-blocking antibody (n = 3 mice) as indicated. Young mice (n = 5 mice) were treated with control antibody. Middle, IVIS signal at week 2 after tumor cell injection, with representative whole-body IVIS images (scale bar, radiance, p s−1 cm−2 sr−1). Bottom, number of lung metastatic deposits, with representative lung sections (scale bar, 5 mm). d, Proposed model for PDGF-C in ER+ breast cancer metastatic relapse. (1) Single ER+ DTCs have low-level PDGFC expression, which aids DTC survival but is insufficient for the generation of a metastasis-permissive niche. (2) An activated PDGF-Chi stroma in aged or fibrotic lungs supports proliferation of PDGF-CloER+ DTCs, with levels of PDGF-C (tumor and stroma derived) and its activator tPA elevated in the growing lesions, further activating fibroblasts and supporting the development of macrometastatic lesions. Data are presented as mean values ± s.e.m.; two-tailed t-test (a), two-tailed Mann–Whitney U-test (b) or one-way ANOVA with multiple comparisons (c). Source data
Extended Data Fig. 1
Extended Data Fig. 1. Characterisation of ER+ mouse mammary tumour cell lines.
a, Phase contrast images of TSAE1, HRM1 and EMT6 cells in 2D culture (scale bar, 200 µm). b, Expression of Acta2, Cdh1 and claudin genes in mouse mammary tumour lines from Fig. 1b. RNA-seq analysis (log2CPM). c, Esr1 expression (RT-qPCR) in mouse mammary tumour cell lines with normalisation performed using average expression of four house-keeping genes (B2m, Ipo8, 18s and Ubc). Representative data of four independent repeats. d, Associated with Fig. 1b. Left, GSEA enrichment plots for ‘Estrogen response early’ and ‘Estrogen response late’ genes comparing ER+ (TSAE1, HRM1, EMT6) lines (red) to ER- (D2A1, D2A1-m1, D2A1-m2) lines (blue). Right, GSEA pathways significantly (P < 0.05) upregulated in ER+ compared with ER- cell lines. NES, normalised enrichment score. e, Associated with Fig. 1d. Mean HRM1 colony size per well (n = 6 wells per condition) in Matrigel following treatment with vehicle, 4-OHT or fulvestrant (fulv.) for 7 days in phenol red-free media or in media with charcoal-stripped (CS) FBS. Representative data of two independent repeats. f, Associated with Fig. 1f. HRM1 cells were injected orthotopically into untreated FVB mice or mice implanted with slow release E2 pellets (n = 5 mice per group). b,c,f, Data are presented as mean values; b, ±SD; f, ±SEM, two-way ANOVA; e, box plot shows 25th/75th percentiles, median (line) and minimum/maximum values (whiskers). Source data
Extended Data Fig. 2
Extended Data Fig. 2. ER+ tumour cells exhibit dormant phenotypes.
a, CellTiter-Glo (CTG) analysis of D2A1, 4T1, TSAE1, HRM1 and EMT6 cells. b, 100 tumour cells per well were seeded in 6-well plates and the following day changed into dormancy media for 10 days. Left, colonies per well (crystal violet staining), with representative images. Right, media was changed to 5% FBS or 4T1 conditioned media (CM) + 5% FBS for a further 10 days for tumour cell reactivation, representative images shown. c, Quantification of HRM1 tumour cells per colony following 10 days culture in Ctrl (5% FBS) or 4T1/MRC5 CM with 5% FBS (n = 10, 51, 35 colonies, respectively). d, 1,000 ZR-75-1 cells per well were seeded in 6-well plates and the following day changed into dormancy media. 7 days later CM was added as indicated for a further 10 days. Quantification of the number of ZR-75-1 cells per colony following reactivation, with representative phase contrast images of dormant ZR-75-1 cells in ZR-75-1 CM shown (scale bar, 200 µm). e, 5,000 cells were seeded in a soft agar-coated 6-well plates. Colonies were stained with Calcein AM 6 weeks after seeding. Representative images (scale bar, 200 µm). f, Representative images of tumour cells in BME dormancy assays 9 days after seeding. Scale bars; 500 µm (phase contrast), 100 µm (fluorescence). g, Representative images of DiD-labelled TSAE1 cells in BME dormancy assays 7 and 15 days after seeding. Ctrl, a proliferating control (higher numbers of tumour cells seeded). Scale bar, 200 µm. h, Additional data associated with Fig. 1h. Left, HRM1-mChLuc2, EMT6-mChLuc2 and TSAE1-mChLuc2 primary tumour growth. Right, ex vivo IVIS quantification of metastatic spread (total counts) to liver, hind legs and head. NTB, non-tumour bearing control mice; TB, tumour bearing. The same NTB mice were used for HRM1-mChLuc2 and EMT6-mChLuc2. Representative data of three (a,b,f) or two (c,d,g) independent repeats, with multiple cell lines. Data are presented as mean values; h, ±SEM; c, box plot shows 25th/75th percentiles, median (line) and minimum/maximum values (whiskers). Source data
Extended Data Fig. 3
Extended Data Fig. 3. PDGF-C levels are upregulated in aged and fibrotic lungs.
a, Additional quantification for Fig. 2a. Left, number of metastatic deposits in the lungs.. Right, percentage metastatic tumour area in the lungs. b, Additional images of the experiment presented in Fig. 2b illustrating EdU+ tumour cells in young and aged mouse lungs. Tumour cells were identified by staining with an antibody against HMGA2. White arrowhead points to single dormant tumour cell (scale bars; 100 µm, upper images; 250 µm, lower images). c, Independent repeat of the experiment presented in Fig. 2c. TSAE1 tumour cells were injected intravenously into the tail vein of young (n = 5 mice) or aged (14-month, n = 5 mice) BALB/c mice. Percentage metastatic tumour burden in the lungs (day 15). d, Associated with Fig. 2d. Principal component analysis (PCA) of young (grey triangles) and aged (light red circles) NTB mouse lungs (RNA-seq data). Average values per group are shown with black and dark red shapes for young and aged lungs, respectively. e,f, BALB/c mice were treated with vehicle or bleomycin (see Methods for schedule) and culled 7 or 14 days after treatment ended (n = 3 mice per group). e, Representative images of αSMA and F4/80 (7 days post-treatment) and picrosirius red (PSR) (14 days post-treatment) staining in lungs (scale bar, 250 µm). f, Representative images of αSMA (green), PDGF-C (red) and DAPI (blue) staining in lungs of mice culled 14 days after treatment ended (scale bar, 150 µm). g, RNAscope analysis of Pdgfc expression in young (12-week), aged (13-month) or fibrotic (bleomycin-treated) lungs (from experiments shown in Fig. 2d,h). Lung sections were counterstained for αSMA (cyan). Scale bar, 25 µm. a,c, Data are presented as mean values ±SEM; a (left),c, two-tailed t-test; a (right), two-tailed Mann-Whitney U-test. Source data
Extended Data Fig. 4
Extended Data Fig. 4. Pdgfc/PDGFC expression in the aged microenvironment and its role in release from dormancy.
a, Transcriptional profiling of C57BL/6 mouse lungs treated with vehicle or bleomycin (from GSE40151). Analysis of Pdgfa-d and Plat expression in lungs 7 and 14 days post-treatment, n = 8 mice per group except n = 7 mice for vehicle 14 days. b, Associated with Fig. 2i. Transcriptional profiling of human non-cancerous lung tissues (GSE23546). Correlation of PDGF expression and expression of the age-associated genes EDA2R, ITGBL1, FRZB and SFRP1, in lung samples from patients aged 4 − 85 years of age (n = 1197 patients). c, Expression of Pdgfc in the aged (18-month) C57BL/6 mouse lung (n = 6 mice, 4 females and 2 males). Lung tissue was dissociated and FACSorted for the following populations: macrophages (CD45+ F4/80+), other immune cells (CD45+ F4/80-), endothelial (CD45- CD31+), epithelial (CD45-, CD31-, EpCAM+) and PDGFRα- (cells negative for all markers) and PDGFRα+ fibroblasts. d, Pdgfc expression in GFP+ mouse CAFs compared to 10T1/2 fibroblasts and ER+ mouse tumour cells (RT-qPCR). e, GFP+ mouse CAFs were transduced with two non-targeting control shRNAs (shNTC1, shNTC2) or two independent shRNAs targeting Pdgfc (shPdgfc1, shPdgfc5). RT-qPCR to assess Pdgfc expression. f, TSAE1-mChLuc2 cells were cultured in BME assays (see Extended Data Fig. 2f) for 9 days with or without shNTC or shPdgfc CAFs and then imaged on an EVOS microscope; tumour cells (mCherry+) and CAFs (GFP+). Scale bar, 1 mm (phase-contrast images) and 100 µm (fluorescent images). g, TSAE1-mChLuc2 or HRM1-mChLuc2 cells were cultured in BME assays for 9 days (see Extended Data Fig. 2f) with or without immortalised young or aged mouse lung fibroblasts. Cells were imaged on an EVOS microscope: tumour cells (mCherry+). Scale bar, 1 mm (phase-contrast images) and 200 µm (fluorescent images). a,c-e, Data are presented as mean values; a,c, ±SEM; a, two-way ANOVA; b, two-tailed Pearson’s correlation (line shows linear regression). f,g, Representative of two-independent repeats. g, Two independent young and old fibroblast populations were used with equivalent results. Source data
Extended Data Fig. 5
Extended Data Fig. 5. PDGFC expression in human breast cancer cells.
a, Associated with Fig. 3a,b. Young (12-week) or aged (13-month) BALB/c mice were either left as non-tumour bearing (NTB, n = 5 mice per group) or inoculated orthotopically with TSAE1 tumour cells (TB) and culled at day 29 (n = 7 young mice, n = 6 aged mice). Lungs were divided into the left lobe for histology and the right lobes for RNA-seq analysis. Representative H&E-stained sections of left lung lobes with metastatic deposits outlined in red (scale bar, 5 mm). b, Single-cell RNA-seq data from 26 human breast cancers (11 ER+, 5 HER2+ and 10 TNBC, triple-negative; number of cells sequenced shown in brackets), clustering of epithelial cancer cells based on subtype. Expression of ESR1, PDGFC and PLAT are shown. Plots were generated using the Broad Institute single-cell portal, https://singlecell.broadinstitute.org. Source data
Extended Data Fig. 6
Extended Data Fig. 6. ER- mouse mammary tumour cells show equivalent metastasis in young and aged mice.
a, Additional data associated with Fig. 3g. TSAE1-mChLuc2 cells were isolated from the primary tumours or metastatic lungs, and tumour cell Pdgfa and Pdgfb expression assessed (RT-qPCR) and compared to expression in in vitro cultured cells (n = 3 biological repeats). b, PDGFC expression in ZR-75-1-mChLuc2 cells in vitro (n = 3 biological repeats) or isolated from primary tumours following orthotopic inoculation into NSG mice. RT-qPCR using a human-specific probe (n = 5 mice). c, 575,000 GFP+ CAFs were seeded with 200,000 TSAE1 or HRM1 tumour cells or 575,000 ZR-75-1 cells in 6-cm dishes in DMEM (10% FBS) and cultured for 48 hours. For monocultures, 400,000 TSAE1 or HRM1 cells or 750,000 ZR-75-1 cells were seeded. Single cell suspensions were stained with DAPI to exclude dead cells. 100,000-200,000 GFP-negative tumour cells were sorted on a Sony SH800 cell sorter and collected for RNA extraction. RT-qPCR analysis of Pdgfc/PDGFC expression (as detailed in Methods). Representative data of two (ZR-75-1) or three (TSAE1 and HRM1) independent repeats, with two independent CAF populations. d, 4T1 cells were inoculated orthotopically into young (n = 5 mice) or aged (>12-month, n = 5 mice) BALB/c mice. Left, tumour volume. Right, quantification of spontaneous metastasis to the lung, with representative images shown (scale bar, 5 mm). e, Pdgfc expression (RT-qPCR) in ER- AT-3 cells culture in vitro compared to ER+ TSAE1 cells. f, AT-3 cells were inoculated intravenously into young (n = 4 mice) or aged (18-month, n = 5 mice) C57BL/6 mice. Quantification of lung metastasis. Data are presented as mean values; a,b,d,f, ±SEM; a, one-way ANOVA with multiple comparisons; b,f (left), two-tailed Mann-Whitney U-test; d (left), two-way ANOVA with multiple comparisons; d, (right),f (right), two-tailed t-test. Source data
Extended Data Fig. 7
Extended Data Fig. 7. Validation of Pdgfc downregulated expression in HRM1 cells and TSAE1 tumours.
a,b, Associated with Fig. 4d. Data are presented as mean values. a, Pdgfc expression (RT-qPCR) in HRM1 shNTC (1,2) and shPdgfc (1,5) cells. b, Proliferation of HRM1 shNTC (1,2) and shPdgfc (1,5) cells assessed by CellTiter-Glo (CTG). Representative data of two independent repeats. c, Immunostaining for PDGF-C in TSAE1 shNTC1, shNTC2 and shPdgfc1 primary tumours from Fig. 4f (representative images; scale bar, 5 mm and 250 µm for low- and high-power images, respectively). Source data
Extended Data Fig. 8
Extended Data Fig. 8. PDGF-C promotes fibroblast proliferation and migration but has no effect on tumour cells.
a, Single-cell RNA-seq data from 26 human breast cancers (11 ER+, 5 HER2+ and 10 TNBC, triple negative). Expression of PDGFRA is shown in cancer and stromal cells. Number of cells sequenced is indicated in brackets. PVL, perivascular-like. Plots were generated using the Broad Institute single-cell portal, https://singlecell.broadinstitute.org. b, Additional data associated with Fig. 5c. CellTiter-Glo analysis following vehicle or rPDGF-C treatment (100 ng mL-1) for mouse (upper, middle) and human (lower) fibroblasts. Representative data of two (10T1/2 and CAF-2) or three (IMR90) independent repeats, in multiple cell lines. c, Transwell migration assay. Following overnight culture in SFM, 5,000 cells were seeded into Transwell inserts (8.0 µm pore size, Corning 3422) in SFM. DMEM plus 2% FBS containing vehicle or rPDGF-C (100 ng mL-1) was added per well. Treatments were refreshed at 24 hours. After 48 hours, inserts were washed, fixed (4% paraformaldehyde) and stained with DAPI. Non-migrated cells were removed from the top of the insert with a cotton tip. 4-5 images were taken per insert. Data show number of migrated CAF and TSAE1 cells per field of view. Representative data of three independent repeats. d, Ingenuity pathway analysis showing the top 6 significantly (P < 0.05, right-tailed Fisher’s exact test) altered pathways following treatment with rPDGF-C of MRC5 fibroblasts. Dashed line indicates P value cut-off. b,c, Data are presented as mean values. Source data
Extended Data Fig. 9
Extended Data Fig. 9. Pdgfc knockdown in tumour cells has limited effects on the primary tumour stroma but reduces αSMA+ CAF numbers in metastatic deposits.
a,b, Representative immunostaining of shNTC (1,2) and shPdgfc (1,5) TSAE1 primary tumours from Fig. 4f. a, Sections stained for the endothelial marker endomucin (red), pericyte marker endosialin (green) and DAPI (blue) (scale bar, 100 µm). Brightness/contrast adjustment was performed on individual channels (ImageJ; all panels adjusted the same) before merging. b, αSMA immunohistochemistry (scale bar, 500 µm). c, Scoring of αSMA positivity of the lung metastases from Fig. 5e,f. Each bar represents an individual mouse. Scores calculated based on percentage of the metastatic deposit that was αSMA-positive: 0, 0%; 1, <20%; 2, 20-50%; 3, >50%. Note, two HRM1-shPdgfc mice had no detectable lung deposits, labelled as ‘x’. Source data
Extended Data Fig. 10
Extended Data Fig. 10. Metastasis of ZR-75-1 human ER+ breast cancer cells and effects of PDGFC knockdown or imatinib treatment.
a, Additional data associated with Fig. 6a. ZR-75-1-mChLuc2 cells injected orthotopically into n = 5 NSG mice. Left, tumour growth of individual mice. Right, representative ex vivo IVIS images of organs at endpoint (day 34-43). b, Associated with Fig. 6b. ZR-75-1-mChLuc2 cells injected intravenously into n = 6 NSG mice. Left, representative whole-body IVIS images of one mouse at week 0 (2 hours after tumour cell inoculation), week 2 and week 3. Right, representative ex vivo IVIS images of organs at endpoint (day 29). c, PDGFC (human-specific) RNAscope analysis of mouse tissue with human ZR-75-1 tumour cells from Fig. 6a,b. Representative images of lungs with dormant DTCs (spontaneous, first panel; experimental metastasis, second panel), a small lung deposit (experimental metastasis) and a primary tumour. Scale bar, 25 µm. d, Validation of ZR-75-1 shPDGFC cell lines. Left, PDGFC expression (RT-qPCR) in ZR-75-1-mChLuc2 shNTC(1,2) and shPDGFC(2,5) cells cultured in vitro. Representative data of two independent repeats. Right, proliferation of ZR-75-1-mChLuc2 shNTC(1,2) and shPDGFC(2,5) cells assessed by CellTiter-Glo (representative data of two independent repeats). e, Associated with Fig. 6c. ZR-75-1-mChLuc2 shNTC(1,2) and shPDGFC(2,5) cells injected intravenously in NSG mice (shNTC(1&2) and shPDGFC5(2&5); n = 7 or 8 mice per group, respectively). Quantification of ex vivo IVIS signal in organs (day 29). Light grey, shNTC1; dark grey, shNTC2; light red, shPDGFC2; dark red, shPDGFC5. f, Associated with Fig. 6e. Validation of ZR-75-1 EV and Pdgfc over-expression (o/e) cell lines. Left, Ct values (RT-qPCR) for human (Hs) B2M and mouse (Mm) Pdgfc (RT-qPCR). Right, proliferation of ZR-75-1 EV and Pdgfc o/e cells assessed by CellTiter-Glo (representative data of three independent repeats). g, Scoring of αSMA positivity of lung metastases from Fig. 7b. Each bar represents an individual mouse. Scores calculated based on percentage of the metastatic deposit that was αSMA-positive: 0, 0%; 1, <20%; 2, 20-50%; 3, >50%. d-f, Data represent mean values; e, ±SEM, two-tailed Mann-Whitney U-test. Source data

Comment in

References

    1. Ribelles N, et al. Pattern of recurrence of early breast cancer is different according to intrinsic subtype and proliferation index. Breast Cancer Res. 2013;15:R98. doi: 10.1186/bcr3559. - DOI - PMC - PubMed
    1. Pan H, et al. 20-year risks of breast-cancer recurrence after stopping endocrine therapy at 5 years. N. Engl. J. Med. 2017;377:1836–1846. doi: 10.1056/NEJMoa1701830. - DOI - PMC - PubMed
    1. Ghajar CM, et al. The perivascular niche regulates breast tumour dormancy. Nat. Cell Biol. 2013;15:807–817. doi: 10.1038/ncb2767. - DOI - PMC - PubMed
    1. Vera-Ramirez L, Vodnala SK, Nini R, Hunter KW, Green JE. Autophagy promotes the survival of dormant breast cancer cells and metastatic tumour recurrence. Nat. Commun. 2018;9:1944. doi: 10.1038/s41467-018-04070-6. - DOI - PMC - PubMed
    1. Malladi S, et al. Metastatic latency and immune evasion through autocrine inhibition of WNT. Cell. 2016;165:45–60. doi: 10.1016/j.cell.2016.02.025. - DOI - PMC - PubMed

Publication types

Substances