. 2023 Apr;55(4):651-664.
doi: 10.1038/s41588-023-01335-9. Epub 2023 Mar 13.

Bipotent transitional liver progenitor cells contribute to liver regeneration

Affiliations

Bipotent transitional liver progenitor cells contribute to liver regeneration

Wenjuan Pu et al. Nat Genet. 2023 Apr.

Erratum in

Abstract

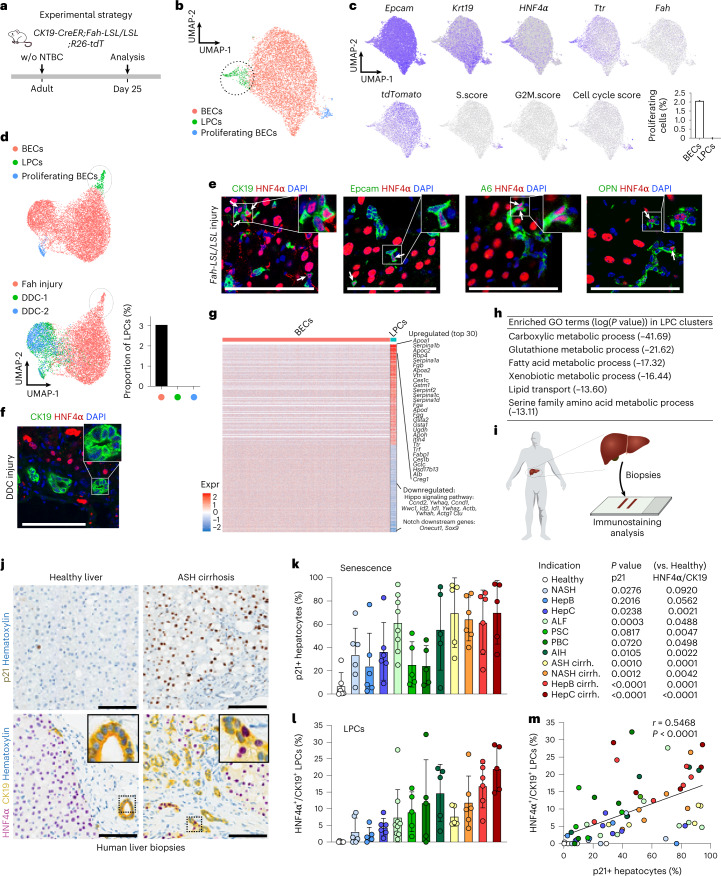
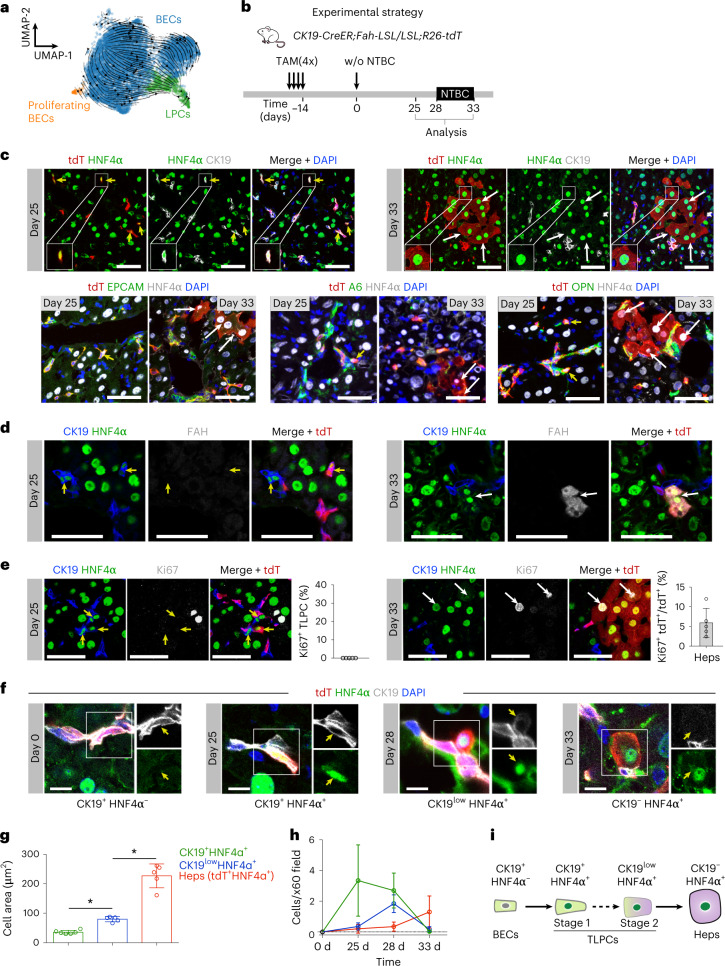
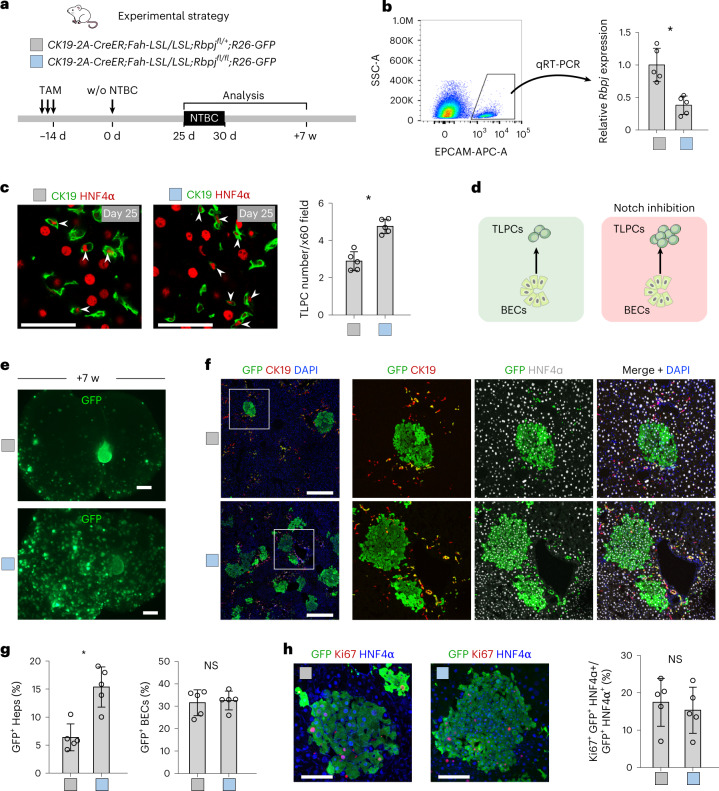
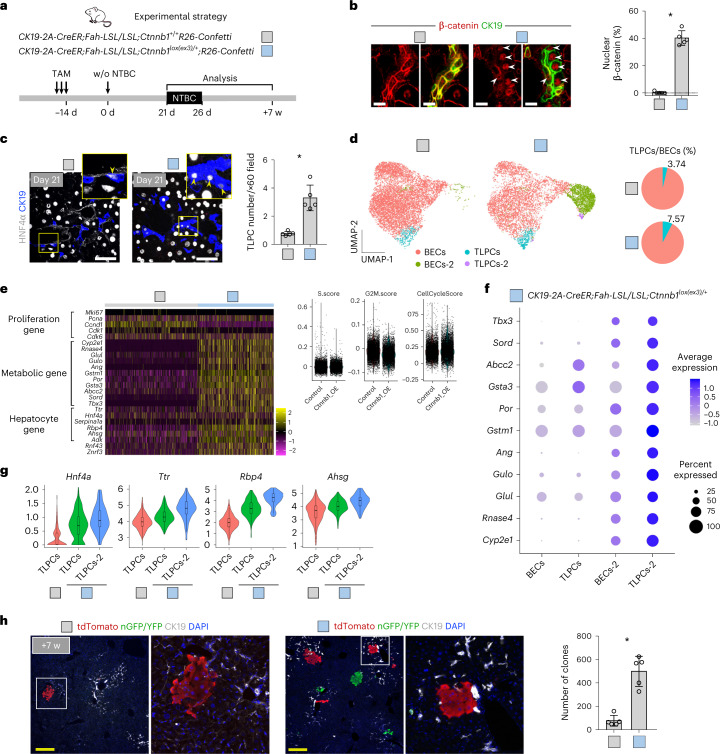
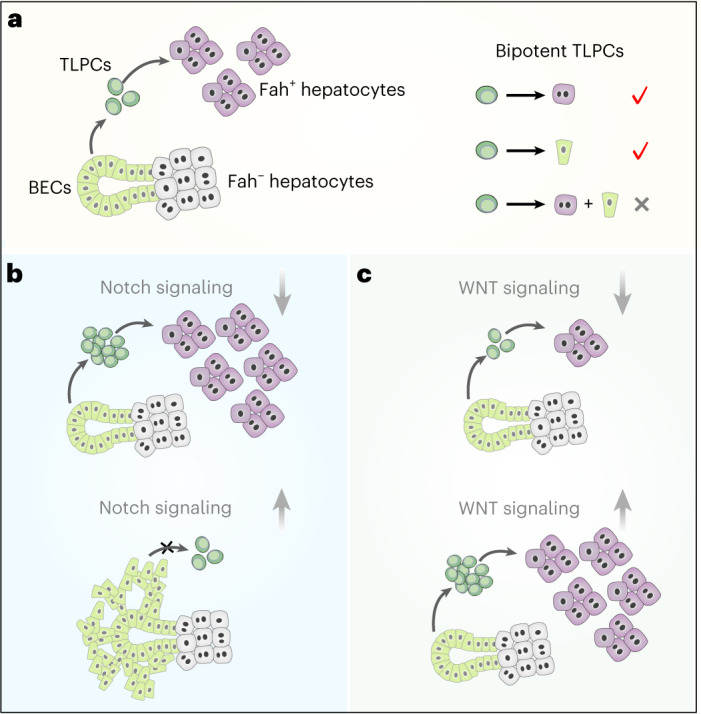
Following severe liver injury, when hepatocyte-mediated regeneration is impaired, biliary epithelial cells (BECs) can transdifferentiate into functional hepatocytes. However, the subset of BECs with such facultative tissue stem cell potential, as well as the mechanisms enabling transdifferentiation, remains elusive. Here we identify a transitional liver progenitor cell (TLPC), which originates from BECs and differentiates into hepatocytes during regeneration from severe liver injury. By applying a dual genetic lineage tracing approach, we specifically labeled TLPCs and found that they are bipotent, as they either differentiate into hepatocytes or re-adopt BEC fate. Mechanistically, Notch and Wnt/β-catenin signaling orchestrate BEC-to-TLPC and TLPC-to-hepatocyte conversions, respectively. Together, our study provides functional and mechanistic insights into transdifferentiation-assisted liver regeneration.


Conflict of interest statement

M.P. and J.S.T. are shareholders of and employed by Novartis Pharma AG but declare no conflict of interest associated with this work. The remaining authors declare no competing interests.

Figures

Fig. 1
Fig. 1. Identification of an LPC state in mouse and human livers.
a, Schematic showing experimental strategy. b, UMAP visualization of the EPCAM+ epithelial cell clusters—BECs, LPCs and proliferating BECs. c, UMAP plots show expression of indicated genes and cell cycle score. Proportion of proliferating cells in BECs and LPCs is shown in the right panel. d, Integrated UMAP showing BECs from Fah-LSL/LSL mice and BECs from mice fed with DDC diet. DDC data are retrieved from previous studies—DDC-1 (ref. ) and DDC-2 (ref. ). Proportion of LPCs in three groups is shown in the right panel. e, Immunostaining for HNF4α, CK19, EPCAM, A6 and OPN on Fah-LSL/LSL liver sections. White arrows indicate LPCs. f, Immunostaining for CK19 and HNF4α liver sections from mice fed with DDC for 3 weeks. g, Heatmap showing the differentially expressed genes between BECs and LPCs. Each column represents a cell and each row represents a gene. h, Selected GO terms enriched in LPCs cluster. The gene enrichment analysis was done by Metascape, which uses the well-adopted hypergeometric test and Benjamini-Hochberg P value correction algorithm to identify all enriched ontology terms. i, Schematic showing experimental strategy. j, Immunostaining for p21, CK19 and HNF4α in the indicated human liver biopsies. k,l, Quantification of the percentage of hepatocytes with nuclear p21 staining (senescence, k) or CK19+ cells expressing HNF4α (LPCs, l). Data represent mean ± s.d. n = patients. In k, unpaired two-tailed t tests were used (versus healthy, n = 6): NASH (n = 6), hepatitis (Hep)B (n = 6), HepC (n = 6), acute liver failure (ALF; n = 8), PSC (n = 5), PBC; (n = 5), AIH (n = 5), ASH cirrhosis (n = 5), NASH cirrhosis (n = 6), HepB cirrhosis (n = 6), HepC cirrhosis (n = 5). In l, unpaired two-tailed t tests were used (versus healthy, n = 6): NASH (n = 6), HepB (n = 5), HepC (n = 6), ALF (n = 9), PSC (n = 5), PBC (n = 5), AIH (n = 5), ASH cirrhosis (n = 5), NASH cirrhosis (n = 6), HepB cirrhosis (n = 6), HepC cirrhosis (n = 5). m, Correlation plot of the LPC number and hepatocyte senescence percentage. Pearson correlation was performed for statistical analysis. Scale bars in all immunostaining images, 100 µm. Source data
Fig. 2
Fig. 2. LPCs are a transitional cellular state between BECs and hepatocytes during transdifferentiation.
a, UMAP embedding of RNA velocity of EPCAM+ cells collected from Fah-LSL/LSL mice at day 25 after initial NTBC removal indicates the transition from BECs to LPCs. b, Schematic showing experimental strategy. c, Immunostaining for tdT, HNF4α, CK19, EPCAM, A6 or OPN on liver sections collected at days 25 and 33 after NTBC removal from CK19-CreER;Fah-LSL/LSL;R26-tdT mice. Yellow arrows indicate tdT+ LPCs and white arrows indicate tdT+ hepatocytes. Scale bars, 100 µm. d, Immunostaining for tdT, HNF4α, CK19 and FAH on liver sections collected at days 25 and 33 after NTBC removal. Scale bars, 50 µm. Yellow arrows indicate LPCs and white arrows indicate tdT+ hepatocytes. e, Immunostaining of tdT, HNF4α, CK19 and Ki67 on liver sections collected at days 25 and 33 after NTBC removal. Yellow arrows indicate LPCs and white arrows indicate tdT+ hepatocytes. Percentage of Ki67+ TLPCs and Ki67+tdT+ hepatocytes in tdT+ hepatocytes is shown on the right panel. Data represent mean ± s.d.; n = 5 mice. Scale bars, 100 µm. f, Immunostaining for tdT, HNF4α and CK19 on liver sections collected at different time points. Scale bars, 10 µm. g, Cell area quantification in TLPCs (CK19+HNF4α+ and CK19lowHNF4α+) and hepatocytes (tdT+). Data represent mean ± s.d.; CK19+HNF4α+: n = 6 mice, CK19lowHNF4α+ and Heps: n = 5 mice; CK19lowHNF4α+ versus CK19+HNF4α+: *P = 0.02; Heps versus CK19lowHNF4α+: *P < 0.0001. Statistical analysis was performed by ANOVA followed by Tukey’s method for multiple comparisons, and adjustments were made for multiple comparisons. h, Quantification of the number of TLPCs (CK19+HNF4α+ and CK19lowHNF4α+) and hepatocytes (tdT+) per portal region ×60 field at different time points. Data represent mean ± s.d.; n = 5 mice. i, Schematic showing that TLPCs originate from BECs and differentiate into hepatocytes. Hep, hepatocyte; w/o, without.
Fig. 3
Fig. 3. Bipotent TLPCs generate hepatocytes or adopt BEC fate during liver repair.
a, Schematic showing the strategy for TLPC lineage tracing. b, Schematic showing experimental strategy. c, Immunostaining for tdT, HNF4α and CK19 on liver sections collected at day 25 from CK19-CreER;HNF4α-DreER;Fah-LSL/LSL;R26-RL-tdT mice. Scale bars, 50 µm. Right panel shows the percentage of BECs, TLPCs and hepatocytes in tdT+ cells. Data represent mean ± s.d.; n = 5 mice; total 289 tdT+ cells were counted (BECs: 25; TLPCs: 258; hepatocyte: 6). d, Percentage of Ki67+ cells in tdT+ TLPCs. Data represent mean ± s.d.; n = 5 mice. e, Immunostaining for tdT, HNF4α and CK19 on liver sections collected at day 25 from CK19-CreER; Fah-LSL/LSL;R26-RL-tdT or HNF4α-DreER;Fah-LSL/LSL;R26-RL-tdT mice. Scale bars, 50 µm. f, Whole-mount tdT fluorescent liver images from indicated mice at 7 weeks after the first NTBC removal. Bright field images are shown as inserts. Arrows indicate tdT+ clones. Scale bars, 1 mm. g, Immunostaining for tdT, HNF4α and CK19 on serial sections (20 µm) of livers collected at week 7 from CK19-CreER;HNF4α-DreER;Fah-LSL/LSL;R26-RL-tdT mice. Scale bars, 50 µm. h, Immunostaining of tdT, and CK19 on serial liver sections (20 µm) collected at week 7 from CK19-CreER;HNF4α-DreER;Fah-LSL/LSL;R26-RL-tdT mice. Scale bars, 50 µm. White arrows indicate tdT+ BECs. i, Immunostaining for tdT, HNF4α and CK19 on liver sections collected from CK19-CreER;Fah-LSL/LSL;R26-RL-tdT or HNF4α-DreER;Fah-LSL/LSL;R26-RL-tdT mice. Scale bars, 1 mm. j, Percentage of tdT+ clones containing BECs, TLPCs and hepatocytes. Schematic on the right panel showing that TLPCs could give rise to hepatocytes and revert back to BECs. Data represent mean ± s.d.; n = 5 mice; total 480 tdT+ clones were counted. k, Percentage of hybrid clone that consists of BECs and hepatocytes. Schematic showing that TLPCs could not give rise to hepatocytes and BEC simultaneously. Data represent mean ± s.d.; n = 5 mice. ln, Immunostaining for tdT, FAH, p21 and Ki67 on tissue sections. Right panels are quantifications for percentage of hepatocytes expressing these markers. Scale bars, 100 µm. Data represent mean ± s.d.; n = 5 mice; m, *P < 0.0001; n, *P < 0.0001. Statistical analysis was performed by two-tailed unpaired Student’s t test in m and n. w, weeks.
Fig. 4
Fig. 4. Inhibition of Notch signaling promotes the activation of TLPCs.
a, Schematic figure showing experimental strategy for Rbpj gene knockout in BECs. b, Representative gating for FACS sorting of EPCAM+ BECs used for qRT-PCR. Relative expression levels of Rbpj mRNA in BECs from indicated mice. Data represent mean ± s.d.; n = 5 mice; *P = 0.0016. c, Immunostaining for HNF4α and CK19 on liver sections collected at day 25 after NTBC removal from indicated mice. Scale bars, 50 µm. Quantification of the number of TLPCs per portal region ×60 field is shown on the right panel. Data represent mean ± s.d.; n = 5 mice; *P = 0.0002. Total count of TLPCs in control: 717; in mutant: 1,159. White arrowheads indicate TLPCs. d, Schematic showing that inhibition of Notch signaling promotes BEC-to-TLPC transition. e, Whole-mount GFP fluorescent liver images collected at week 7 after NTBC removal. Scale bars, 2 mm. f, Immunostaining for GFP, HNF4α and CK19 on the liver sections collected at week 7 after NTBC removal. Scale bars, 500 µm. g, Percentage of GFP+ hepatocytes and GFP+ BECs. Data represent mean ± s.d.; n = 5 mice; GFP+ Heps (%): *P = 0.0016; GFP+ BECs (%): *P = 0.7691. h, Immunostaining for GFP, HNF4α and Ki67 on liver sections collected at week 7 after NTBC removal. Quantification of proliferation (Ki67) in GFP+ hepatocytes is shown on the right panel. Data represent mean ± s.d.; n = 5 mice. Scale bars, 100 µm. Statistical analysis was performed by two-tailed unpaired Student’s t test in b, c, g and h. NS, not significant; w, weeks.
Fig. 5
Fig. 5. Notch activation inhibits BEC-to-TLPC activation.
a, Schematic showing experimental strategy. Control, CK19-2A-CreER;Fah-LSL/LSL;R26-tdT. NICD-OE, CK19-2A-CreER;Fah-LSL/LSL;R26-NICD-GFP. b, Immunostaining for HNF4α and CK19 on liver sections collected at day 25 after NTBC removal. Scale bars, 50 µm. c, Quantification of the number of TLPCs and GFP+ TLPCs per portal region ×60 field from the indicated mice. Data represent mean ± s.d.; n = 5 mice; *P = 0.0004; Total count of TLPCs in control: 789, in NICD group: 92. d, Immunostaining for tdT or GFP, Ki67 and CK19 on liver sections collected at day 25 after NTBC removal. Percentage of Ki67+ BECs is shown on the right panel. Data represent mean ± s.d.; n = 5 mice; *P < 0.0001. Scale bars, 50 µm. e, UMAP visualization of EPCAM+ cells collected from control and NICD-OE mice at day 25 after NTBC removal. The percentage of TLPCs and proliferating BECs is shown on the right. f, Upper panel is scRNA-seq heatmap for EPCAM+ cells from control and NICD-OE mice showing expression of selected genes per cell. Middle panel shows violin plot of cell cycle score of genes related to G2M and S phases. Lower panel shows UMAP plot of gene set score of S, G2M and cell cycle. g, Immunostaining for tdT or GFP, HNF4α, and CK19 on liver sections collected at week 7 after NTBC removal. Quantification of the ductular reaction per ×10 field and the percentage of tdT+ or GFP+ hepatocytes is shown on the right panel. Data represent mean ± s.d.; n = 5 mice; CK19 density (10×): *P < 0.0001; Reporter+ Heps: *P < 0.0001. Scale bars, 100 µm. h, Immunostaining for tdT or GFP, Ki67 and CK19 on liver sections collected at week 7 after NTBC removal. Percentage of Ki67+ BECs is shown on the right panel. Data represent mean ± s.d.; n = 5 mice; *P < 0.0001. Scale bars, 100 µm. i, Schematic showing that Notch signaling inhibited BEC-to-TLPCS activation. Statistical analysis was performed by two-tailed unpaired Student’s t test in c, d, g and h. w, weeks.
Fig. 6
Fig. 6. WNT signaling abrogation inhibits the conversion of TLPCs into hepatocytes.
a, Schematic figure showing experimental strategy. b, Schematic figure showing strategy for sorting of tdT+ cells used for scRNA-seq. c, UMAP visualization of the cell populations collected from CK19-CreER;Fah-LSL/LSL;R26-tdT mice at day 28 after NTBC removal. d, UMAP visualization of TLPC and hepatocyte populations and UMAP plots show the expression of indicated genes in TLPC and hepatocyte populations. e, Immunostaining for tdT and CYP2E1 on the liver sections collected on day 28 after NTBC removal. Arrowheads indicate tdT+CYP2E1+ hepatocytes. Scale bars, 50 µm. f, Schematic showing experimental strategy for Ctnnb1 gene knockout in BECs. g, Immunostaining for CK19 and β-catenin on liver sections. Percentage of β-catenin+ BECs. Data represent mean ± s.d.; n = 5 mice; *P < 0.0001. Scale bars, 10 µm. White arrowheads indicate β-catenin+ BECs. h, Immunostaining for CK19 and HNF4α on liver sections collected at day 25 after NTBC removal. Scale bars, 50 µm. Quantification of the number of TLPCs per portal region ×60 field is shown on the right panel. Data represent mean ± s.d.; n = 6–7 mice (control group: n = 7 mice, Ctnnb1 knockout group: n = 6 mice). Total count of TLPCs in control: 1,870; in Ctnnb1 knockout group: 1380. White arrowheads indicate TLPCs. i, Immunostaining for tdT, nGFP or YFP, CK19 and HNF4α on liver sections collected at week 7 after NTBC removal. The number of reporter+ clones per left liver lobe is shown on the right panel. Data represent mean ± s.d.; n = 5 mice; *P = 0.0028. Scale bars, 100 µm. j, Immunostaining CK19 on liver sections collected at week 7 after NTBC removal. Quantification of ductular reaction in ×10 field is shown on the right panel. Data represent mean ± s.d.; n = 5 mice. Scale bars, 100 µm. k, Schematic showing inhibition of TLPC-to-hepatocyte following abrogation of WNT signaling. Statistical analysis was performed by two-tailed unpaired Student’s t test in gj. w, weeks.
Fig. 7
Fig. 7. Activation of WNT signaling promotes the activation of TLPCs and their transdifferentiation into hepatocytes.
a, Schematic showing experimental strategy for tamoxifen, NTBC treatment and tissue collection from CK19-2A-CreER;Fah-LSL/LSL;Ctnnb1+/+R26-Confetti mice (Ctnnb1+/+) or CK19-2A-CreER;Fah-LSL/LSL;Ctnnb1lox(ex3)/+;R26-Confetti mice (Ctnnb1lox(ex3)/+) at indicated time points. b, Immunostaining for β-catenin and CK19 on liver sections. Percentage of nuclear β-catenin is shown on the right panel. Data represent mean ± s.d.; n = 5 mice; *P < 0.0001. Scale bars, 10 µm. White arrowheads indicate nuclear β-catenin+ BECs. c, Immunostaining for HNF4α and CK19 on liver sections collected at day 21 after NTBC removal. Quantification of the number of TLPCs per portal region ×60 field is shown on the right panel. Data represent mean ± s.d.; n = 5 mice; *P = 0.0003. Scale bars, 100 µm. Yellow arrowheads indicate TLPCs. d, UMAP visualization of the EPCAM+ populations collected at day 21 after NTBC removal. The percentage of TLPCs is shown on the right panel. e, scRNA-seq heatmap for EPCAM+ cells showing expression of selected genes per cell in Ctnnb1+/+ and Ctnnb1lox(ex3)/+ mice. Right panel shows cell cycle score. f, Relative expression of metabolic genes in cell clusters identified by scRNA-seq. Circle size represents the within-cluster probability of gene detection and fill colors represent normalized mean expression levels. g, Violin plots showing expression levels for selected hepatocyte genes per single cell in TLPC clusters in Ctnnb1+/+ and Ctnnb1lox(ex3)/+ mice. h, Immunostaining of tdT, nGFP or YFP and CK19 on liver sections collected at week 7 after NTBC removal. The number of reporter+ clones per left liver lobe is shown on the right panel. Data represent mean ± s.d.; n = 5 mice; *P = 0.0001. Scale bars, 100 µm. Statistical analysis was performed by two-tailed unpaired Student’s t test in b, c and h. w, weeks.
Fig. 8
Fig. 8. Bipotent TLPCs contribute to liver regeneration.
a, A cartoon image showing that TLPCs originate from BECs and differentiate into hepatocytes during liver regeneration. TLPCs are bipotent, contributing to either hepatocyte or BEC clones. b, Inhibition of Notch signaling promotes BEC-to-TLPC conversion, while activation of Notch signaling inhibits this process while promoting BEC proliferation. c, Inhibition of WNT signaling reduces TLPC-to-hepatocyte conversion but does not influence BEC-to-TLPC activation. WNT signaling activation promotes BEC-to-TPLC activation and TLPC-to-hepatocyte conversion.
Extended Data Fig. 1
Extended Data Fig. 1. Generation and characterization of Fah-LSL mice.
a, Schematic diagram showing the strategy for generation of Fah-LSL knock-in allele by homologous recombination using CRISPR/Cas9. b, Schematic diagram showing re-expression of Fah after LSL removal by crossing of Fah-LSL mice with ACTB-Cre mice. c, Relative mRNA expression levels of Fah in the livers of adult Fah-LSL/ + , Fah-LSL/LSL and Fah-LSL/LSL;ACTB-Cre mice treated with NTBC. Data are the mean ± SD; n = 5 mice; *P < 0.0001, *P < 0.0001. d, Western blotting for FAH in the livers of adult Fah-LSL/ + , Fah-LSL/LSL and Fah-LSL/LSL;ACTB-Cre mice treated with NTBC. Quantification of the relative protein levels of FAH was shown on the right. Data are the mean ± SD; n = 3 mice; *P < 0.0001, *P < 0.0001. Statistical analysis in c and d was performed by ANOVA followed by Bonferroni test for multiple comparisons and adjustments were made for multiple comparisons. e, Immunostaining for FAH and CK19 on the liver sections from adult Fah-LSL/ + , Fah-LSL/LSL, and Fah-LSL/LSL;ACTB-Cre mice treated with NTBC. Arrowheads, CK19+FAH BECs. Scale bar, 100 µm. f, Schematic showing the experimental strategy for NTBC withdrawal (w/o NTBC) and tissue analysis at indicated time points. g, Weekly body weight measurements for Fah-LSL/ + and Fah-LSL/LSL mice after NTBC withdrawal (w/o NTBC). The data are normalized to the body weights at week 0. Data represent mean ± SD; n = 5 mice; week2: *P < 0.0004; week3-wek6: *P < 0.0001. Statistical analysis was performed by multiple t test. Each row was analyzed individually without assuming a consistent SD. h, Hematoxylin and eosin (H&E) staining of liver sections. Scale bar, 100 µm. i,j, Immunostaining of GS and E-cad (i) and p21 (j) on liver sections from adult Fah-LSL/ + , Fah-LSL/LSL and Fah-LSL/LSL;ACTB-Cre mice treated with NTBC (w/ NTBC) or at 8 weeks after NTBC removal (w/o NTBC). Scale bar, 100 µm.
Extended Data Fig. 2
Extended Data Fig. 2. BEC-derived hepatocytes contribute to liver regeneration.
a, Schematic diagram showing the experimental design for recovery of Fah gene in BECs and lineage tracing. b, Schematic diagram showing the experimental strategy of lineage tracing in CK19-CreER;Fah-LSL/LSL;R26-tdT mice. c, Immunostaining for tdT, CK19, and HNF4α on liver sections collected at day 0. Scale bar, 1 mm. Right panel shows quantification of cell labeling efficiency. Data represent mean ± SD; n = 5 mice. d, Whole-mount fluorescence liver images. Scale bars, 1 mm. e, Immunostaining for tdT on liver sections from mice treated with TAM or oil. Scale bars, 1 mm. f, Immunostaining for tdT, HNF4α, and CK19 on the liver sections from mice treated with TAM or oil. Quantification of percentage of tdT+ BECs and tdT+ Heps is shown in the adjacent graph. Data represent mean ± SD; n = 5 mice. Scale bars, 100 µm. g, Immunostaining for tdT and FAH on the liver sections from mice treated with TAM or oil. Scale bars, 100 µm. h, Serum ALT and AST of mice treated with TAM or oil. Data are the mean ± SD; n = 5 mice. *P < 0.0001; *P < 0.0001. i,j, Immunostaining for tdT, HNF4α and p21 (i) or Ki67 (j) on liver sections. Inserts show green and red fluorescence channels. Quantification of Ki67 or p21 staining in tdT+ and tdT hepatocytes is shown in the adjacent graph. Data represent mean ± SD; n = 5 mice. *P < 0.0001; Statistical analysis in h and j was performed by two-tailed unpaired Student’s t test. k, Immunostaining for tdT with E-CAD or CYP2E1 on the liver sections from mice treated with TAM or Oil. Scale bars, 100 µm. l, Schematic figure showing the experimental strategy. m, Immunostaining for tdT, CK19, and HNF4α on the liver sections. Data represent mean ± SD; n = 5 mice. Scale bars, 100 µm. W/o NTBC, without NTBC.
Extended Data Fig. 3
Extended Data Fig. 3. BECs-derived hepatocytes contribute to liver regeneration.
a, Schematic showing experimental strategies. b, Kaplan-Meier plot showing survival of CK19-CreER;Fah-LSL/LSL;R26-tdT mice in different strategies. c, Immunostaining for tdT, CK19, and HNF4α on liver sections of indicated mice collected at week 7. Scale bars, 100 µm. d, Schematic showing experimental strategies. e, Whole-mount tdT fluorescent liver images from indicated mice at 6 months after the first NTBC removal. Scale bars, 2 mm. f, Immunostaining for tdT, CK19, and HNF4α on liver sections of indicated mice collected at month 6 (+6 m). Scale bars, 100 µm. W/o NTBC, without NTBC.
Extended Data Fig. 4
Extended Data Fig. 4. Clonal analysis of single BEC-derived cells.
a, Schematic figure showing that single BECs were marked by either tdT, CFP, YFP or nGFP after TAM-induced recombination, as their conversion into hepatocytes in CK19-CreER;Fah-LSL/LSL;R26-confetti mice. b, Schematic figure showing the experimental strategy. c, Immunostaining for tdT, nGFP/YFP, and CK19 on the liver sections from CK19-CreER;Fah-LSL/LSL;R26-confetti mice. 2 exemplary images (view 1 + 2) from different portal tracts are shown. The percentage of reporter+ BECs and reporter+ hepatocytes are shown in the adjacent graph. Data are the mean ± SD; n = 5 mice. Scale bars, 50 µm. d, Immunostaining for tdT, nGFP/YFP, and CK19 on the liver sections collected from CK19-CreER;Fah-LSL/LSL;R26-confetti mice at week 10. Numbers in the images indicated the sequential order of serial 20 µm-sections of 2 entire clones. White arrowhead, reporter+ hepatocytes; yellow arrowhead, reporter+ BECs. Scale bars, 100 µm. e, Percentage of reporter+ hepatocyte clones located close to the PV or CV region. f, Cartoon image showing that BECs proliferate before conversion into TLPCs, and TLPCs converted into either hepatocytes or BECs. Single BECs could contribute to both hepatocytes and BECs during liver injury. Data are the mean ± SD; n = 5 mice. PV, portal vein; CV, central vein.
Extended Data Fig. 5
Extended Data Fig. 5. Analysis of gene expression in BECs and TLPCs.
a, Schematic figure showing the experimental strategy and representative gating for FACS of EPCAM+ cells utilized for scRNA-seq. b, UMAP visualization of cells obtained from FACS sorting. c, Violin plots showing the marker gene expression levels per single cell in each cluster. d, Integrated UMAP showing BECs from CK19-CreER;Fah-LSL/LSL;R26-tdT mice kept with NTBC (w/ NTBC) and kept off NTBC for 25 days (w/o NTBC). Proportion of TLPCs in the two groups is shown. e, UMAP plots showing the expression of the indicated genes. f, Immunostaining for YAP/TAZ, CK19, and HNF4α on sections of liver collected at day 25 from CK19-CreER;Fah-LSL/LSL;R26-tdT mice. Scale bars, 50 µm. g, Immunostaining for SOX9, CK19, and HNF4α on sections of liver collected at day 25 from CK19-CreER;Fah-LSL/LSL;R26-tdT mice. Scale bars, 50 µm. Yellow arrowheads, BECs; white arrowheads, TLPCs. Each immunostaining image is representative of 5 mice. h, MET and EGFR pathway analysis by ssGSEA of EPCAM+ cells from d. i, MET and EGFR pathway analysis of BECs and TLPCs from mice (w/o NTBC) by ssGSEA. Mann-Whitney test was used to indentify the significant of the pathway scores between BECs and TLPCs. *p < 0.0001; NS, non-significant. j, List of genes with gene sets for MET and EGFR pathways.
Extended Data Fig. 6
Extended Data Fig. 6. Presence of TLPCs and hepatocyte senescence in human livers.
a, Immunostaining for p21 or HNF4α and CK19 in patient biopsies from the indicated human liver disease indications. Quantifications for p21+ hepatocytes and HNF4α+CK19+ TLPCs are shown in Fig. 1. Scale bars, 100 µm. b, Immunostaining for p21 and CK19 in the indicated human liver biopsies. Scale bars, 50 µm. c, Quantification of p21+ BECs in the indicated liver biopsies. Data represent mean ± SD. n = patients. Unpaired two-tailed t tests were used (vs. healthy, n = 4): alcoholic steatohepatitis (ASH) cirrhosis (n = 4, *P = 0.0495)): non-alcoholic steatohepatitis (NASH) cirrhosis (n = 4, P = 0.2207), Hepatitis (Hep)B cirrhosis (n = 4, ***P = 0.0009), HepC cirrhosis (n = 4, **P = 0.0031). d, Immunostaining showing HNF4α+CK19+ TLPCs within different BEC populations in the indicated biopsies (BD, bile duct; DR, ductular reaction: CoH, canals of Hering). Scale bars, 50 µm.
Extended Data Fig. 7
Extended Data Fig. 7. Generation of CK19-2A-CreER mouse line and Rbpj knockout in BECs.
a, Schematic figure showing knock-in strategy for generation of the CK19-2A-CreER allele by homologous recombination. b, Genetic lineage tracing for CK19+ BECs by Cre-loxp recombination. c, Schematic figure showing the experimental strategy (left panel). Immunostaining for tdT and CK19 on liver section (middle panel). Quantification of percentage of BECs expressing tdT is shown in the adjacent graph. Data are the mean ± SD; n = 5 mice. d, Schematic figure showing the experimental strategy. Immunostaining for nGFP/YFP, tdT, and CK19 on liver sections. Quantification of percentage of reporter+ BECs is shown in the adjacent graph. Data represent mean ± SD; n = 5 mice. e,i, Schematic figures showing the experiment strategy. f,j, Immunostaining for CK19 on liver sections. g,k, Quantification of CK19 density per 10x field. Data represent mean ± SD; n = 5 mice; NS, non-significant. h,l, Quantification of serum total bilirubin (TBIL) from indicated mice. Statistical analysis was performed by two-tailed unpaired Student’s t test in g, h, k, l. Data represent mean ± SD; n = 5 mice; NS, non-significant. Scale bars, 100 µm.
Extended Data Fig. 8
Extended Data Fig. 8. Inhibition of Notch signaling increases generation of TLPCs.
a, Schematic figure showing the experimental strategy. Dibenzazepine (DBZ) is a pharmacologic Notch inhibitor, which inhibits Notch cleavage and blocks its activation. b, Immunostaining for Ki67 on intestine sections collected at day 25. Scale bars, 100 µm. c, Immunostaining for Mucin2 and E-CAD on small intestine sections collected at day 25. Scale bars, 100 µm. d, Immunostaining for CK19 and HNF4α on liver sections collected at day 25. Arrowheads, CK19+HNF4α+ TLPCs. Scale bars, 100 µm. Quantification of the number of TLPCs per 60x field in portal region is shown in the adjacent graph. Data are the mean ± SD; n = 5 mice. *P = 0.0006. e, Immunostaining for tdT, HNF4α, and CK19 on sections of liver collected at day 40. Number of tdT+ hepatocyte clusters per 10x field is quantified in the adjacent graph. Arrowheads, tdT+HNF4α+ hepatocyte clones. Data are the mean ± SD; n = 4 mice; *P = 0.0192. Statistical analysis was performed by two-tailed unpaired Student’s t test in d,e. Scale bars, 100 µm.
Extended Data Fig. 9
Extended Data Fig. 9. Over-expression of NICD and lineage tracing in BECs.
a, Schematic figure showing the knock-in strategy for R26-NICD-GFP allele by homologous recombination using CRISPR/Cas9. b, Schematic figure showing the experimental strategy for over-expression of the Notch intracellular domain (NICD; activated Notch) in BECs by crossing CK19-2A-CreER with R26-NICD-GFP mice to generate CK19-2A-CreER;R26-NICD-GFP mice. c, Schematic showing the experimental strategy for TAM or oil treatment and tissue analysis at indicated time points. d,e, Immunostaining for GFP, CK19, Ki67 and HNF4α on liver sections from CK19-2A-CreER;R26-NICD-GFP mice treated with oil (d) or TAM (e). Scale bars, 100 µm. f, Isolation of EPCAM+ cells by flow cytometry followed by quantitative RT-PCR (qRT-PCR) analysis for expression of Notch1 and Notch target genes. Statistical analysis was performed by two-tailed unpaired Student’s t test in f. Data represent mean ± SD; n = 5 mice per group. *P = 0.0002 (Notch1); *P = 0.0099 (Hes5); *P = 0.0001 (Hey1); *P < 0.0001 (Hey2); *P < 0.0001 (HeyL).
Extended Data Fig. 10
Extended Data Fig. 10. WNT activation increases BEC-to-hepatocyte formation but not BEC proliferation.
a, Schematic figure showing the experimental strategy for CK19-2A-CreER;Fah-LSL/LSL;Ctnnb1+/+R26-Confetti mice (Ctnnb1+/+) or CK19-2A-CreER;Fah-LSL/LSL;Ctnnb1lox(ex3)/+;R26-Confetti mice (Ctnnb1lox(ex3)/+). b, Violin plots showing selected gene expression levels per single cell in BECs collected from Ctnnb1+/+ and Ctnnb1lox(ex3)/+ mice at day 21. c, UMAP plots showing the expression of the indicated genes in each cluster collected from Ctnnb1lox(ex3)/+ mice at day 21. d, Immunostaining for CK19 and Ki67 on liver sections collected at day 21 and week 7 from the indicated mice. The percentage of proliferating BECs (Ki67+) is shown on the right panel. Data represent mean ± SD; n = 5 mice; NS, no significance. Scale bars, 50 µm. e, Immunostaining for fluorescent markers, CK19, and HNF4α on liver sections from the indicated mice. Scale bars, 100 µm. f, GSEA analysis in the left panel shows differentially expressed hallmark pathways between the Ctnnb1lox(ex3)/+ group and Ctnnb1+/+ group. Right panel shows heat map of Notch pathway leading edge genes. g, Schematic figure showing the experimental strategy. h, Immunostaining for tdT, HNF4α, and CK19 on sections of liver collected at day 40. Scale bars, 500 µm. i, Quantification of the number of tdT+ hepatocyte clusters per 10x field in vehicle or RSPO1-treated mice livers. Arrowheads, tdT+HNF4α+ hepatocyte clones. Data are the mean ± SD; n = 4 (RSPO1 group) and 5 (vehicle group) mice; *P = 0.0107. Statistical analysis was performed by two-tailed unpaired Student’s t test in d, i; Kolmogorov-Smirnov (KS) test was used in f.

References

    1. Stanger BZ. Cellular homeostasis and repair in the mammalian liver. Annu. Rev. Physiol. 2015;77:179–200. doi: 10.1146/annurev-physiol-021113-170255. - DOI - PMC - PubMed
    1. Gadd VL, Aleksieva N, Forbes SJ. Epithelial plasticity during liver injury and regeneration. Cell Stem Cell. 2020;27:557–573. doi: 10.1016/j.stem.2020.08.016. - DOI - PubMed
    1. Michalopoulos GK, DeFrances MC. Liver regeneration. Science. 1997;276:60–66. doi: 10.1126/science.276.5309.60. - DOI - PubMed
    1. Michalopoulos GK. Liver regeneration. J. Cell. Physiol. 2007;213:286–300. doi: 10.1002/jcp.21172. - DOI - PMC - PubMed
    1. Miyajima A, Tanaka M, Itoh T. Stem/progenitor cells in liver development, homeostasis, regeneration, and reprogramming. Cell Stem Cell. 2014;14:561–574. doi: 10.1016/j.stem.2014.04.010. - DOI - PubMed

Publication types