. 2023 Apr;55(4):595-606.
doi: 10.1038/s41588-023-01298-x. Epub 2023 Mar 13.

Preneoplastic stromal cells promote BRCA1-mediated breast tumorigenesis

Affiliations

Preneoplastic stromal cells promote BRCA1-mediated breast tumorigenesis

Kevin Nee et al. Nat Genet. 2023 Apr.

Abstract

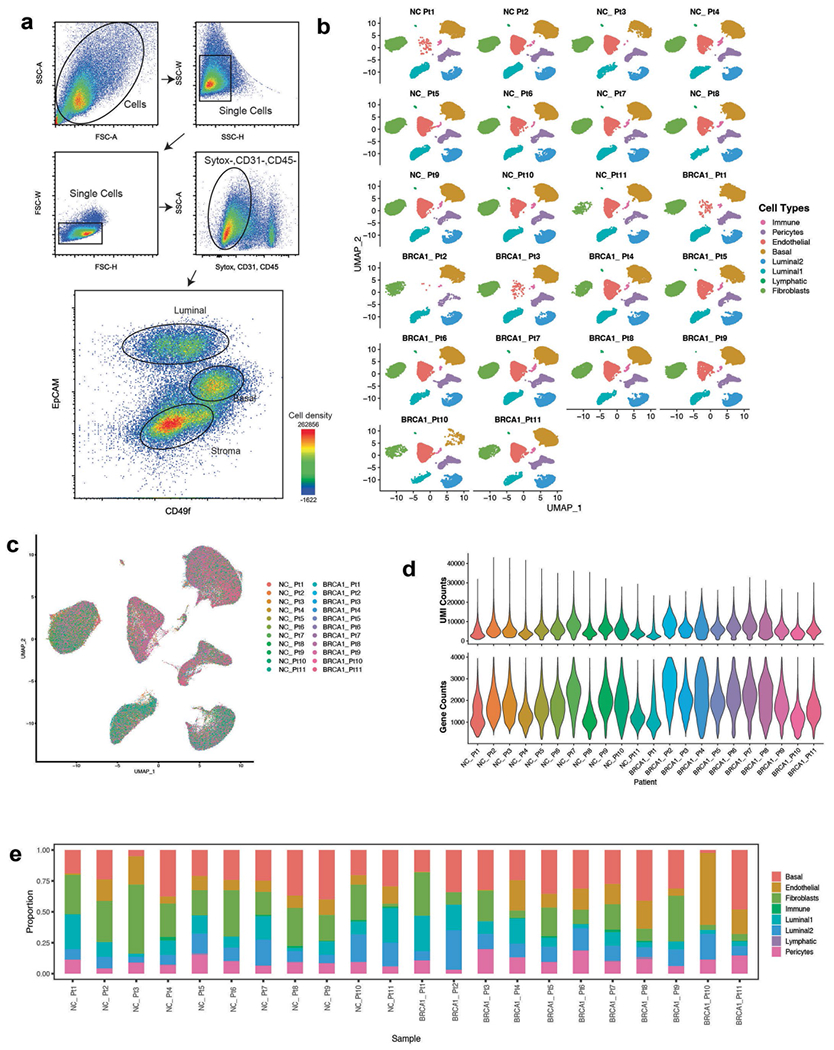
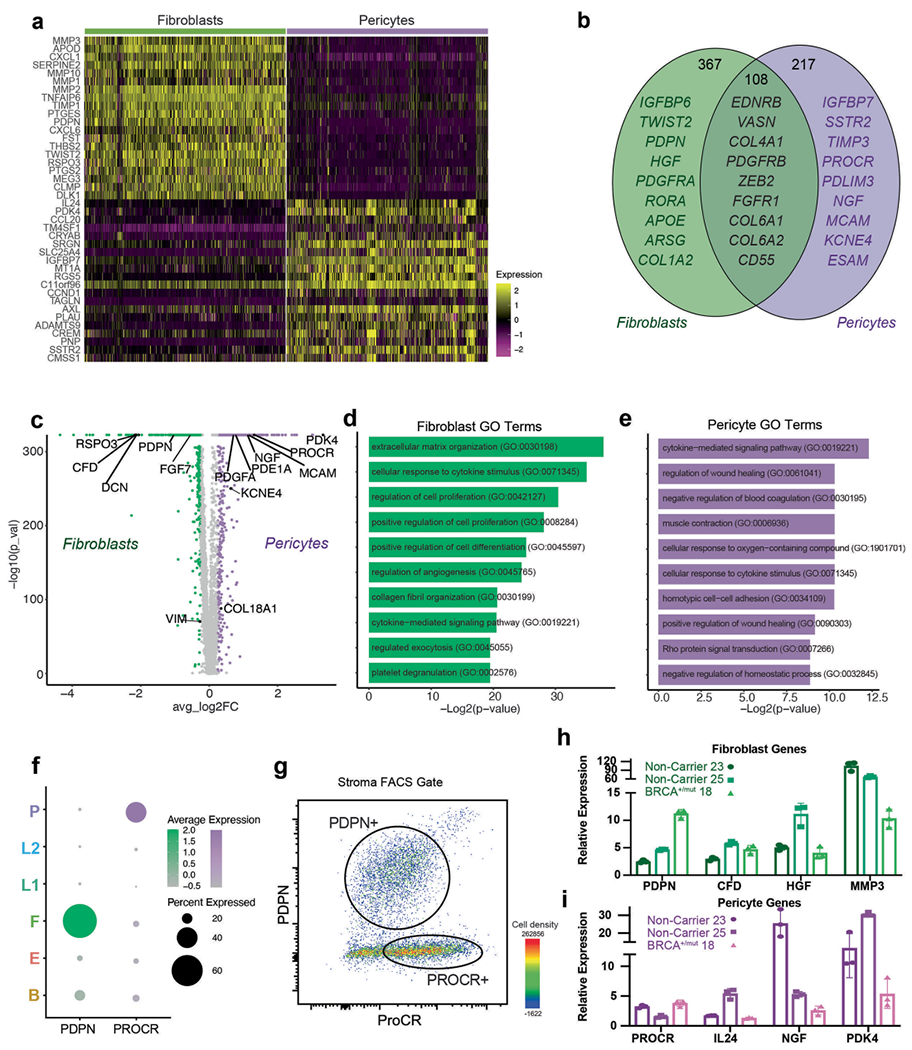
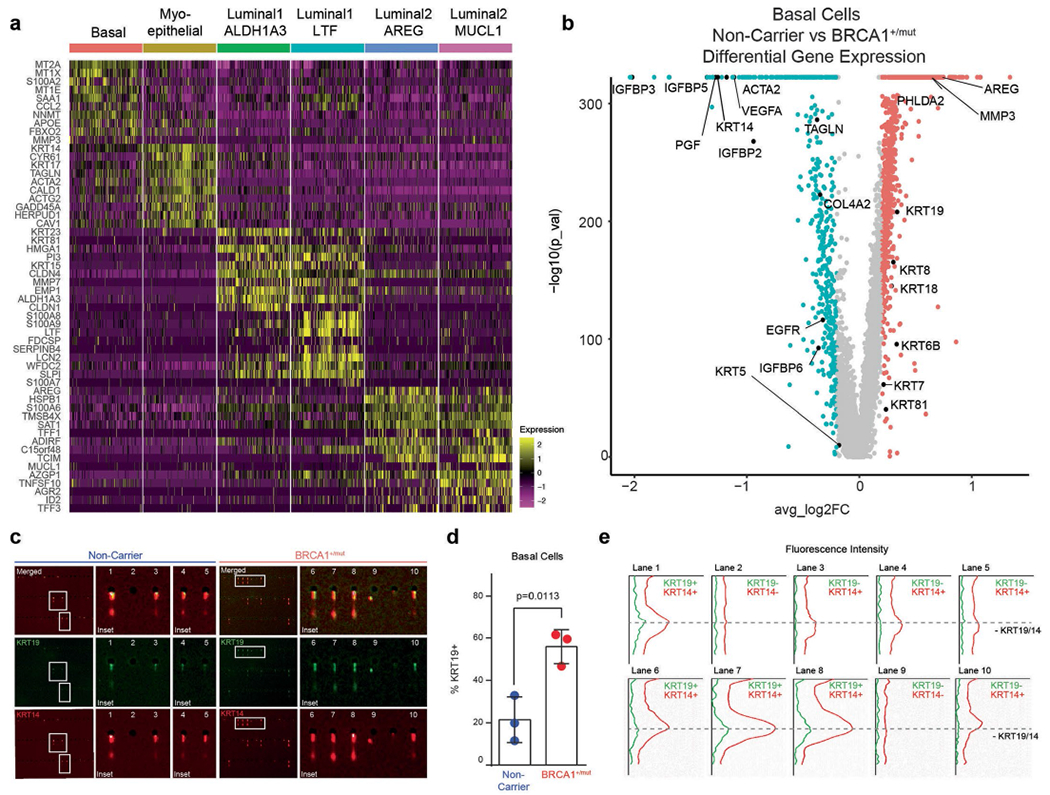
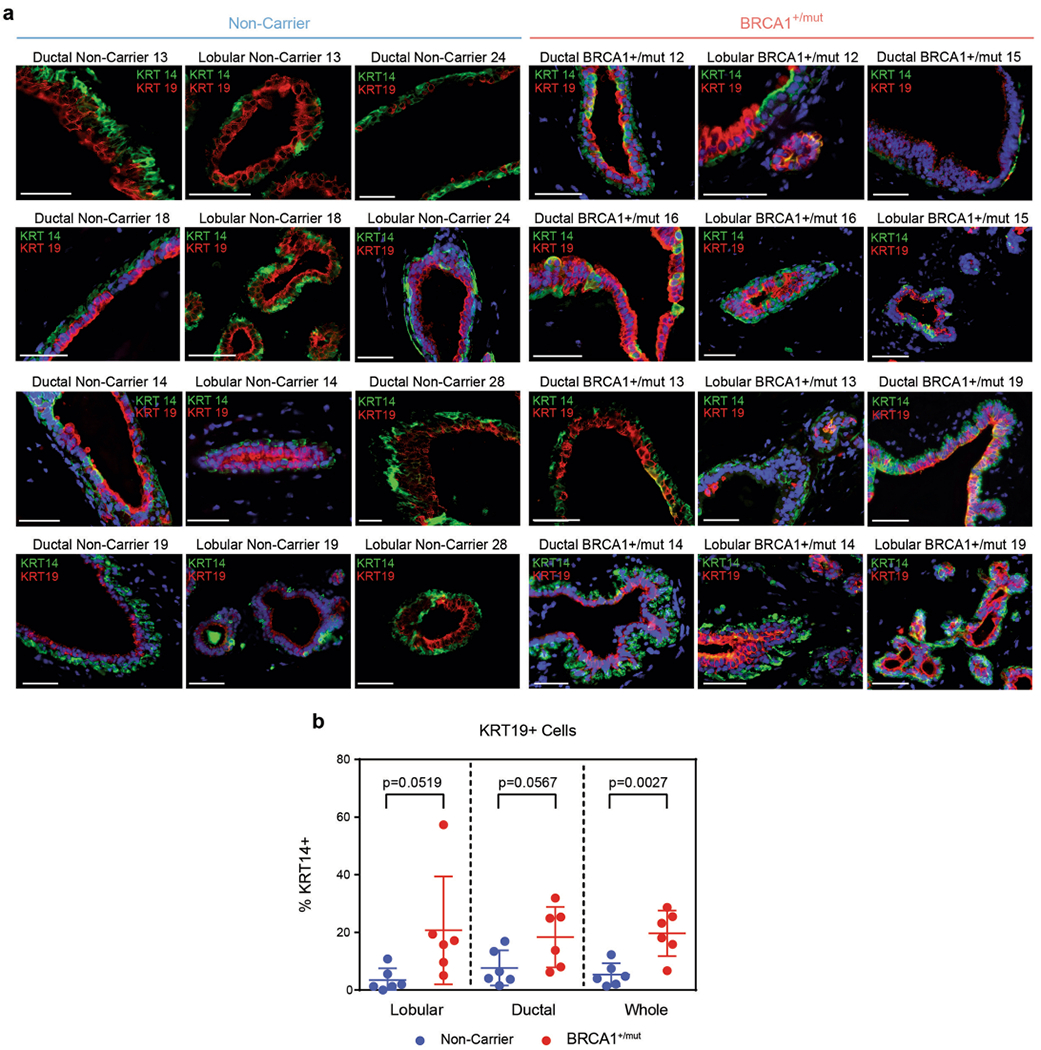
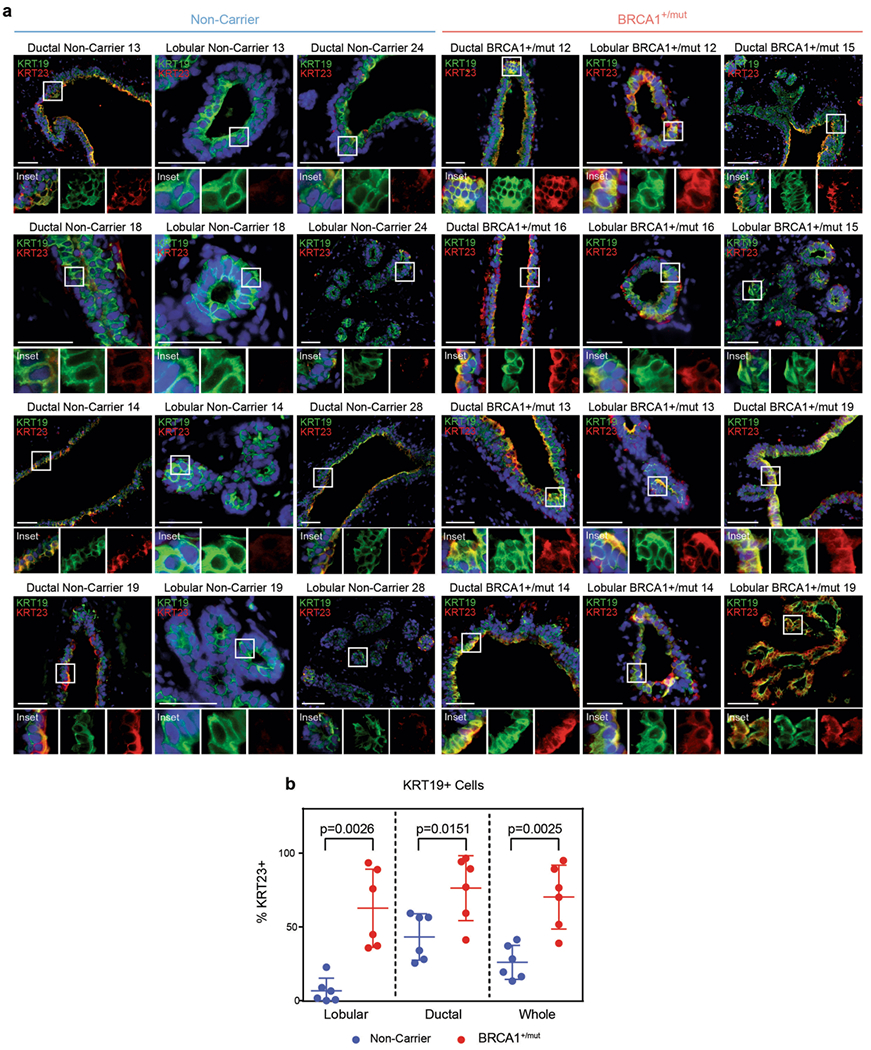
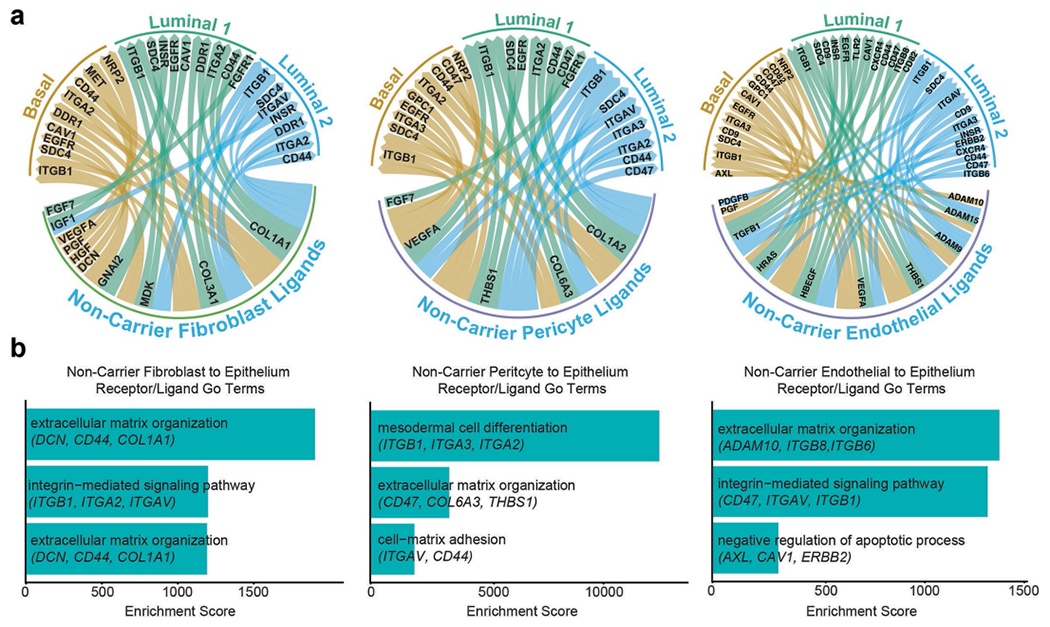
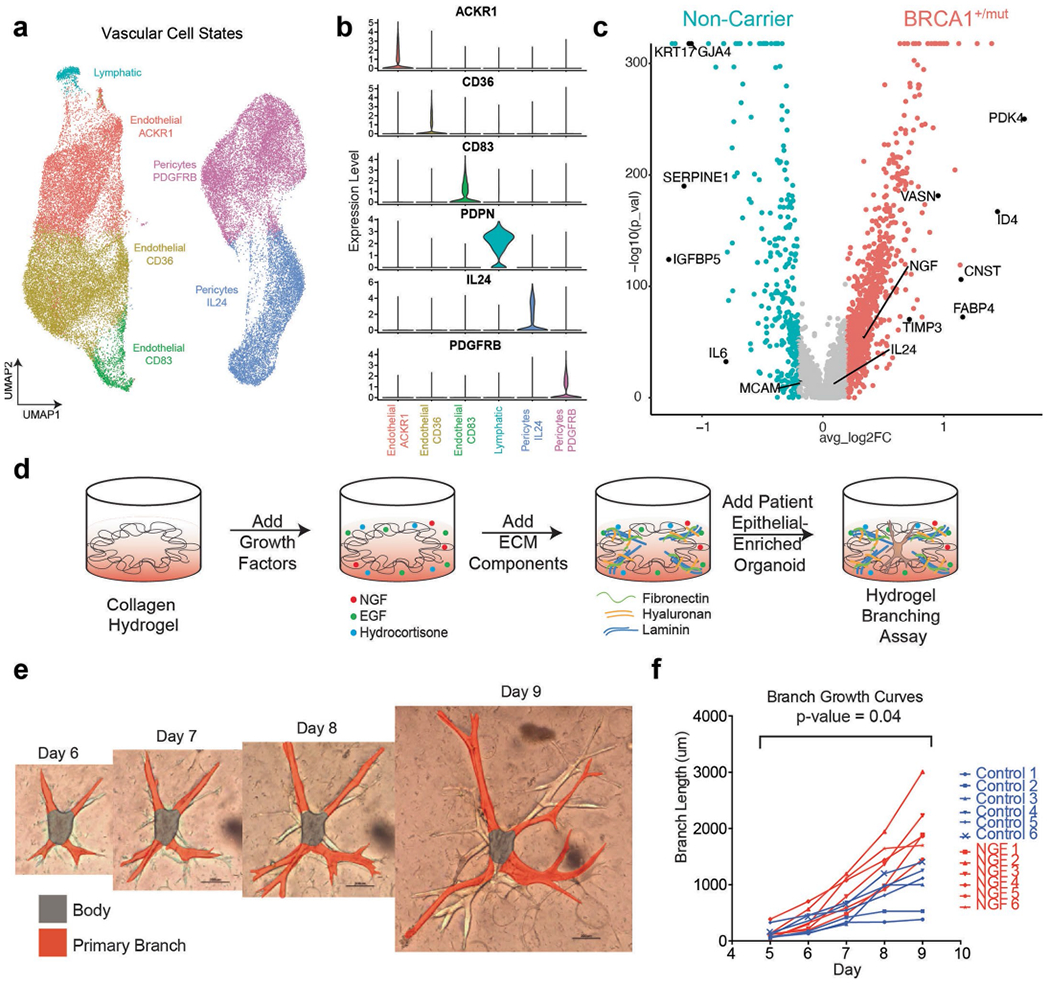
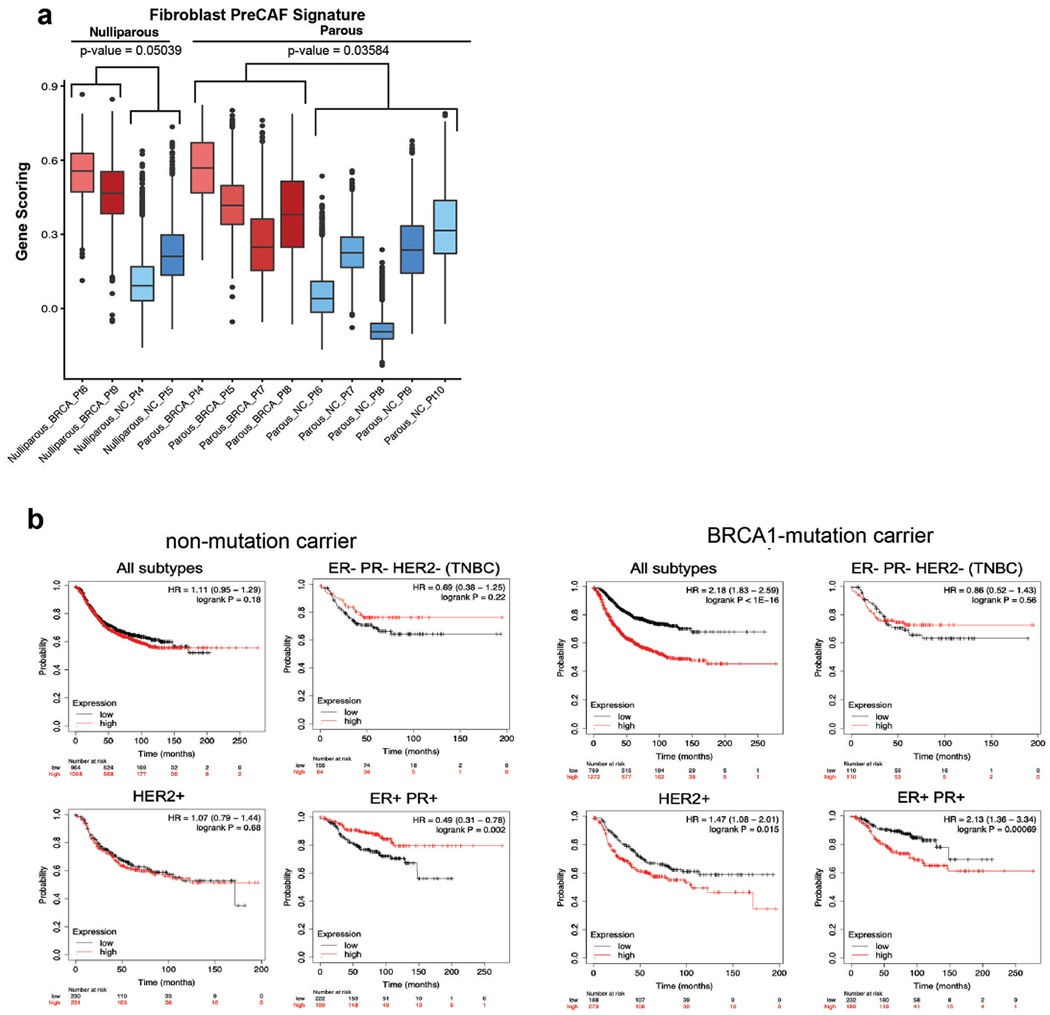
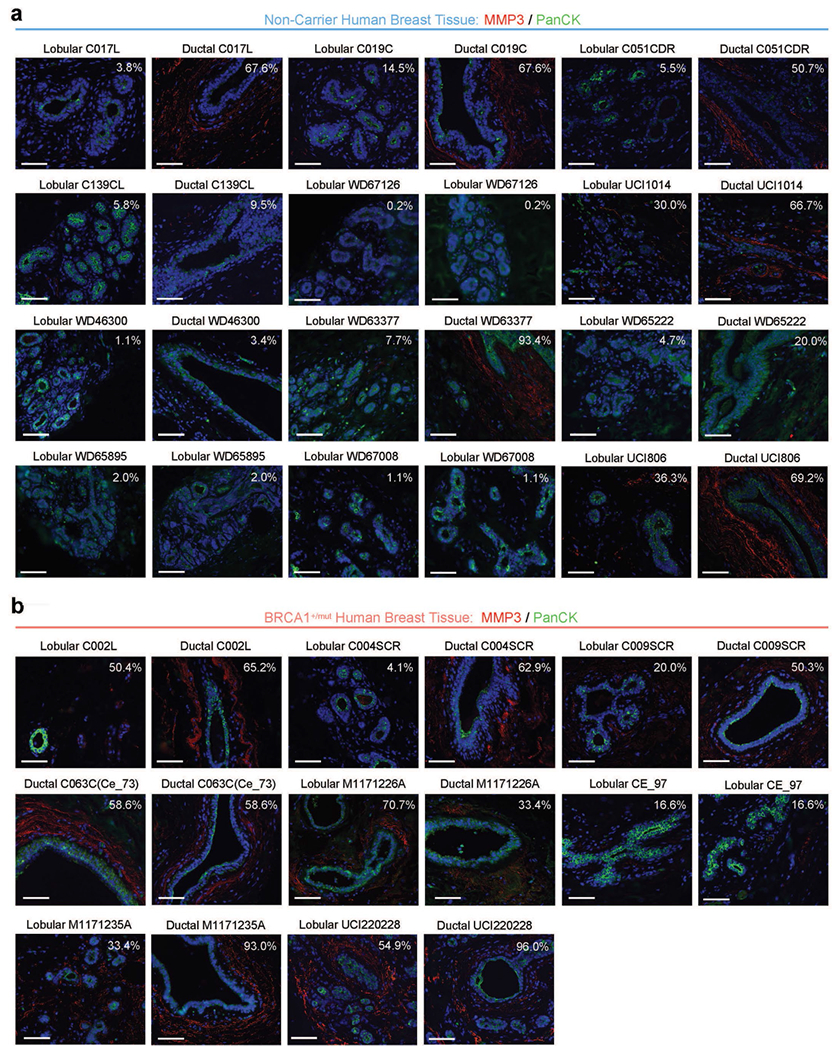
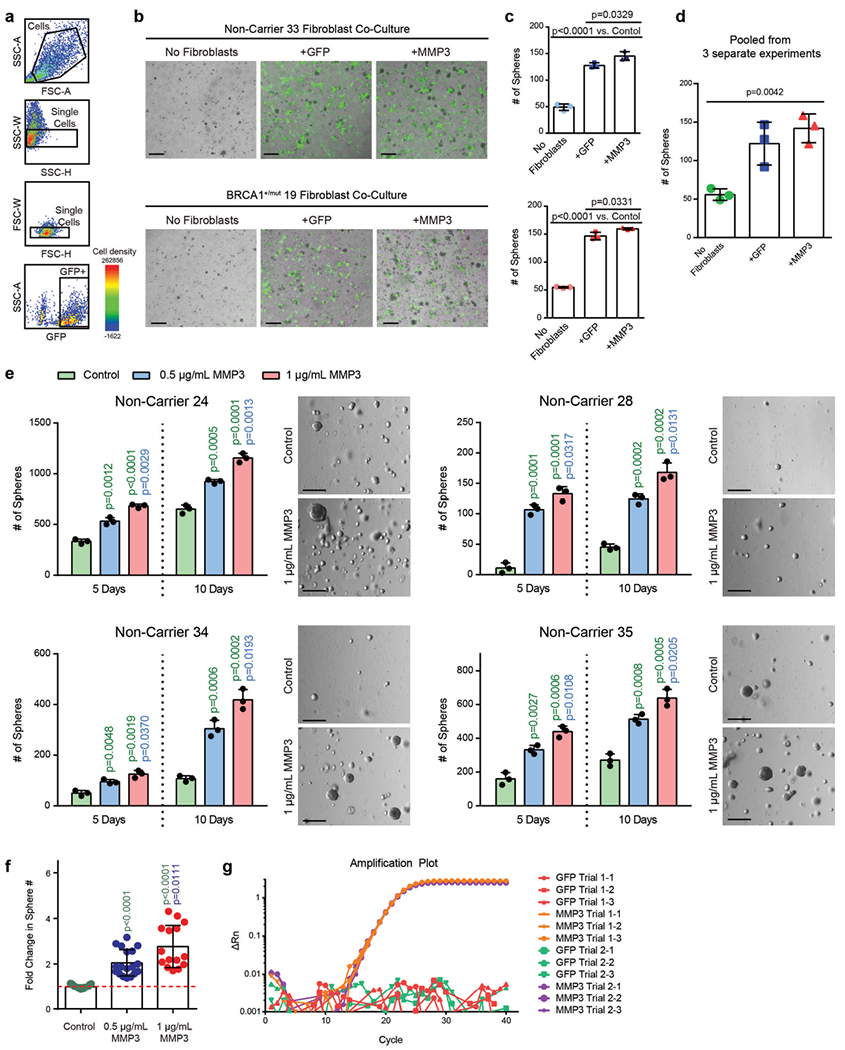
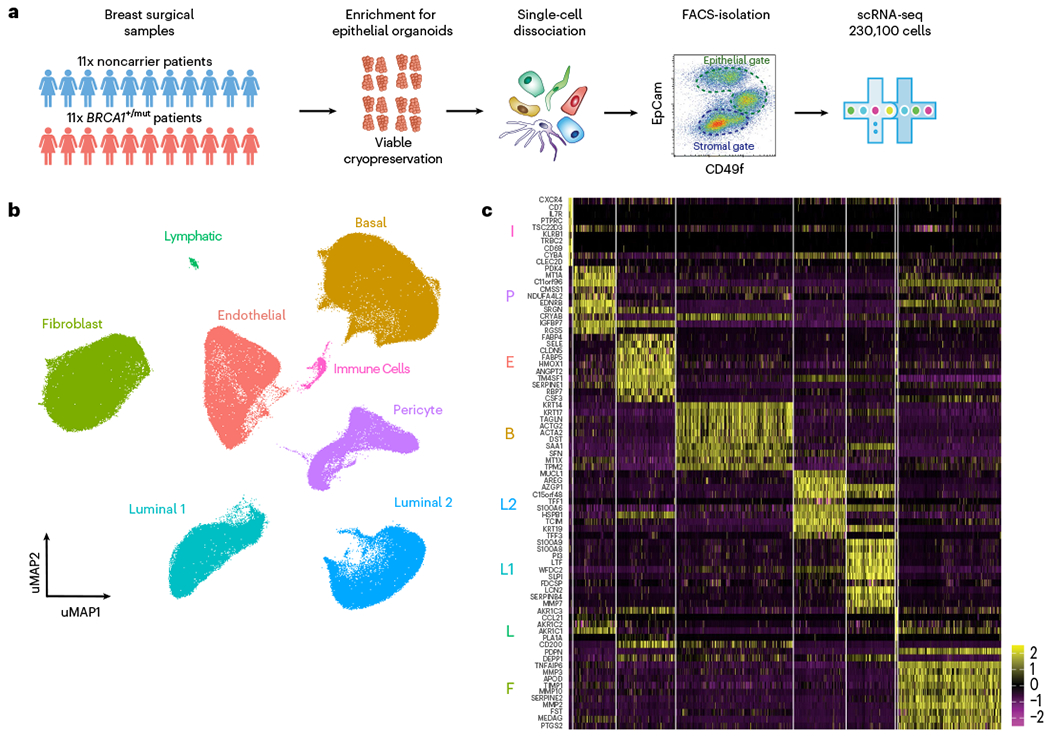
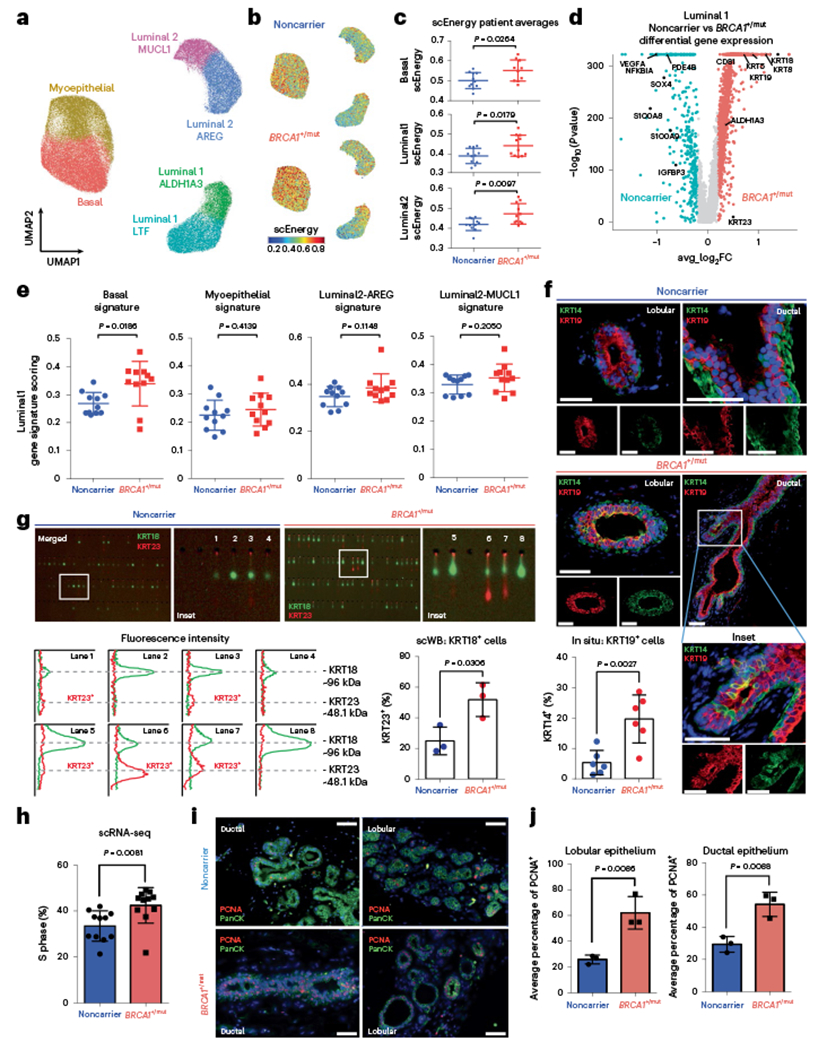
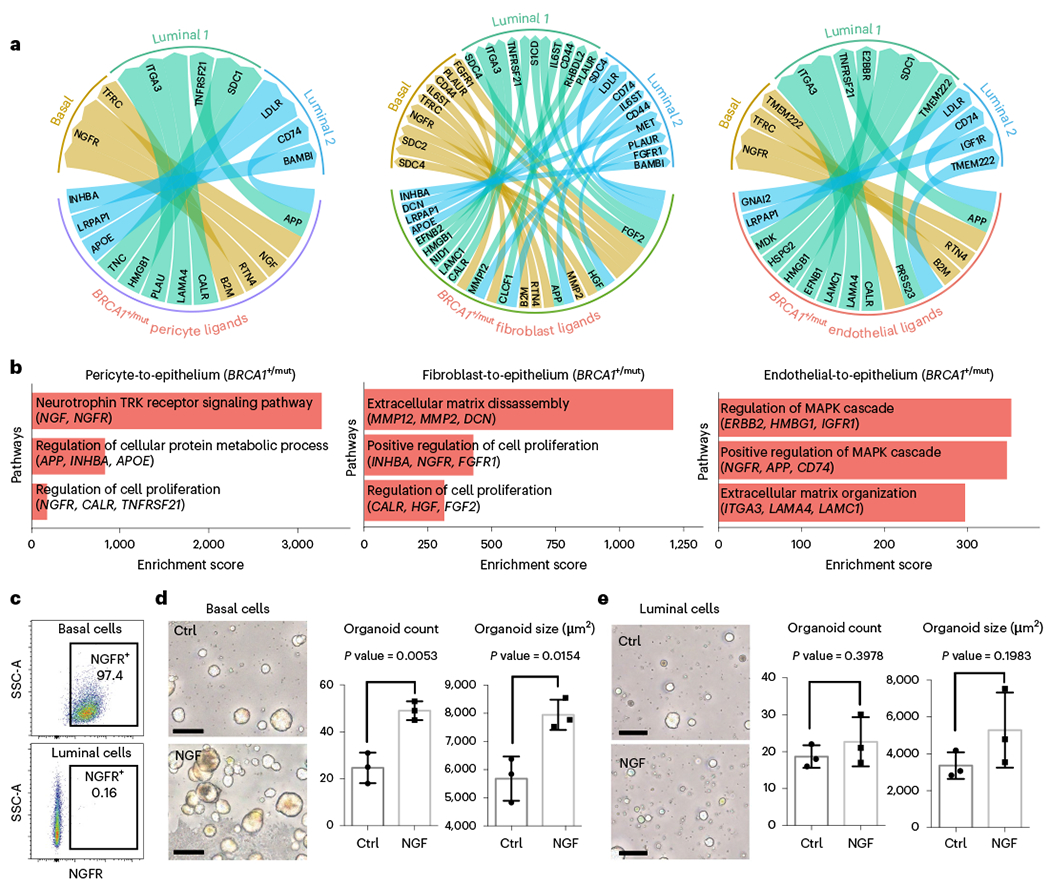
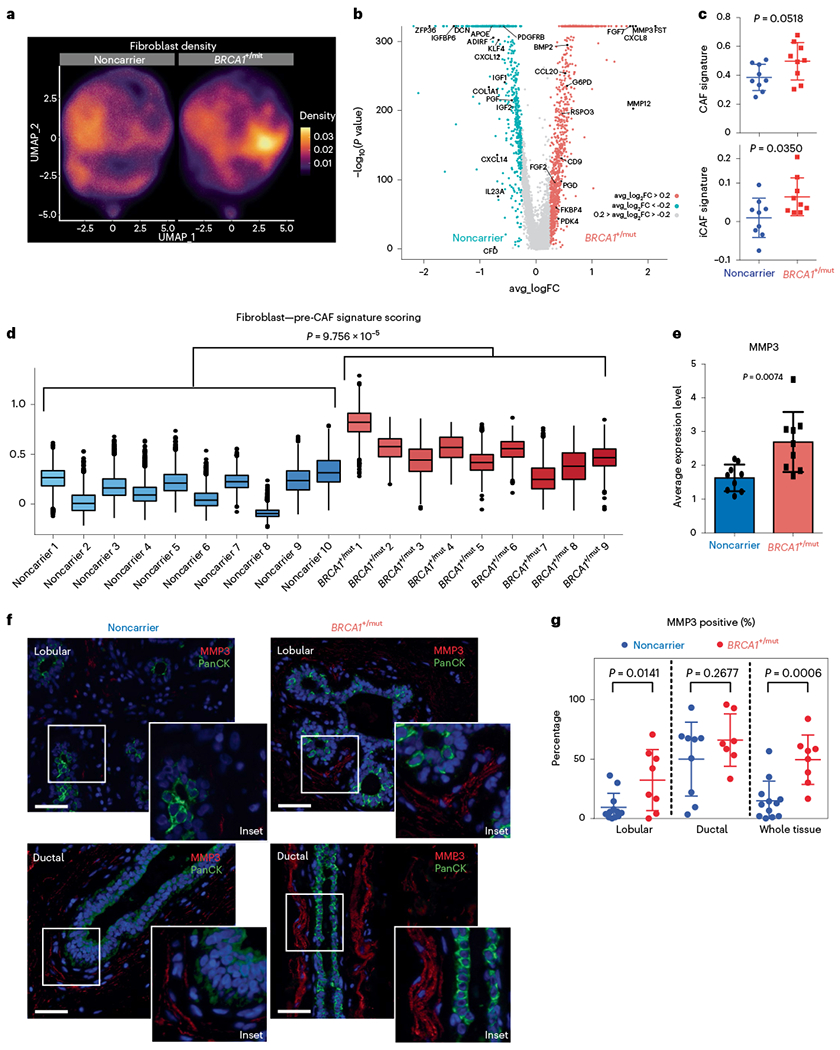
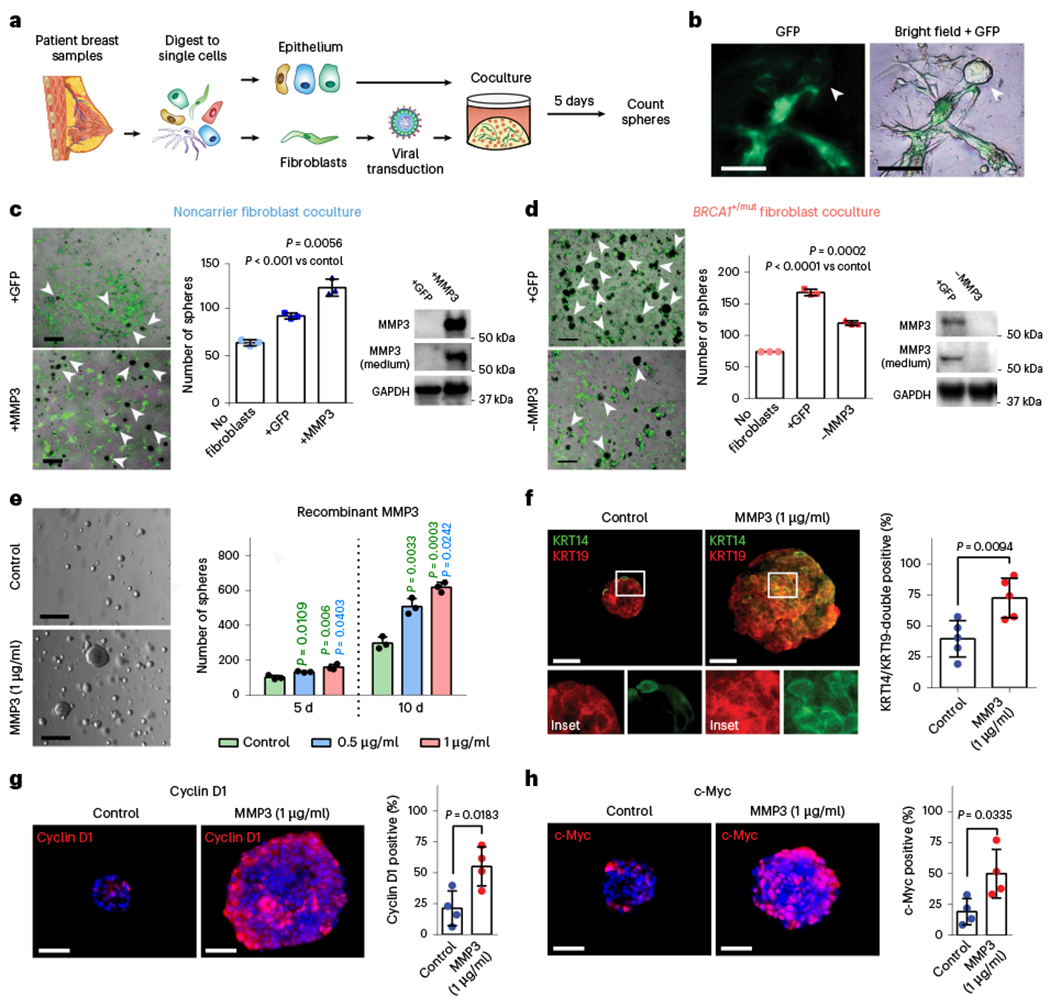
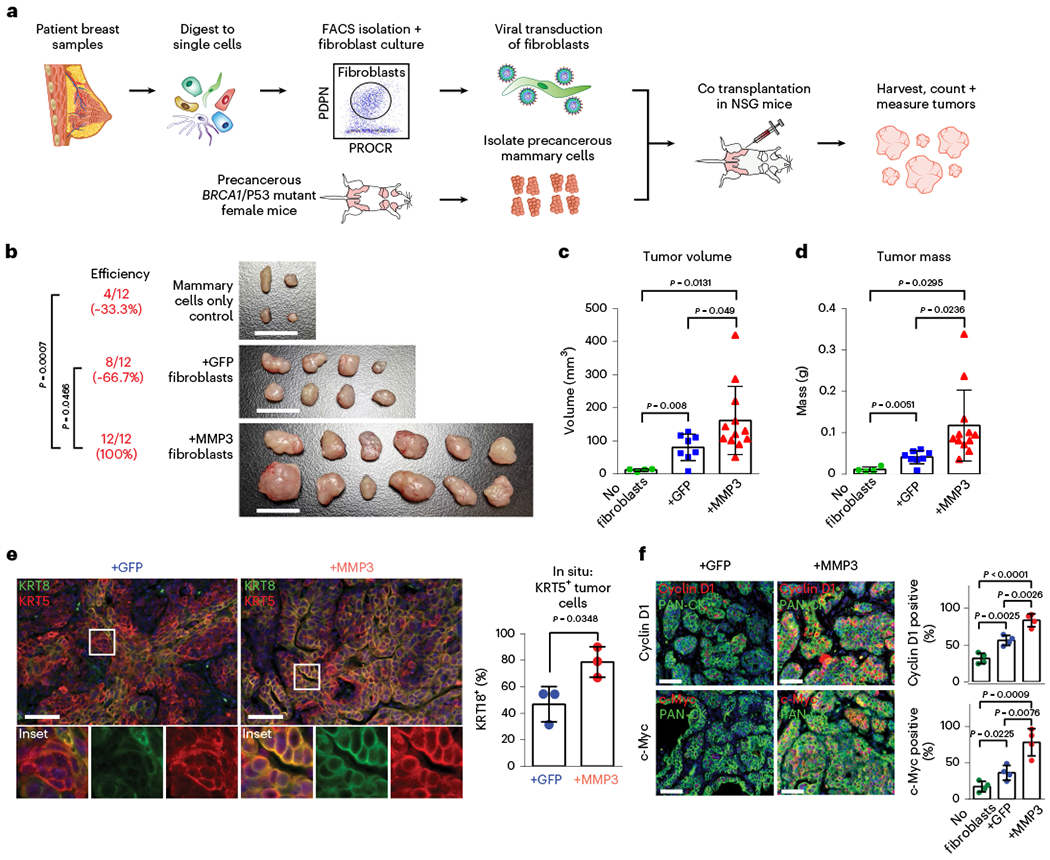
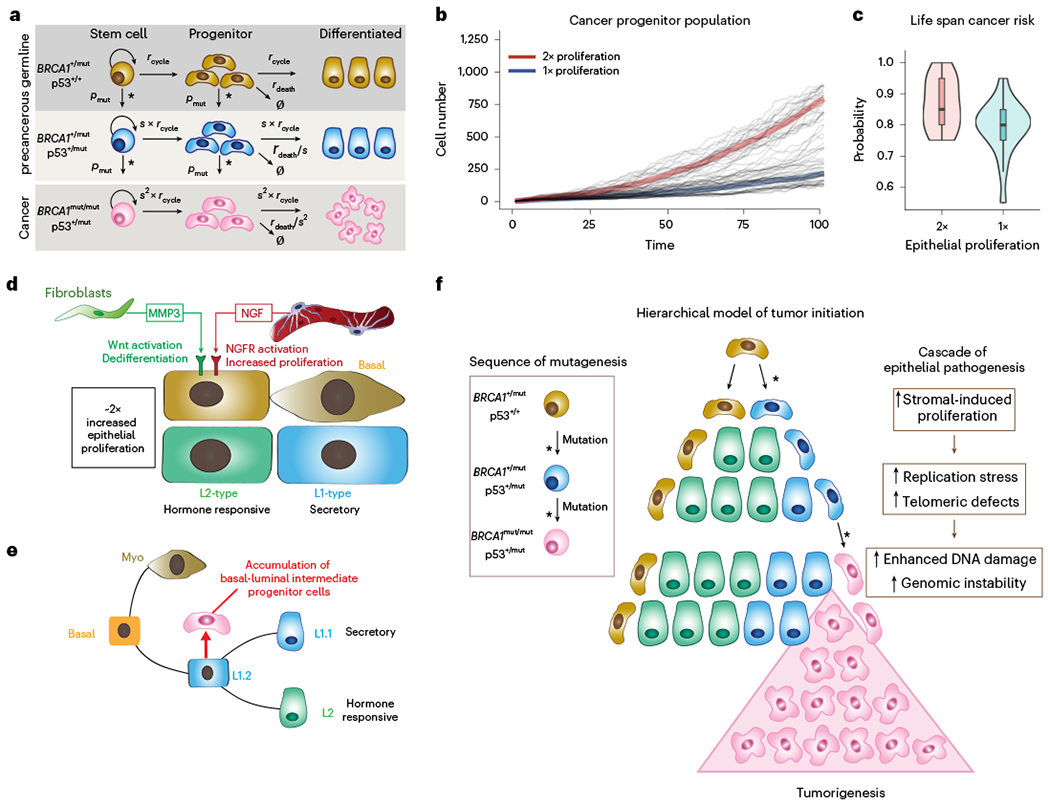
Women with germline BRCA1 mutations (BRCA1+/mut) have increased risk for hereditary breast cancer. Cancer initiation in BRCA1+/mut is associated with premalignant changes in breast epithelium; however, the role of the epithelium-associated stromal niche during BRCA1-driven tumor initiation remains unclear. Here we show that the premalignant stromal niche promotes epithelial proliferation and mutant BRCA1-driven tumorigenesis in trans. Using single-cell RNA sequencing analysis of human preneoplastic BRCA1+/mut and noncarrier breast tissues, we show distinct changes in epithelial homeostasis including increased proliferation and expansion of basal-luminal intermediate progenitor cells. Additionally, BRCA1+/mut stromal cells show increased expression of pro-proliferative paracrine signals. In particular, we identify pre-cancer-associated fibroblasts (pre-CAFs) that produce protumorigenic factors including matrix metalloproteinase 3 (MMP3), which promotes BRCA1-driven tumorigenesis in vivo. Together, our findings demonstrate that precancerous stroma in BRCA1+/mut may elevate breast cancer risk through the promotion of epithelial proliferation and an accumulation of luminal progenitor cells with altered differentiation.


Conflict of interest statement

Competing interests

All the other authors declare no competing interests.

Figures

Extended Data Fig. 1 |
Extended Data Fig. 1 |. Flow cytometry gating strategy and quality control metrics for scRNA-seq analysis of breast tissues.
a) FACS plots showing gating strategy of mammary epithelial cells in forward and side scatter, singlets gate, dead cell (Sytox + ) and lineage (CD31 + , CD45 + ) exclusion gate. FACS plot on the right-hand side shows gating strategy for basal (Epcam + , CD49f-high) and luminal (Epcam-high, CD49f-low) epithelial cells as well as for stromal cells (Epcam-). b) Faceted UMAP projections of n = 22 NonCarrier and BRCA1+/mut patient scRNA-seq libraries. Each faceted UMAP projection represents all cells per individual patient. NC – NonCarrier, BRCA1 – BRCA1 germline mutation carrier. c) Combined UMAP projection of all cells colored by patient. d) Violin plots depicting UMI counts (number of individual molecules interrogated/droplet) (top) and gene counts (number of unique genes detected/droplet) (bottom) of each individual patient scRNA-seq library. e) Stacked bar plots indicating proportions of cell types detected in individual BRCA1+/mut or NonCarrier samples.
Extended Data Fig. 2 |
Extended Data Fig. 2 |. Differential gene expression analysis between fibroblasts and pericytes in the human breast.
a) Heatmap showing expression of top 20 marker genes specifically expressed in fibroblasts and pericytes from scRNA-seq dataset (rows=genes, columns=cells). Yellow represents a positive z-score, purple represents a negative z-score. b) Venn diagram illustrating the number of genes that are mutually or exclusively expressed in fibroblasts and pericytes. Selected marker genes for each category are shown. c) Volcano plot depicting differential gene expression analysis of fibroblasts (green) and pericytes (violet), the Wilcoxon rank sum test is used to determine differentially expressed genes, adjusted p values are determined using the Bonferroni method for multiple testing correction. d) Bar chart showing top 10 GO Terms enriched in all 367 fibroblast-specific genes. e) Bar chart showing top 10 GO Terms enriched in all 217 pericyte-specific genes. f) Dot plot illustrating mRNA expression levels of PDPN and PROCR by fibroblasts and pericytes, respectively. g) FACS plot gated on live cells, singlets, lin-, EpCAM stromal cells showing distinct populations of PDPN + and PROCR + stromal cells. h) Gene expression analysis of FACS-isolated PROCRmid PDPN + stromal cells by qPCR for selected fibroblast-specific genes. Gene expression normalized to GAPDH and relative expression versus PDPN-PROCR + stromal cells from FACS is shown. Each bar graph shows three points (n = 3), each point represents 1 biologically independent patient’s averaged fold change of a technical triplicate (n = 3), Whisker plots represent the mean and the 25th and 75th quantiles. i) Gene expression analysis of FACS-isolated PROCR + PDPN- stromal cells by qPCR for selected pericyte-specific genes. Gene expression normalized to GAPDH and relative expression versus PROCRmidPDPN + stromal cells from FACS is shown. Each bar graph shows three points (n = 3), each point represents 1 biologically independent patient’s averaged fold change of a technical triplicate (n = 3), Whisker plots represent the mean and the 25th and 75th quantiles.
Extended Data Fig. 3 |
Extended Data Fig. 3 |. High-resolution scRNA-seq analysis of BRCA1+/mut epithelial cells shows increase of basal epithelial cells with altered differentiation.
a) Top 10 marker gene heatmap for epithelial cell states in BRCA1+/mut breast tissues. b) Volcano plot showing differentially expressed genes between NonCarrier and BRCA1+/mut basal epithelial cells. P values were determined using the Seurat tobit likelihood-ratio test, the wilcoxon rank sum test is used to determine differentially expressed genes, adjusted p values are determined using the Bonferroni method for multiple testing correction. c) Single-cell western blot (scWB) analyses for KRT14 and KRT19 on FACS-isolated basal epithelial cells from NonCarrier and BRCA1+/mut individuals. Representative regions of scWB chips post electrophoresis and antibody probing. d) Quantification of scWBs of all basal cells analyzed. Data is represented as mean ± SD from at least 1000 cells/individual; NonCarrier n = 3, BRCA1+/mut n = 3. P value was determined with an unpaired two-tailed t-test. e) Relative fluorescence intensity of KRT14 and KRT19 of selected lanes in scWB as indicated in c).
Extended Data Fig. 4 |
Extended Data Fig. 4 |. BRCA1+/mut tissues harbor increased numbers of KRT19 + cells that co-express KRT14.
a) Representative IF staining for KRT14 (green) and KRT19 (red) in human mammary tissues from NonCarrier (n = 6) and BRCA1+/mut (n = 6) individuals. Yellow staining indicates epithelial cells that are KRT14/KRT19-double-positive. Scale bar= 50 μm. b) Bar graph depicting percentages of KRT14/KRT19-double-positive cells in lobular and ductal epithelial regions and whole tissue (lobular + ductal regions) of human mammary tissues from NonCarrier (n = 6) and BRCA1+/mut (n = 6) individuals. Values are represented as mean ± SD from counts of at least 5 different random fields per tissue. P values were determined by unpaired two-tailed t-tests.
Extended Data Fig. 5 |
Extended Data Fig. 5 |. BRCA1+/mut tissues harbor increased numbers of KRT19 + cells that co-express KRT23.
a) Representative immunofluorescence staining for KRT23 (red) and KRT19 (green) in human mammary tissues from NonCarrier (n = 6) and BRCA1+/mut (n = 6) individuals. Yellow staining indicates epithelial cells that are KRT19/KRT23 double-positive. Scale bar = 50 μm. b) Bar graph depicting percentages of KRT19/KRT23 double-positive cells in lobular and ductal regions of epithelial tissues and whole tissue (lobular + ductal regions) of human mammary tissues from NonCarrier (n = 6) and BRCA1+/mut (n = 6) individuals. Values are represented as mean ± SD from counts of at least 5 different random fields per tissue. P values were determined by unpaired two-tailed t-tests.
Extended Data Fig. 6 |
Extended Data Fig. 6 |. Ligand–receptor interaction analysis in NonCarrier breast tissues.
a) Ligand–receptor interactions depicted in Circos plots of ligands expressed by fibroblasts, pericytes or endothelial cells interacting with receptors on epithelial cells in NonCarrier breast tissues. b) Receptor–ligand interaction enrichment scores of GO Terms (GO-Biological Processes 2018) of ligands from NonCarrier fibroblasts (left), pericytes (center), and endothelial cells (right), and epithelial receptors are shown.
Extended Data Fig. 7 |
Extended Data Fig. 7 |. BRCA1+/mut vascular cells express elevated levels of NGF which increases branching morphogenesis.
a) UMAP projection of vascular cell states identifying 3 endothelial cell states, 2 pericyte cell states, and lymphatic cells. b) Violin plots of marker genes with enhanced expression in each vascular cell state cluster. c) Volcano plot showing differentially expressed genes between NonCarrier and BRCA1+/mut pericytes, the Wilcoxon rank sum test is used to determine differentially expressed genes, adjusted p values are determined using the Bonferroni method for multiple testing correction. d) Schematic for the generation of hydrogel branching assays. e) Representative images of a BRCA1+/mut organoid in hydrogel branching assay at days 6-9 after seeding. Scale bars = 200 μm. f) Branch growth curves of n = 6 control and n = 6 NGF (100 ng/ml) treated hydrogel branching assay. P value was calculated using CGGC permutation (two-sided) test.
Extended Data Fig. 8 |
Extended Data Fig. 8 |. Additional analyses of pre-CAF signature by type of BRCA1 mutation, parity status and using Kaplan–Meier survival analysis in breast cancer.
a) Pre-CAF gene signature scoring in fibroblast from nulliparous versus parous NonCarrier and BRCA1+/mut patients. Libraries with representation of less than 250 fibroblasts were excluded. Boxplots indicate median and 25% and 75% quantiles respectively, minima and maxima represent the 10th and 90th percentile respectively, p values were determined by Welch two sample t-test. b) Kaplan–Meier (KM) analyses in breast cancer patients, associating the NonCarrier fibroblast signature (left) or pre-CAF fibroblast signature (right) with overall survival. Auto cutoff was used to group samples into signature low and high. HR hazard ratio. P values were determined by log-rank test. KM plots are shown for breast cancer patients with all subtypes, TNBC (ER-,PR-,HER2-), HER2 + , or ER + PR + breast cancers.
Extended Data Fig. 9 |
Extended Data Fig. 9 |. Additional data from in situ analysis of MMP3-expressing stromal cells in BRCA1+/mut and NonCarrier samples.
a) Additional representative IF images from ductal and lobular regions in NonCarrier breast tissues stained with anti-MMP3 (red) and anti-PanCK (green) antibodies. DAPI staining is shown in blue. Percentages are indicated of stromal cells that are positive for MMP3. Scale bar = 50 μm. b) Additional representative IF images from ductal and lobular regions in BRCA1+/mut breast tissues stained with anti-MMP3 (red) and anti-PanCK (green) antibodies. DAPI staining is shown in blue. Percentages are indicated of stromal cells that are positive for MMP3. Scale bar = 50 μm.
Extended Data Fig. 10 |
Extended Data Fig. 10 |. Fibroblast-derived MMP3 promotes epithelial growth in vitro.
a) FACS plots showing gating strategy for isolation of GFP-transduced human fibroblasts isolated from patient breast tissue in forward and side scatter, singlets gate, and GFP gate. b) Representative images of cocultures after 5 days of seeding. 4000 primary mammary epithelial cells (NonCarrier 32) were cultured alone (No Fibroblasts) or with 1×10⁵ primary mammary fibroblasts (NonCarrier 33 or BRCA1+/mut 19) transduced with lentivirus to express GFP only (+GFP) or GFP and MMP3 ( + MMP3) in Matrigel for 5 days. Fibroblasts are distinguished from epithelial spheres (GFP-negative) with GFP fluorescence. Scale bar = 400 μm. c) Quantification of spheres after 5 days. Values are represented as mean ± SD from 3 separate experiments with 3 triplicate wells per experiment. P values were determined by unpaired two-tailed t-tests. d) Mean values of sphere counts pooled from 3 separate experiments from (c) and Fig. 5c. Values are represented as mean ± SD. Statistical significance between all groups was determined with a one-way ANOVA test. e) 10×105 FACS-isolated epithelial cells from 4 patient samples were seeded in Matrigel and treated with 0.5 μg/mL or 1 μg/mL recombinant MMP3 and spheres were counted after 5 and 10 days. Bar chart values are represented as mean ± SD from triplicates from three separate experiments. P values were determined using unpaired two-tailed t-tests. Representative bright field images of mammospheres after 10 days of culture are shown on the right (scale bar = 400 μm). f) Bar graph depicting fold change in sphere count after 10 days of culture with human recombinant MMP3 compared to control (dotted red line). Values are displayed as mean ± SD from 15 independent experiments (5 different patient samples with 3 separate experiments each). P values were determined using unpaired two-tailed t-tests. g) Primary human breast fibroblasts isolated by FACS from patient sample “NonCarrier 27” were transduced to express mouse MMP3 (mMMP3) and GFP or GFP only. qPCR analysis was performed on transduced fibroblasts in two separate trials with three replicates per group. Amplification plot is shown with the difference in the normalized reporter value of the experimental reaction minus the normalized reporter value generated by the instrument (ΔRn) on the y-axis and the cycle number on the x-axis.
Fig. 1 |
Fig. 1 |. Single-cell transcriptomics analysis of human breast tissues from BRCA1+/mut and noncarriers.
a, Schematic depiction of single-cell analysis workflow using human breast tissue samples that are mechanically and enzymatically dissociated into single-cell suspensions that are subjected to FACS to isolate stromal (EpCAM) and epithelial (EpCAM+) cells for scRNA-seq analysis. b, Integrated clustering analysis of n = 11 noncarrier and n = 11 BRCA1+/mut scRNA-seq dataset in UMAP projection showing the main identified cell types. c, Top ten marker gene heatmap for each cell type identified by scRNA-seq analysis (rows = genes, columns = cells). The corresponding cell types are indicated with letter abbreviations as follows: basal epithelial cells (B), luminal 1 (L1) and luminal 2 (L2) epithelial cells, fibroblasts (F), pericytes (P), endothelial cells (E), lymphatic cells (L) and immune cells (I).
Fig. 2 |
Fig. 2 |. Increased proliferation and accumulation of a luminal epithelial progenitor subset with altered differentiation in BRCA1+/mut breast tissues.
a, Unbiased clustering using UMAP projection of all patient epithelial cells. Cells are labeled by mammary epithelial cell state classification as indicated. b, UMAP feature plots displaying single-cell energy (scEnergy) in faceted plots for noncarrier (upper plot) and BRCA1+/mut cells (lower plot). c, scEnergy distributions are plotted as mean scEnergy values from an individual patient (expressed as mean ± s.e.m.) across basal (noncarrier basal = 0.5009 ± 0.01214, BRCA1+/mut basal = 0.5513 ± 0.01677), luminal 1 (noncarrier luminal 1 = 0.3910 ± 0.01150, BRCA1+/mut luminal 1 = 0.4420 ± 0.01590) and luminal 2 (noncarrier luminal 2 = 0.4150 ± 0.009314, BRCA1+/mut luminal 2 = 0.723 ± 0.01549) cell types from noncarrier and BRCA1+/mut samples. P values were determined by Welch’s two-sample t-test. d, Volcano plot displaying genes differentially expressed between noncarrier and BRCA1+/mut luminal 1 epithelial cells; genes greater than log2FC > 0.25 are colored. The Wilcoxon rank sum test (two sided) is used to determine differentially expressed genes; adjusted P values are determined using the Bonferroni method for multiple testing correction. e, Gene signature scoring of luminal 1 cells from noncarrier and BRCA1+/mut epithelial cells plotted as mean signature score values from individual patients (expressed as mean ± s.e.m.) for basal (noncarrier luminal 1 = 0.2685 ± 0.01195, BRCA1+/mut luminal 1 = 0.3396 ± 0.02406), myoepithelial (noncarrier luminal 1 = 0.2250 ± 0.01616, BRCA1+/mut luminal 1 = 0.3396 ± 0.02406), luminal 2-AREG (noncarrier luminal 1 = 0.3481 ± 0.01287, BRCA1+/mut luminal 1 = 0.3848 ± 0.01801) and luminal 2-MUCL1 (noncarrier luminal 1 = 0.3299 ± 0.01016, BRCA1+/mut luminal 1 = 0.3535 ± 0.01473) marker gene signatures. P values were determined by Welch’s two-sample t-test. f, In situ IF analysis of KRT14/KRT19-double positive cells of lobular and ductal regions in noncarrier and BRCA1+/mut tissues with representative images shown. Scale bar = 50 μm. Bar chart (bottom left) indicates the percentage of KRT14/KRT19-double positive cells in noncarrier (n = 6) and BRCA1+/mut (n = 6). Values are expressed as mean ± s.d. quantified from at least five random fields per patient sample. P value was determined using an unpaired two-tailed t-test. g, Single-cell Western blot (ScWB)-based quantification of KRT23-positive luminal epithelial cells isolated by FACS from noncarrier (n = 3) and BRCA1+/mut (n = 3). Images are representative regions of scWB chips post electrophoresis and antibody probing. Bar chart values are represented as mean ± s.d. from at least 1,000 cells per individual; n = 3 noncarrier, and n = 3 BRCA1+/mut. P value was determined using an unpaired two-tailed t-test. h, Bar chart shows the percentage (expressed as mean ± s.e.m.) of each patient’s noncarrier (0.3346 ± 0.01990, n = 11) and BRCA1+/mut (0.4245 ± 0.2323, n = 11) epithelial cells in S phase as identified by Seurat cell-cycle scoring analysis. P value was calculated by an unpaired two-tailed t-test. i, Representative images from IF analysis of pan-cytokeratin (PanCK, green) and PCNA (red) expression in ductal and lobular regions of noncarrier and BRCA1+/mut breast tissues. Scale bar = 50 μm. j, Bar graphs showing the average percentage (expressed as mean ± s.e.m.) of PCNA + cells in five regions each from noncarrier (n = 3) and BRCA1+/mut (n = 3) patients by in situ IF analysis of lobular (noncarrier = 25.89 ± 1.957, BRCA1+/mut = 62.11 ± 7.286) and ductal (noncarrier = 29.40 ± 2.812, BRCA1+/mut = 54.23 ± 4.366) areas. P values were determined by unpaired two-tailed t-test.
Fig. 3 |
Fig. 3 |. Receptor–ligand interaction analysis reveals increased stromal cell-induced epithelial proliferation in BRCA1+/mut breast tissue.
a, Circos plots showing ligand–receptor interactions enhanced in BRCA1+/mut tissues with ligands expressed by pericytes (left), fibroblasts (center) and endothelial cells (right) and receptors expressed by the three epithelial cell types basal, luminal 1 and luminal 2. b, Enrichment scores of GO terms (GO-Biological Processes 2018) of BRCA1+/mut pericyte (left), fibroblast (center) and endothelial (right) ligands and epithelial receptors are shown. c, Representative FACS plots showing gating for NGFR+ basal (top: gated on EpCAM+, CD49f-high) and luminal cells (bottom: gated on EpCAM-high, CD49f). d, Mammosphere assay using FACS-isolated primary human NGFR+ basal epithelial cells grown in the presence of recombinant NGF (100 ng ml−1) compared to untreated Ctrl. Representative images are shown on the left, and bar charts showing the number (left) and size (right) of mammospheres in each condition. Data are presented as the mean ± s.d.; each point represents one matrigel mammosphere culture (n = 3 Ctrl, n = 3 NGF). P values were determined by unpaired two-tailed t-tests. Scale bars = 50 μm. e, Mammosphere assay using FACS-isolated primary human luminal epithelial cells grown in the presence of recombinant NGF (100 ng ml−1) compared to untreated Ctrl. Representative images are shown on the left, and bar charts showing the number (left) and size (right) of mammospheres in each condition. Data are presented as the mean ± s.d.; each point represents one matrigel mammosphere culture (n = 3 Ctrl, n = 3 NGF). P values were determined by unpaired two-tailed t-tests. Scale bars = 50 μm. Ctrl, control cells.
Fig. 4 |
Fig. 4 |. Expansion of CAF-like, MMP3-expressing fibroblasts in premalignant BRCA1+/mut breast tissues.
a, UMAP projection of cell density in noncarrier and BRCA1+/mut fibroblasts. b, Volcano plot with all differentially expressed genes between noncarrier and BRCA1+/mut fibroblasts. The Wilcoxon rank sum test is used to determine differentially expressed genes. Adjusted P values are determined using the Bonferroni method for multiple testing correction. Top 50 BRCA1+/mut genes were used to define pre-CAF signature. Top 50 noncarrier genes were used to define noncarrier fibroblast signature. c, Gene signature scoring of all noncarrier (n = 9 patients) and BRCA1+/mut (n = 9 patients) fibroblasts CAF and iCAF signatures. Each point represents the average score from one patient’s fibroblasts. Data are presented as the mean ± s.d. P values were determined by Welch’s two-sample t-tests. Patient scRNA-seq libraries with less than ~250 fibroblasts (<10% of mean number of fibroblasts) were excluded. d, Pre-CAF gene signature scoring in fibroblasts from individual patients. Patient scRNA-seq libraries with less than ~250 fibroblasts (<10% of mean number of fibroblasts) were excluded. Boxplots indicate median and 25 and 75% quantiles, respectively; minima and maxima represent the 10th and 90th percentile, respectively. P value was determined by Welch two-sample t-test comparing mean pre-CAF signature scores between noncarrier and BRCA1+/mut patients. e, Bar chart of the average MMP3 expression in noncarrier (n = 9 patients) and BRCA1+/mut (n = 9 patients) fibroblasts. Each point represents the average score from one patient’s fibroblasts, data are presented as the mean ± s.d. P values were determined by Welch’s two-sample t-test. f, Representative images of in situ IF analysis of MMP3 (red) and PanCK (green) expression in lobular and ductal regions of breast epithelium from noncarrier and BRCA1+/mut human tissue sections. Scale bar = 50 μm. DAPI signal is shown in blue. g, Percentages of MMP3-positive stromal cells in noncarrier (blue) and BRCA1+/mut (red) samples as manually quantified from IF images. PanCK-positive epithelial cells were excluded from counts. Values are expressed as mean ± s.d. quantified from at least five random fields per patient sample. P value was determined using an unpaired two-tailed t-test.
Fig. 5 |
Fig. 5 |. MMP3-expressing pre-CAFs promote breast epithelial proliferation and altered differentiation in primary human cocultures in vitro.
a, Schematic depicting experimental set-up for sphere assays of primary human 3D coculture using FACS-isolated epithelial cells and lentivirally transduced fibroblasts. b, Representative images depicting green fluorescent protein (GFP) expression in transduced fibroblasts in close proximity to epithelial organoids (arrow). Scale bar = 100 μm. c, Cocultures (5 d) of 4,000 breast epithelial cells seeded alone (no fibroblasts) or with 1 × 10⁵ noncarrier fibroblasts transduced with lentivirus (+GFP) or transduced to express MMP3 and GFP (+MMP3). Western blots show increased expression of MMP3 in cells and cultured supernatant of +MMP3 fibroblasts. Representative merged bright-field and GFP images of cocultures (scale bar = 400 μm) with arrows indicating epithelial mammospheres (GFP-negative). Bar charts (right) represent the number of mammospheres per well; values expressed as mean ± s.d. from three separate experiments with three triplicate wells from each. P values were determined using unpaired two-tailed t-tests. No fibroblasts versus +GFP, P = 0.0004; no fibroblasts versus +MMP3, P = 0.0005. d, Cocultures (5 d) of 4,000 breast epithelial cells seeded alone (No fibroblasts) or with 1 × 10⁵ BRCA1+/mut fibroblasts transduced with lentivirus to express CRISPR–Cas9 and MMP3 gRNA (−MMP3) and GFP or GFP only (+GFP) vectors. Western blots show decreased expression of MMP3 in cells and medium from MMP3-deficient fibroblast cultures. Representative overlay bright-field and GFP images of cocultures (scale bar = 400 μm) with arrows indicating mammospheres (GFP-negative). Bar charts (right) represent the number of mammospheres per well; values expressed as mean ± s.d. from triplicates of three independent experiments. P values were determined using unpaired two-tailed t-tests. e, 1 × 10⁵ FACS-isolated epithelial cells from patient sample ‘noncarrier 36’ were seeded in Matrigel and treated with 0.5 μg ml−1 or 1 μg ml−1 recombinant MMP3 and spheres were counted after 5 d and 10 d. Representative bright-field images of mammospheres after 10 d of culture (scale bar = 400 μm). Bar chart depicts mean ± s.d. from triplicates of three independent experiments. P values were determined using unpaired two-tailed t-tests. f, 1 × 10⁴ primary breast epithelial cells were seeded and cultured in Matrigel for 10 d with or without human recombinant MMP3. After 10 d, mammospheres were collected and subjected to IF staining for basal (KRT14; green) and luminal (KRT19; red) markers. Representative fluorescence images of mammospheres are shown. Scale bar = 50 μm. Bar chart shows the percentage of KRT14/KRT19-double positive cells. Data are presented as mean ± s.d. from four different patient epithelial cell donors per group (n = 4), with five random fields quantified per sample. P values were determined by unpaired two-tailed t-tests. g, IF staining for Cyclin D1 (red) of organoids with and without exogenous MMP3 after 10 d of mammosphere culture. DAPI staining is shown in blue. Representative fluorescence images of mammospheres are shown. Scale bar = 50 μm. Bar chart shows the percentage of Cyclin D1-positive cells. Data are presented as mean ± s.d. from four different patient epithelial cell donors per group (n = 4), with five random fields quantified per sample. P values were determined by unpaired two-tailed t-tests. h, IF staining for c-Myc (red) of organoids with and without exogenous MMP3 after 10 d of mammosphere culture. DAPI staining is shown in blue. Representative fluorescence images of mammospheres are shown. Scale bar = 50 μm. Bar chart shows the percentage of c-Myc-positive cells. Data are presented as mean ± s.d. from four different patient epithelial cell donors per group (n = 5), with five random fields quantified per sample. P values were determined by unpaired two-tailed t-tests.
Fig. 6 |
Fig. 6 |. MMP3-expressing fibroblasts promote mutant BRCA1-driven breast cancer initiation in vivo.
a, Schematic of mouse model to evaluate the effects of pre-CAFs on mutant BRCA1-mediated breast tumorigenesis in vivo. b, Images of dissected tumors after 6 weeks of growth with reported tumor formation efficiencies. Scale bar = 1 cm. P values were determined using one-sided Fisher’s exact test. c, Volumes of dissected tumors. Values are represented as mean ± s.d. No fibroblasts n = 4; +GFP n = 8, +MMP3 n = 12. P values were determined using unpaired two-tailed t-tests. d, Masses of dissected tumors. Values are represented as mean ± s.d. No fibroblasts n = 4; +GFP n = 8, +MMP3 n = 12. P values were determined using unpaired two-tailed t-tests. e, IF analysis of mouse tumor tissues from samples cotransplanted with control (+GFP) or MMP3-overexpressing fibroblasts (+MMP3) probed antibodies against basal (KRT5; red) and luminal (KRT8; green) markers. Representative images are shown. Scale bar = 50 μm. Bar chart shows the percentage of KRT5/KRT8-double positive cells quantified in five random fields of view from three tumor samples each (dots on bar chart). P values were determined using unpaired two-tailed t-tests. f, IF analysis for Cyclin D1 (top panel) and c-Myc (bottom panel) in mouse tumor tissues from samples cotransplanted with control (+GFP) or MMP3-overexpressing fibroblasts (+MMP3) probed with antibodies against basal (KRT5; red) and luminal (KRT8; green) markers. Representative images are shown. Scale bar = 50 μm. Bar chart shows the percentage of KRT5/KRT8-double positive cells quantified in five random fields of view from three tumor samples each (dots on bar chart). P values were determined using unpaired two-tailed t-tests.
Fig. 7 |
Fig. 7 |. Mathematical modeling predicts that stromal cell-induced epithelial proliferation leads to increased lifetime breast cancer risk in BRCA1+/mut.
a, Schematic model illustrating the assumptions and parameters used to simulate the sequential mutations in oncogenes in BRCA1+/mut cells. rcycle is the baseline cell division rate, rdeath is the cell date rate, s is the proliferation scale factor and pmut is the probability of acquiring a variant in a driver oncogene. Parameters are further defined in Supplementary Table 17. b, Comparison between cancer progenitor population dynamics as predicted by a hierarchical model. Thick lines: Average population dynamics of proliferation in a population with a twofold increase in proliferation and control group (blue). Gray thin lines: The stochastic simulation trajectories (sample n = 50 for each group). c, Comparison of predicted risk ratio of cancer initiation between twofold (red) and onefold epithelial proliferation rate (blue) over human lifespan. The samples are collected from the simulation of n = 40 patients in two groups, with the risk ratio of each patient estimated from n = 20 simulations of a random mutation model. Violin plots show the distribution of risk ratios over n = 20 patients in each group, and boxplots indicate median and 25 and 75% quantiles, respectively; minima and maxima represent the 10th and 90th percentile, respectively. Wilcoxon test: P = 0.011. d, Schematic illustrating the concept of a pro-proliferative stromal niche in preneoplastic BRCA1+/mut breast tissues. BRCA1+/mut stromal cells express increased levels of pro-proliferative cues including NGF in pericytes and protumorigenic MMP3 in fibroblasts. e, We propose that stromal cues act in concert during the preneoplastic phase to promote the expansion of a subset of basal-luminal intermediate progenitor cells as potential cancer cells of origin. f, Concept illustration of hierarchical model of cancer initiation in BRCA1+/mut. Sequences of mutations are indicated in differently colored cells in box on the left; an asterisk represents a mutagenic event. Center schematic summarizes the outcome of mathematical modeling results, indicating expansion of cancer progenitors and ultimately leading to tumorigenesis. Cascade of epithelial cell-intrinsic events promoting tumorigenesis in BRCA1+/mut is shown on the right. Due to increased stromal cell-induced proliferation and replication stress, BRCA1+/mut breast epithelial stem cells accumulate mutations and become genomically instable, which ultimately drives tumor initiation.

Comment in

References

    1. Nguyen QH et al. Profiling human breast epithelial cells using single cell RNA sequencing identifies cell diversity. Nat. Commun 9, 2028 (2018). - PMC - PubMed
    1. Gray GK et al. A human breast atlas integrating single-cell proteomics and transcriptomics. Dev. Cell 57, 1400–1420 (2022). - PMC - PubMed
    1. Pal B et al. A single-cell RNA expression atlas of normal, preneoplastic and tumorigenic states in the human breast. EMBO J. 40, e107333 (2021). - PMC - PubMed
    1. Murrow LM et al. Mapping hormone-regulated cell-cell interaction networks in the human breast at single-cell resolution. Cell Syst. 13, 644–664 (2022). - PMC - PubMed
    1. Wooster R & Weber BL Breast and ovarian cancer. N. Engl. J. Med 348, 2339–2347 (2003). - PubMed

Publication types