Meta-Analysis
. 2023 Mar;55(3):423-436.
doi: 10.1038/s41588-023-01323-z. Epub 2023 Mar 13.

The genetic basis of endometriosis and comorbidity with other pain and inflammatory conditions

Nilufer Rahmioglu  1   2 Sally Mortlock  3 Marzieh Ghiasi  4 Peter L Møller  5 Lilja Stefansdottir  6 Geneviève Galarneau  7 Constance Turman  8 Rebecca Danning  9 Matthew H Law  10   11 Yadav Sapkota  12 Paraskevi Christofidou  13 Sini Skarp  14 Ayush Giri  15 Karina Banasik  16 Michal Krassowski  17   18 Maarja Lepamets  19 Błażej Marciniak  20 Margit Nõukas  19 Danielle Perro  18 Eeva Sliz  21   22 Marta Sobalska-Kwapis  20 Gudmar Thorleifsson  6 Nura F Topbas-Selcuki  18 Allison Vitonis  23   24 David Westergaard  16 Ragnheidur Arnadottir  25 Kristoffer S Burgdorf  26 Archie Campbell  27 Cecilia S K Cheuk  17   18 Caterina Clementi  7 James Cook  28 Immaculata De Vivo  8 Amy DiVasta  23   29 O Dorien  30   31 Jacqueline F Donoghue  32 Todd Edwards  15 Pierre Fontanillas  33 Jenny N Fung  3 Reynir T Geirsson  25 Jane E Girling  32   34 Paivi Harkki  35 Holly R Harris  36 Martin Healey  32 Oskari Heikinheimo  35 Sarah Holdsworth-Carson  32 Isabel C Hostettler  37   38   39 Henry Houlden  38 Sahar Houshdaran  40 Juan C Irwin  40 Marjo-Riitta Jarvelin  12   21   41   42 Yoichiro Kamatani  43 Stephen H Kennedy  18 Ewa Kepka  20 Johannes Kettunen  21   22   44 Michiaki Kubo  43 Bartosz Kulig  45 Venla Kurra  46   47 Hannele Laivuori  46   47   48   49 Marc R Laufer  23   29   50   51 Cecilia M Lindgren  17   18   52 Stuart MacGregor  10   53 Massimo Mangino  13   54 Nicholas G Martin  55 Charoula Matalliotaki  56 Michail Matalliotakis  56 Alison D Murray  57 Anne Ndungu  17   18 Camran Nezhat  58 Catherine M Olsen  59 Jessica Opoku-Anane  40 Sandosh Padmanabhan  60 Manish Paranjpe  61 Maire Peters  62   63 Grzegorz Polak  64 David J Porteous  27 Joseph Rabban  65 Kathyrn M Rexrode  66   67 Hanna Romanowicz  68 Merli Saare  62   63 Liisu Saavalainen  35 Andrew J Schork  69   70   71 Sushmita Sen  40 Amy L Shafrir  23   29 Anna Siewierska-Górska  21 Marcin Słomka  21 Blair H Smith  72 Beata Smolarz  68 Tomasz Szaflik  45 Krzysztof Szyłło  45 Atsushi Takahashi  43   73 Kathryn L Terry  8   23   24 Carla Tomassetti  30   31 Susan A Treloar  55 Arne Vanhie  30   31 Katy Vincent  18 Kim C Vo  40 David J Werring  37 Eleftheria Zeggini  74   75   76 Maria I Zervou  77 DBDS Genomic ConsortiumFinnGen StudyFinnGen Endometriosis TaskforceCelmatix Research Team23andMe Research TeamSosuke Adachi  78 Julie E Buring  9   67 Paul M Ridker  9   67 Thomas D'Hooghe  31   79   80 George N Goulielmos  77 Dharani K Hapangama  81 Caroline Hayward  82 Andrew W Horne  83 Siew-Kee Low  84 Hannu Martikainen  85   86   87 Daniel I Chasman  9   67 Peter A W Rogers  32 Philippa T Saunders  88 Marina Sirota  61   89 Tim Spector  13 Dominik Strapagiel  20 Joyce Y Tung  33 David C Whiteman  59 Linda C Giudice  40 Digna R Velez-Edwards  15 Outi Uimari  85   86   87 Peter Kraft  8   90 Andres Salumets  19   62   63   91 Dale R Nyholt  55   92 Reedik Mägi  19 Kari Stefansson  6   93 Christian M Becker  18 Piraye Yurttas-Beim  7 Valgerdur Steinthorsdottir  6 Mette Nyegaard  5   94 Stacey A Missmer  8   23   29   95 Grant W Montgomery  3 Andrew P Morris  96 Krina T Zondervan  97   98
Collaborators, Affiliations
Meta-Analysis

The genetic basis of endometriosis and comorbidity with other pain and inflammatory conditions

Nilufer Rahmioglu et al. Nat Genet. 2023 Mar.

Abstract

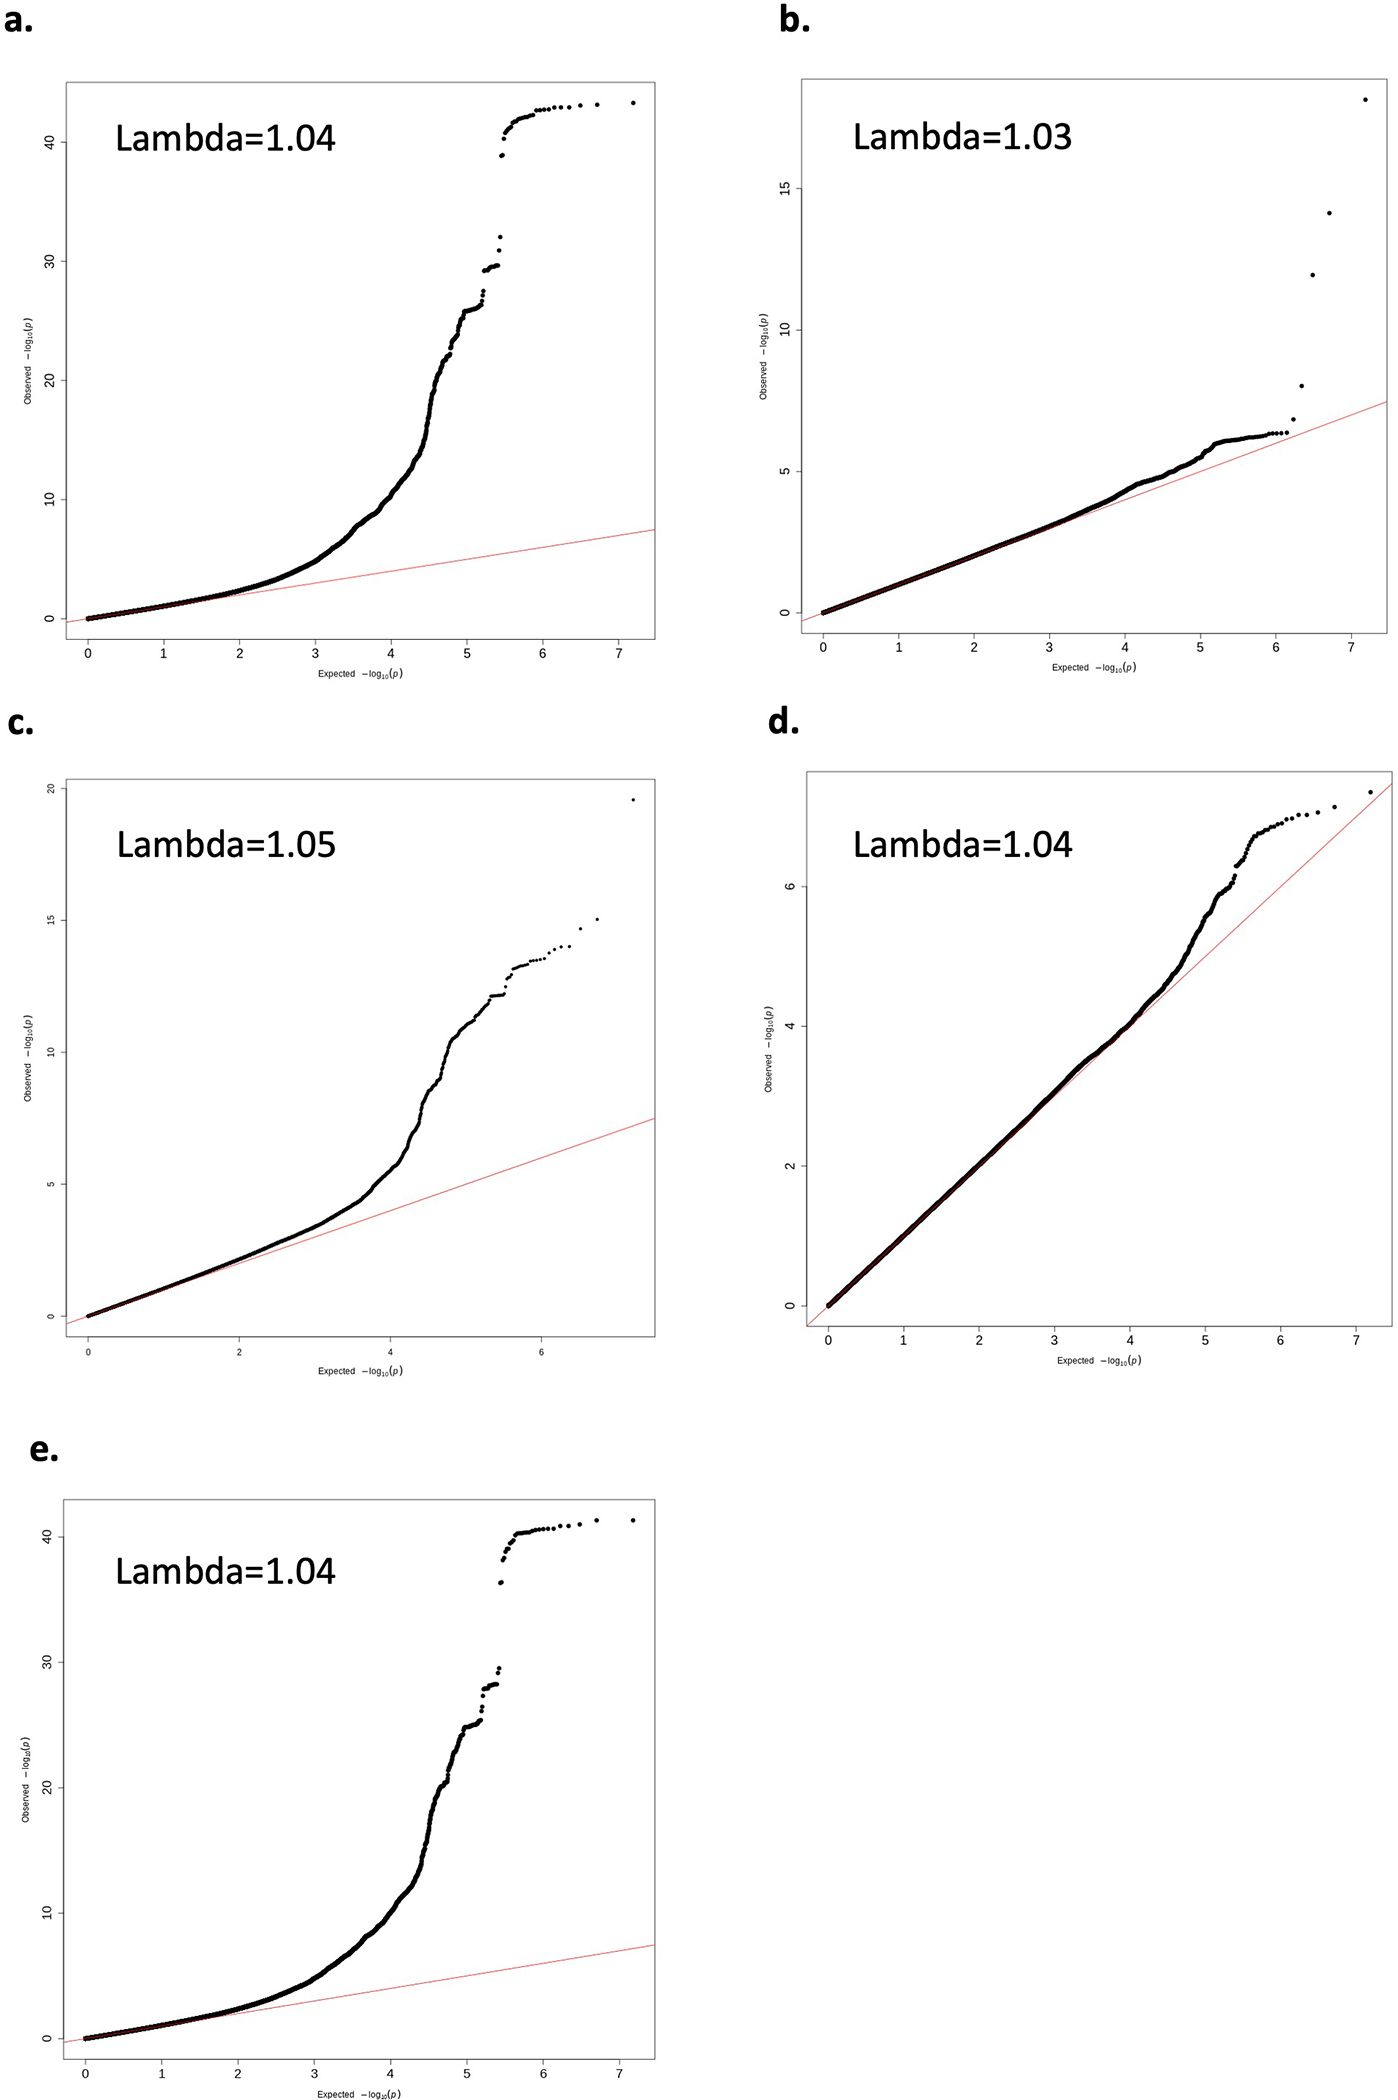
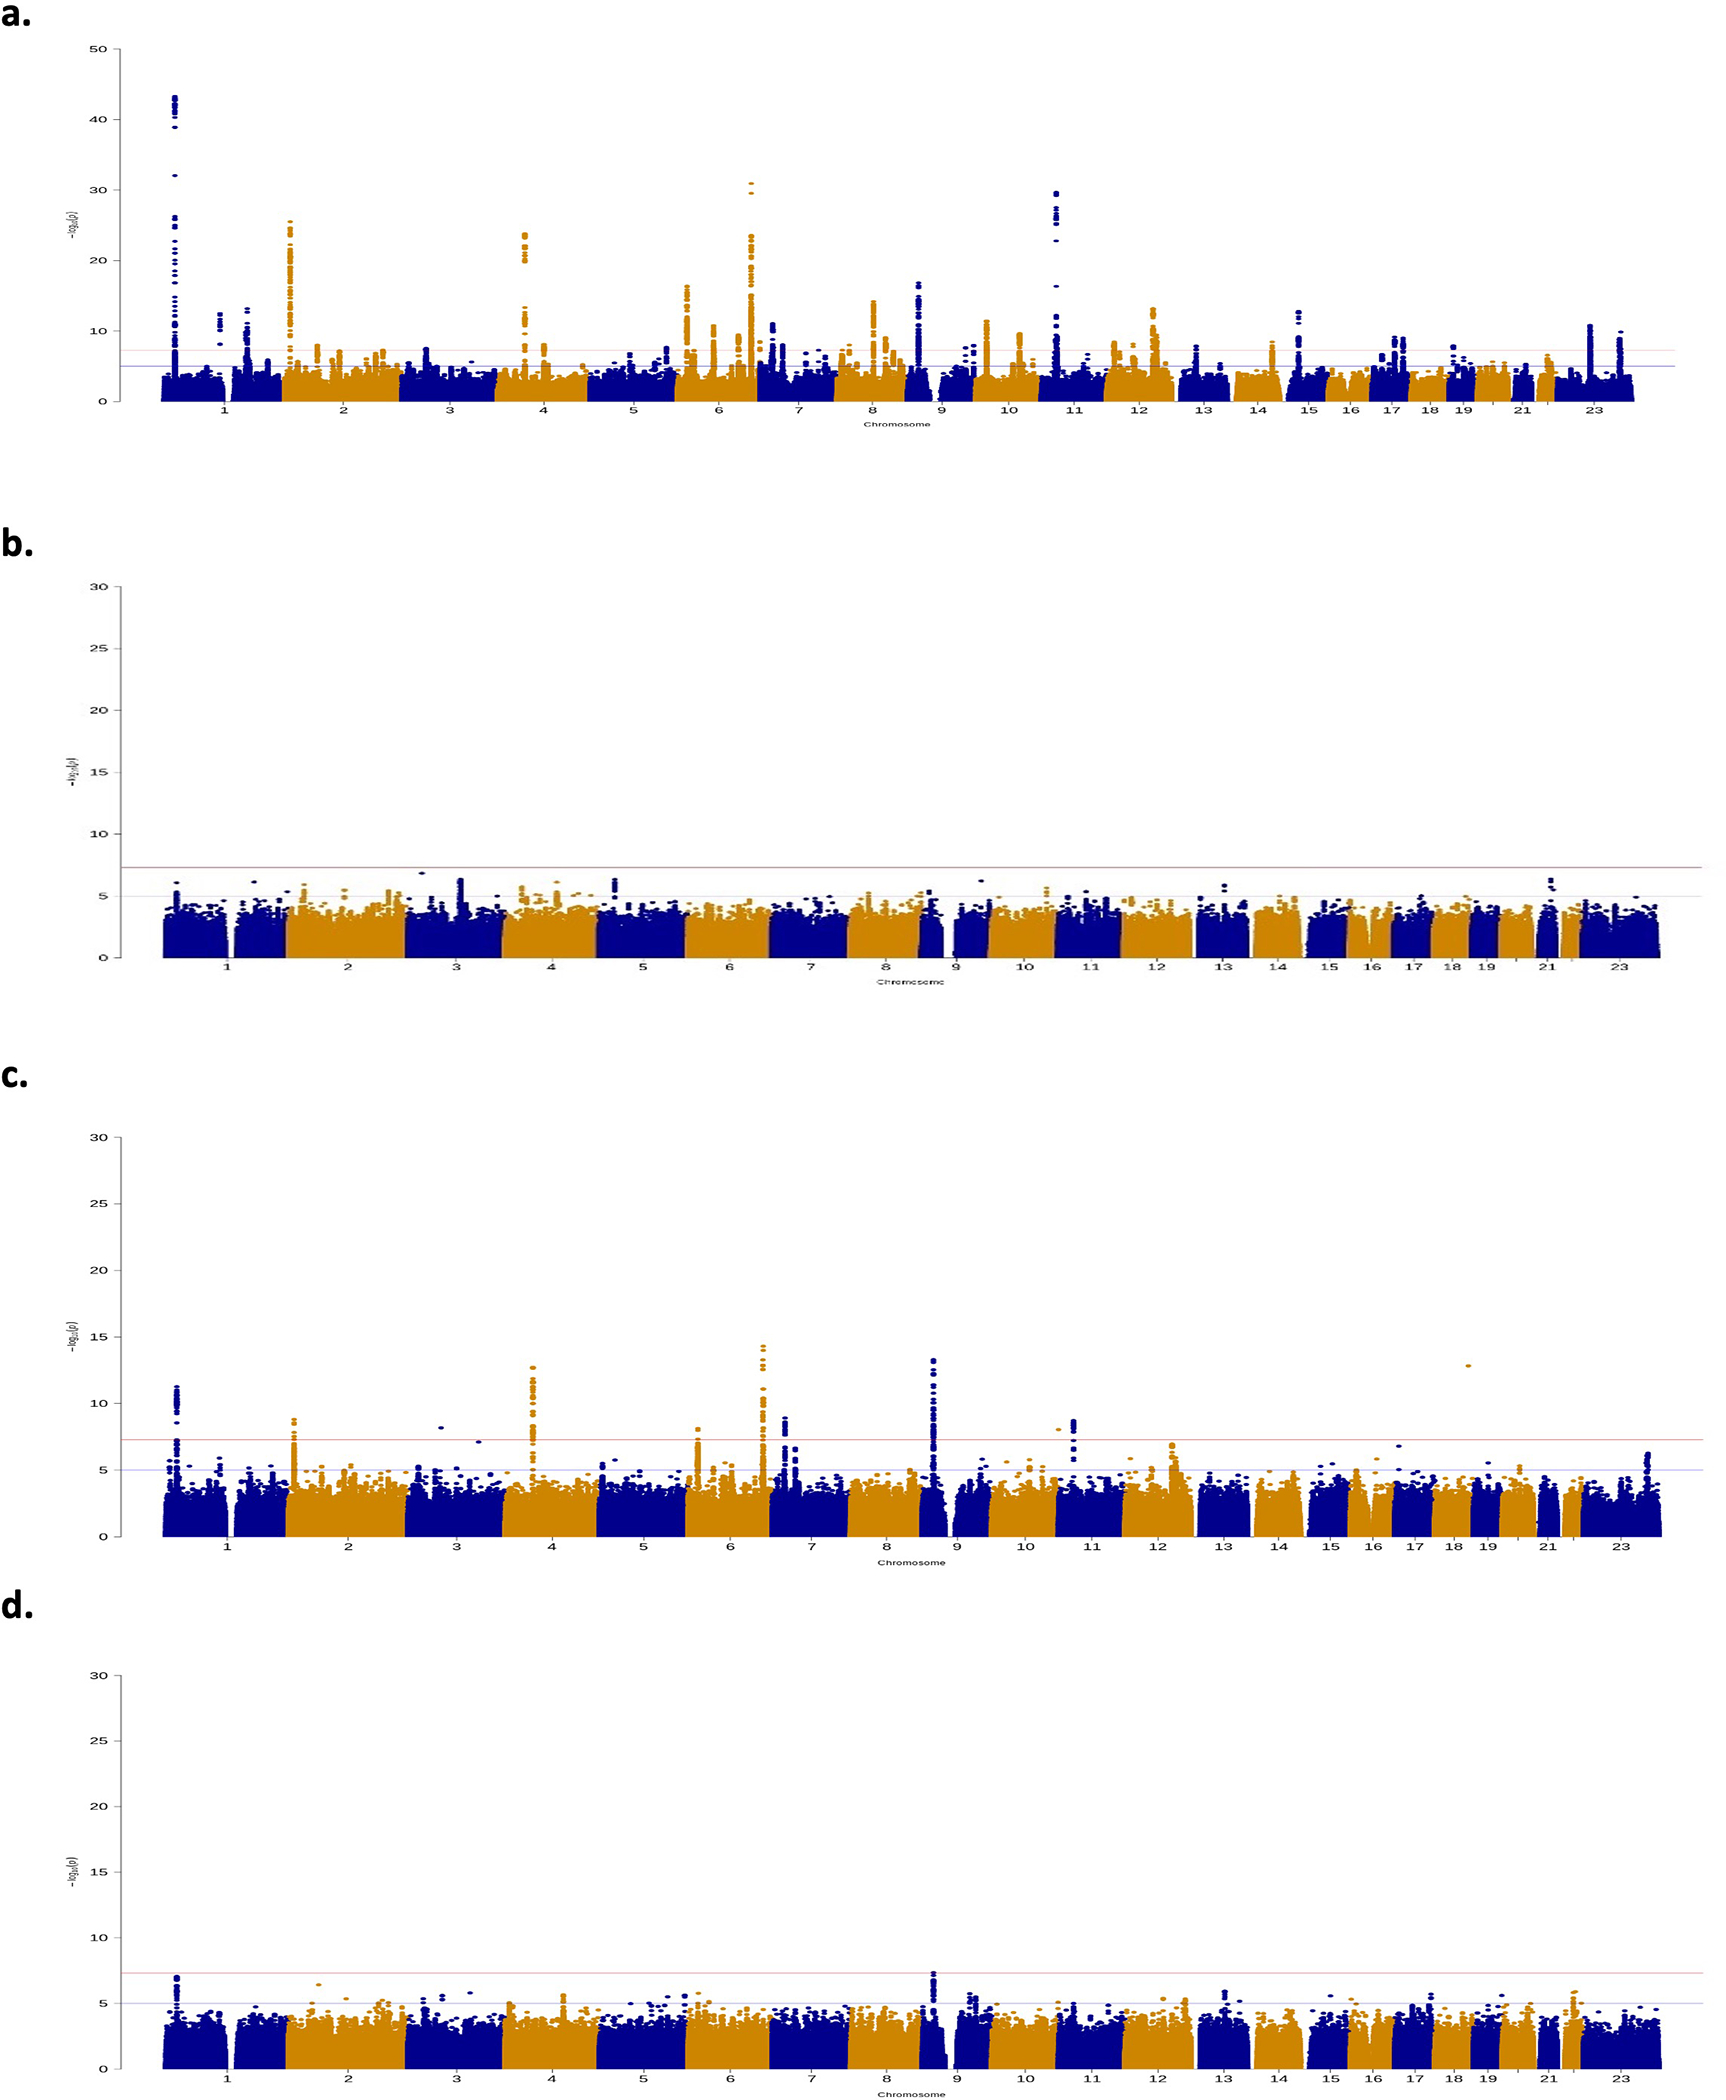
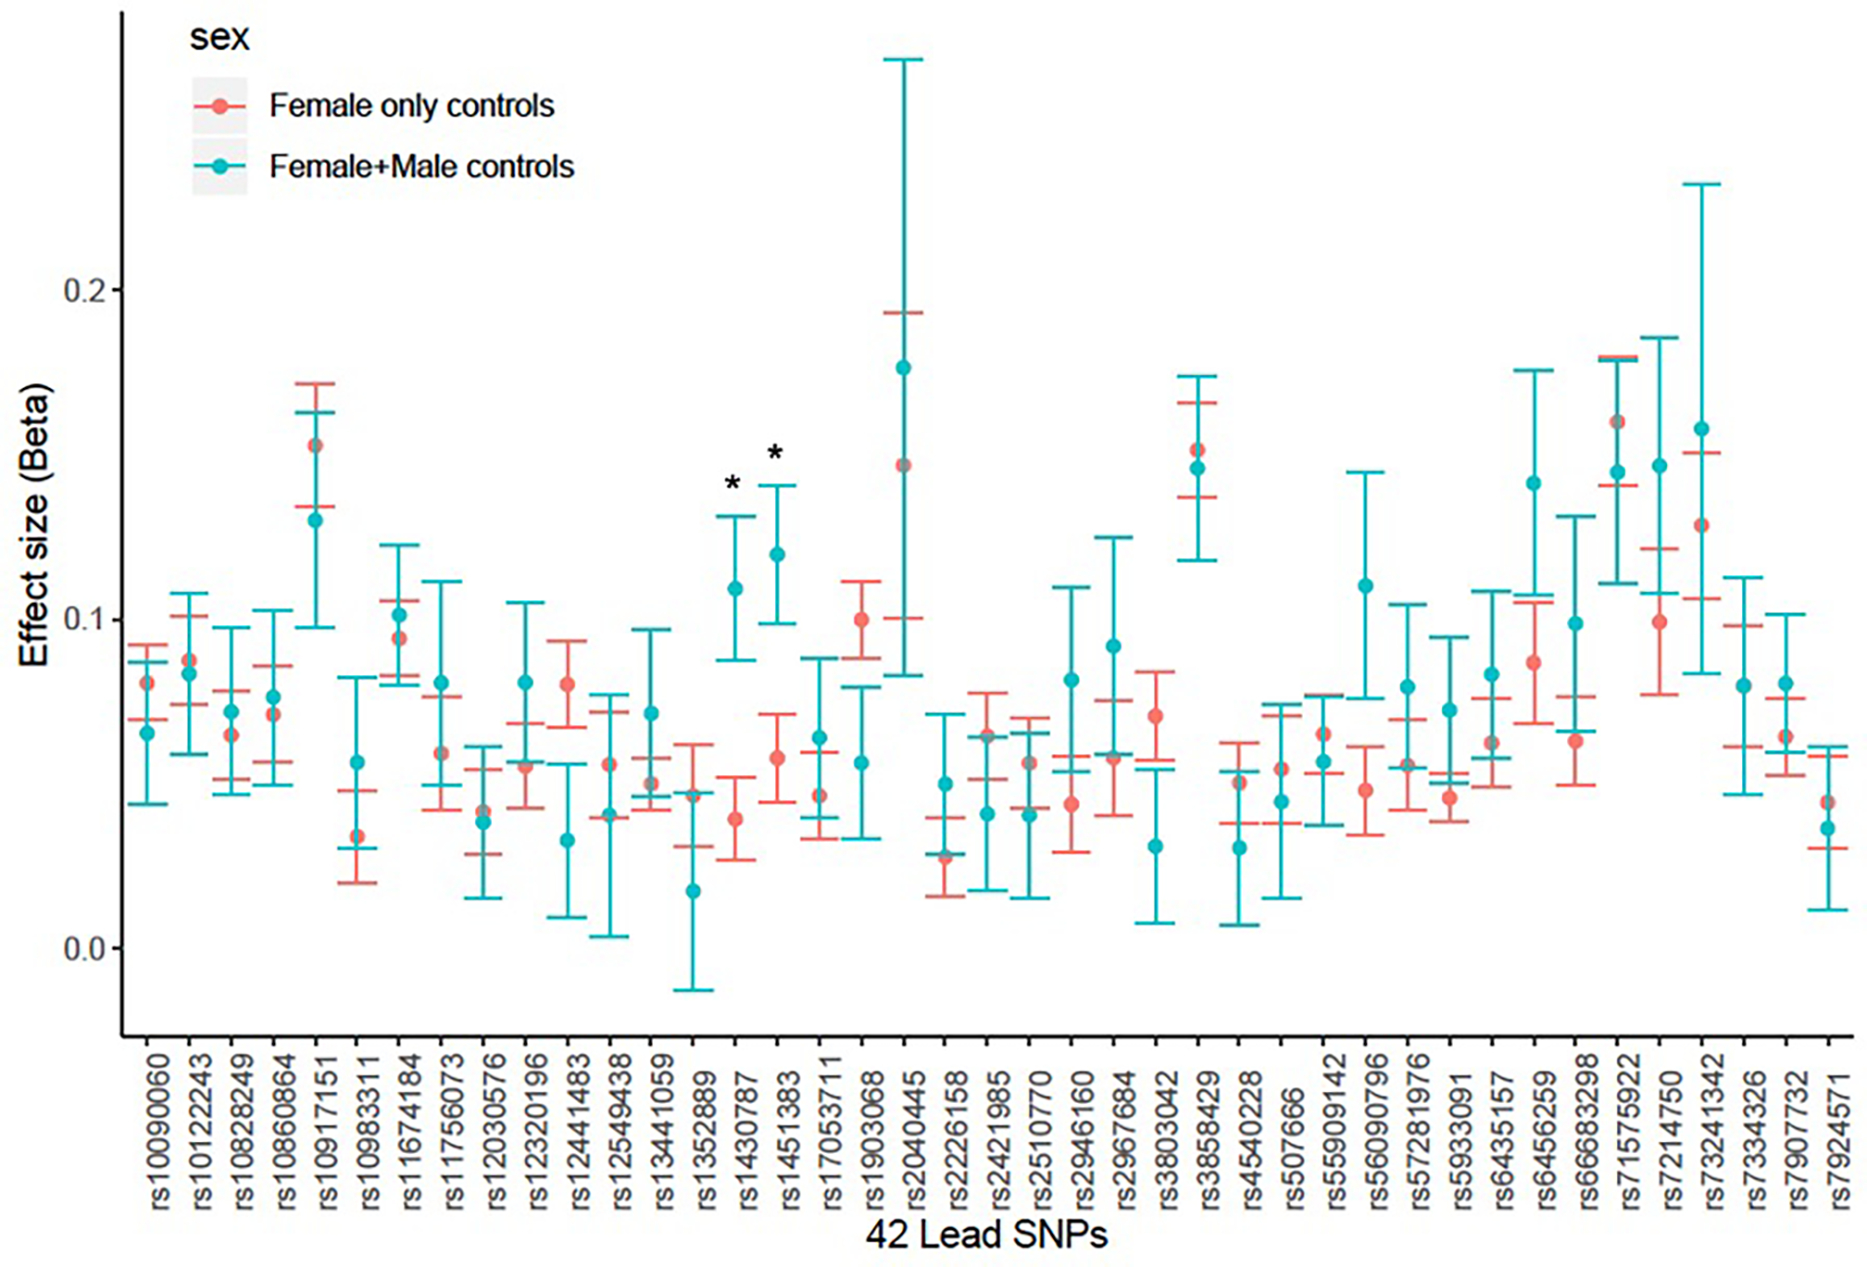
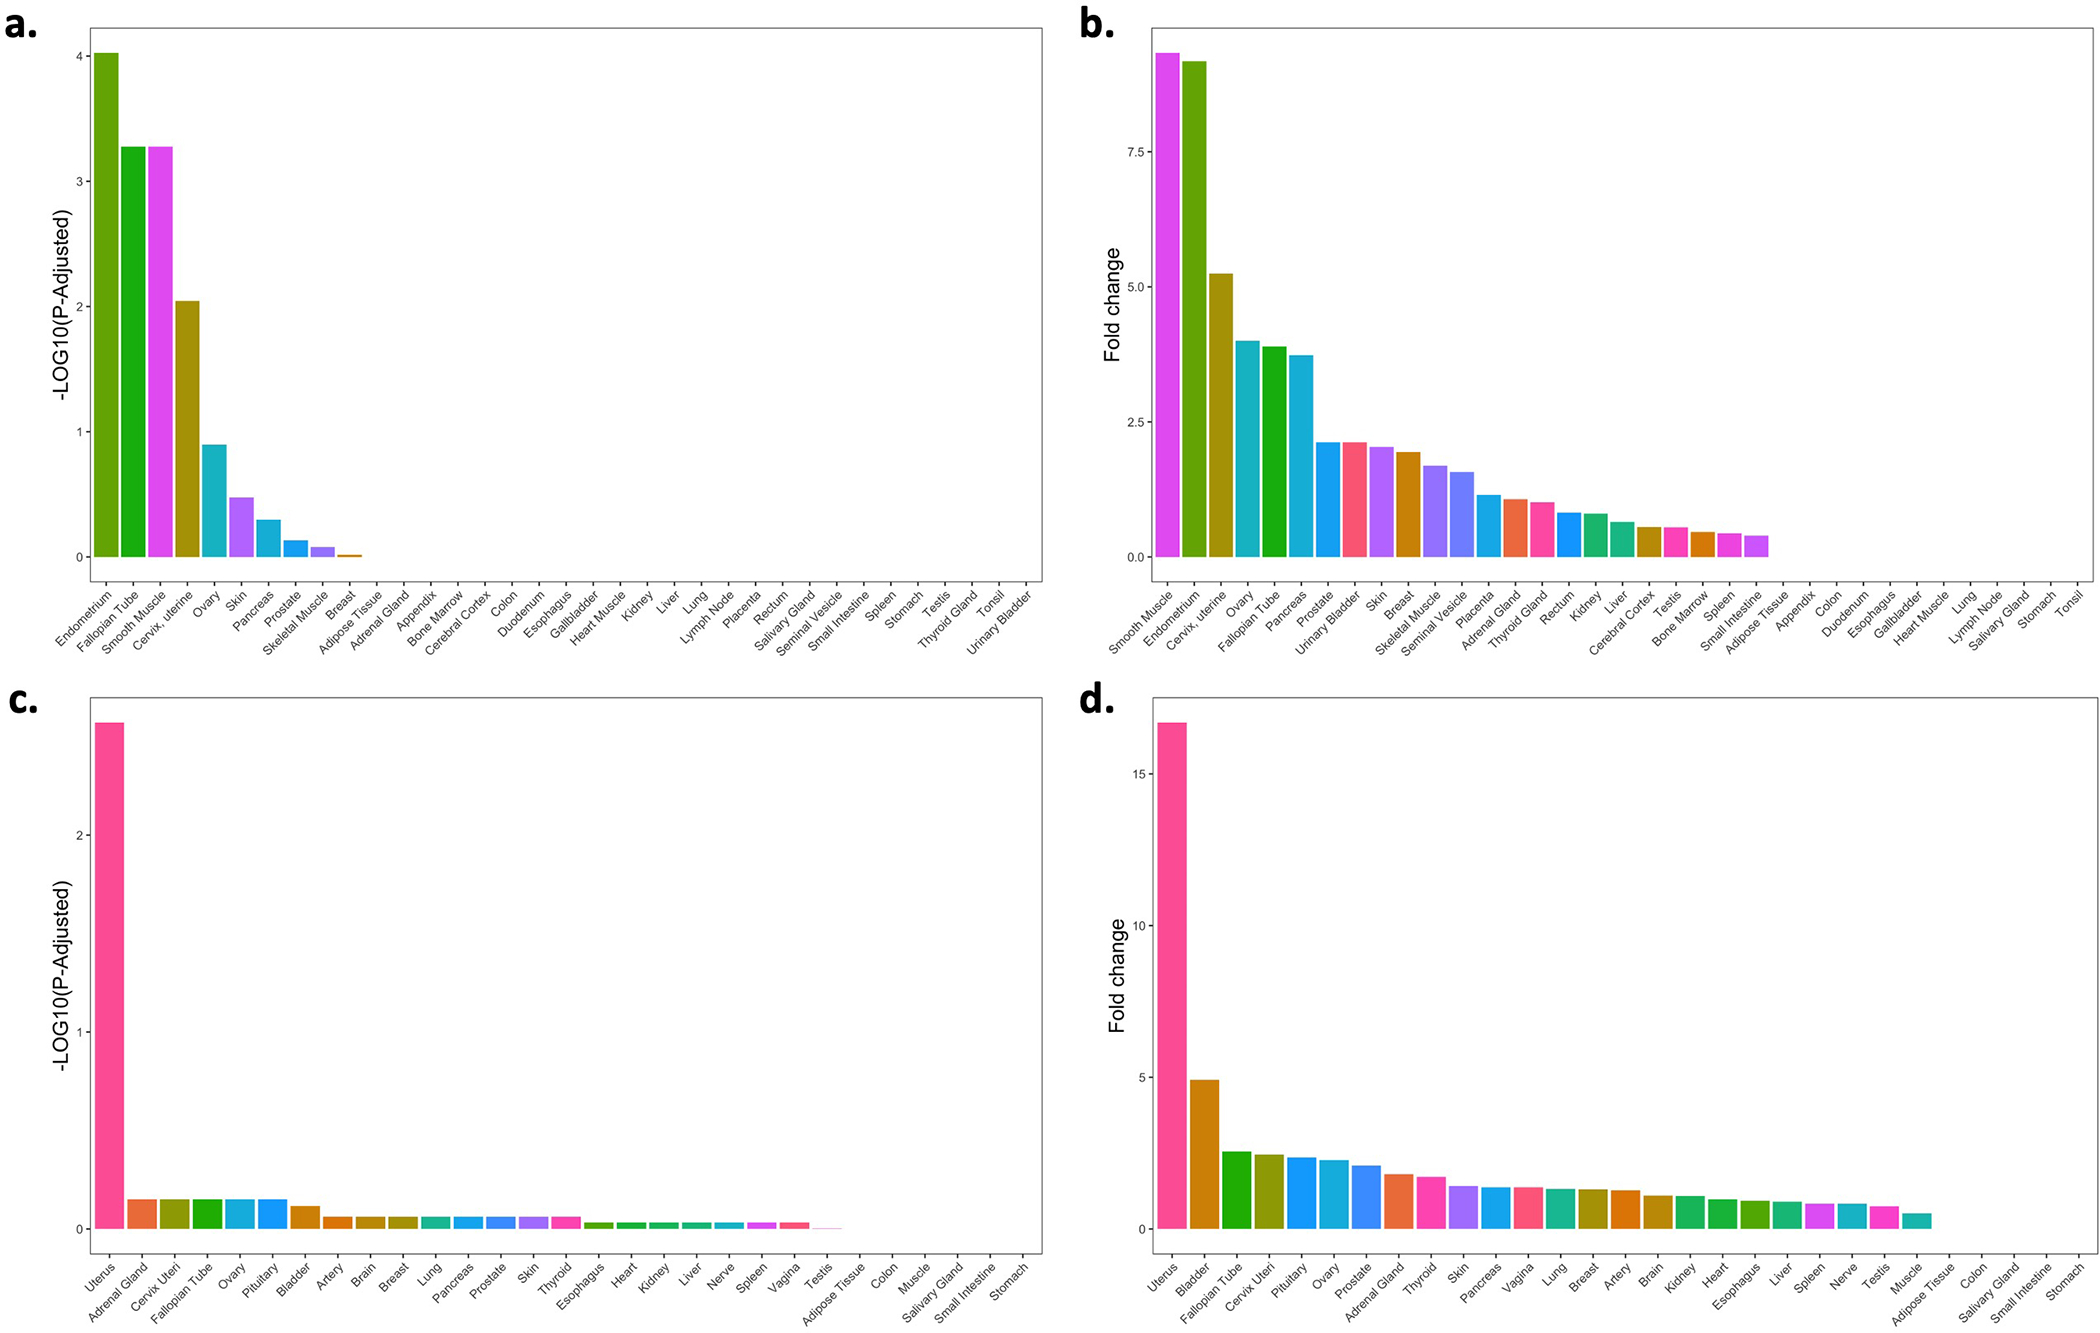
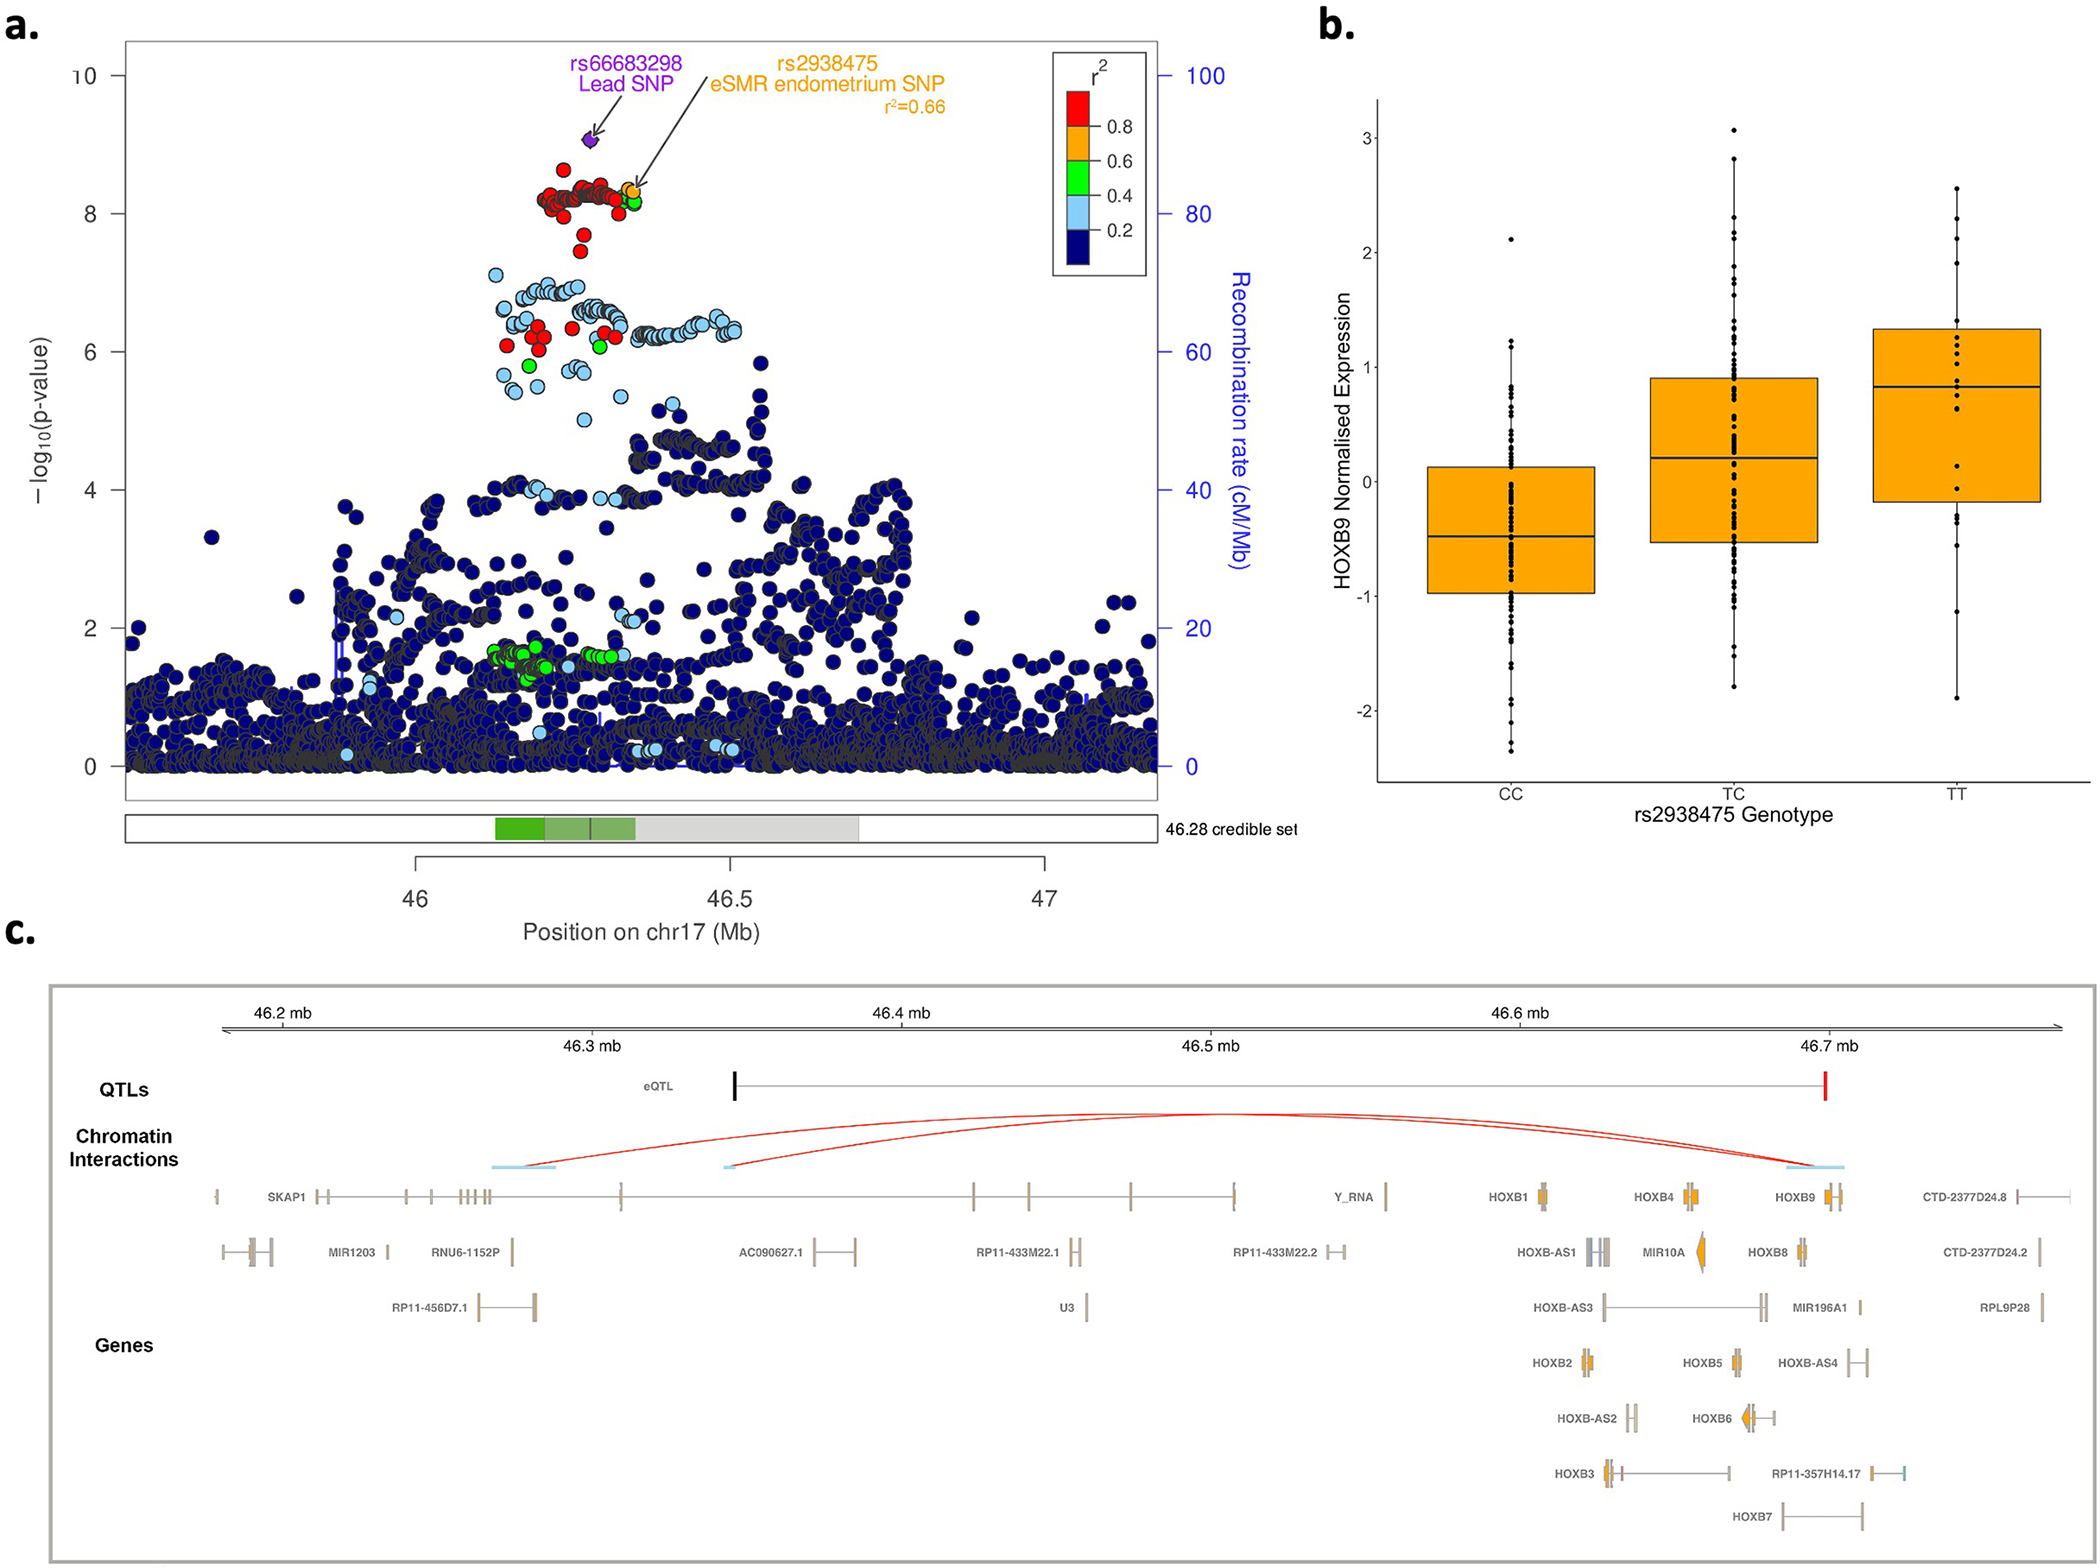
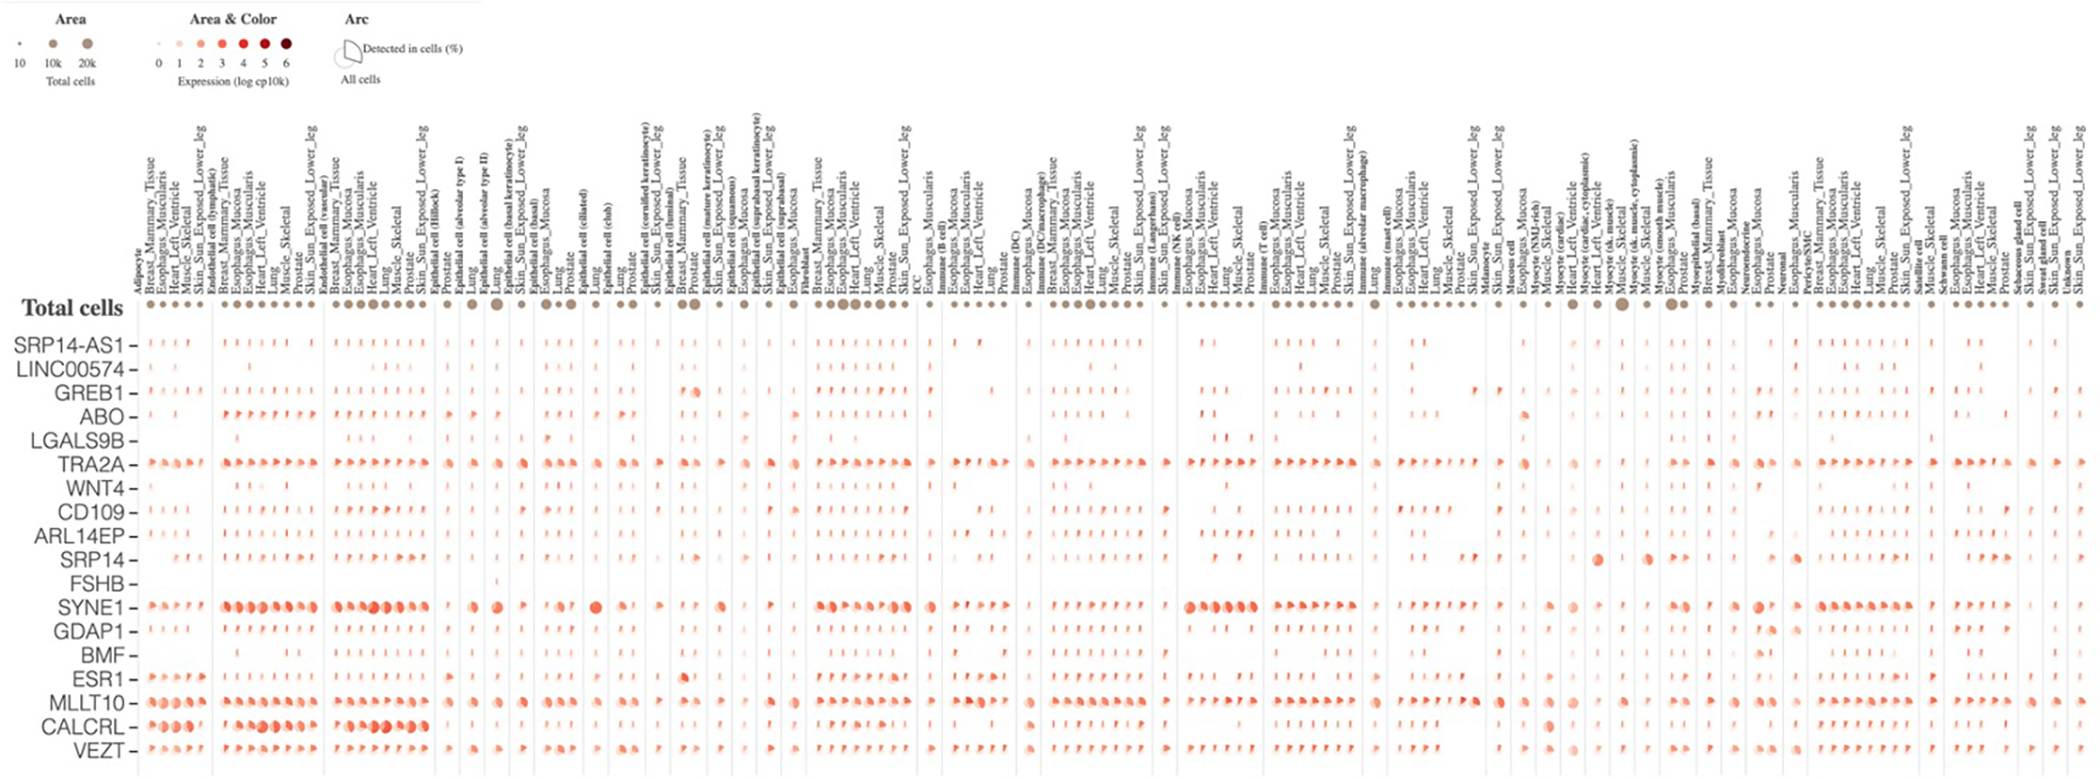
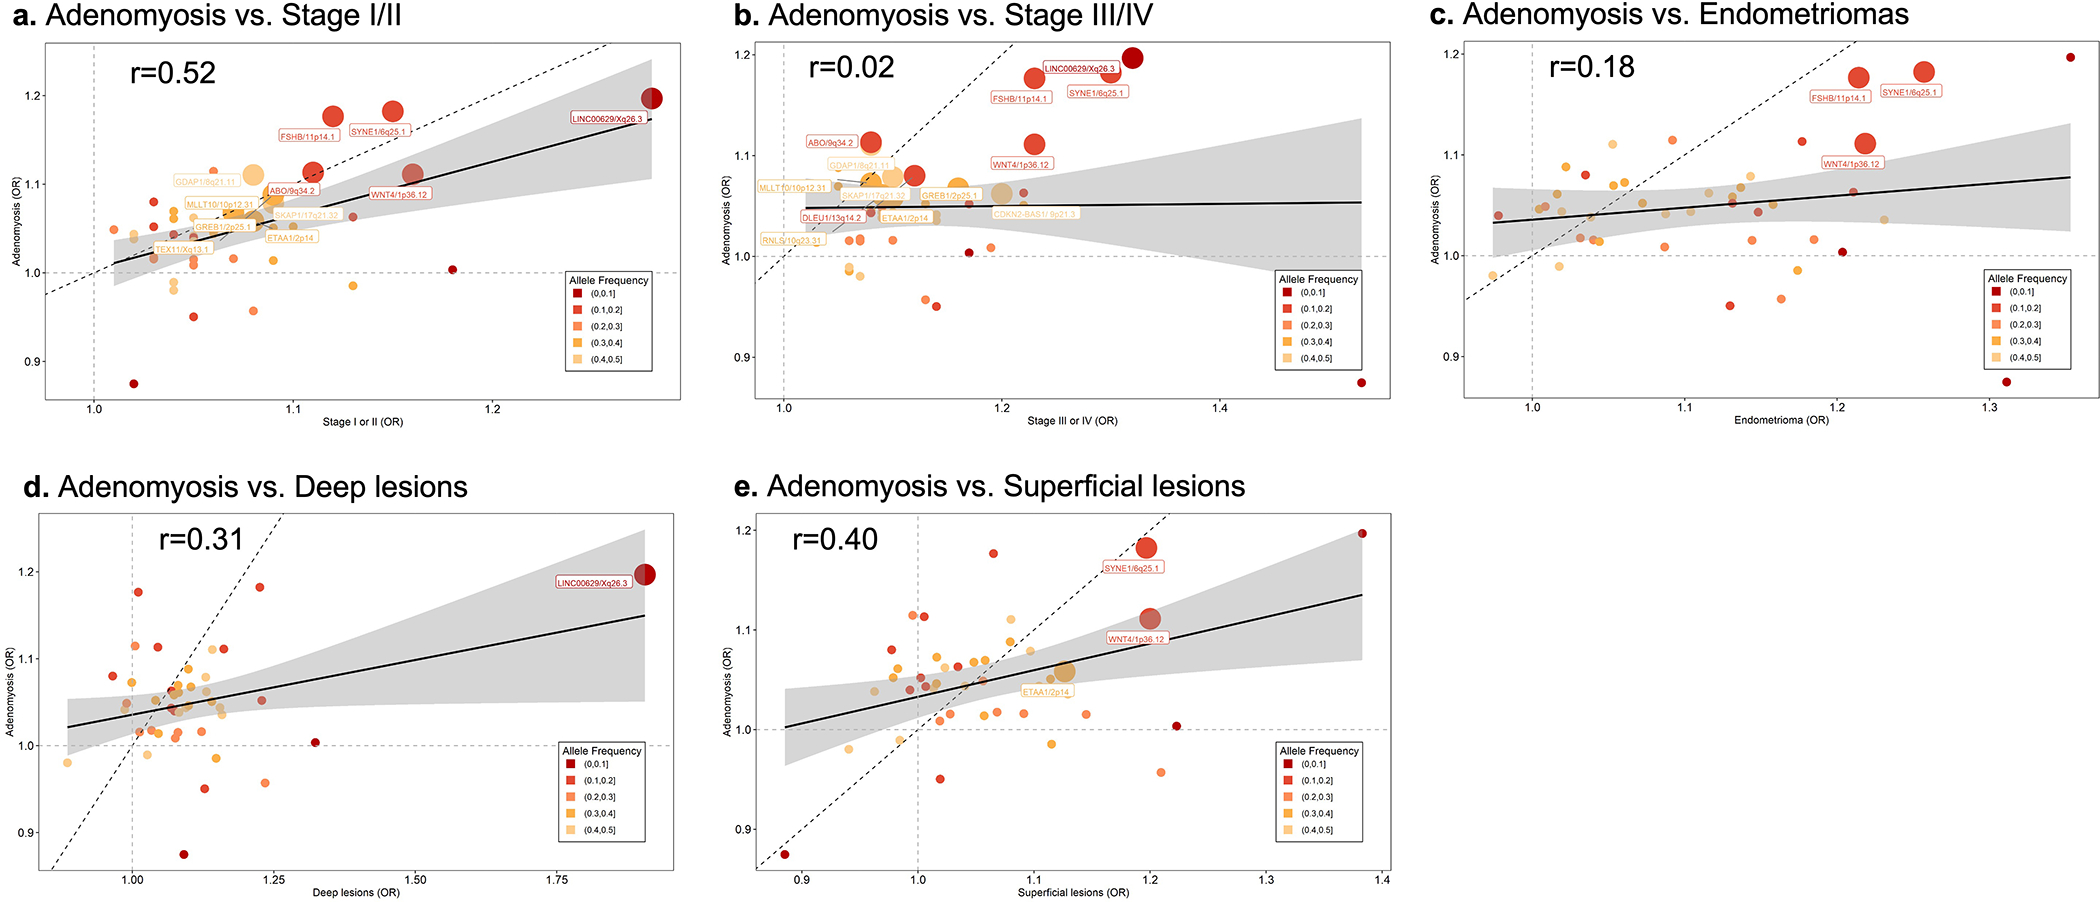
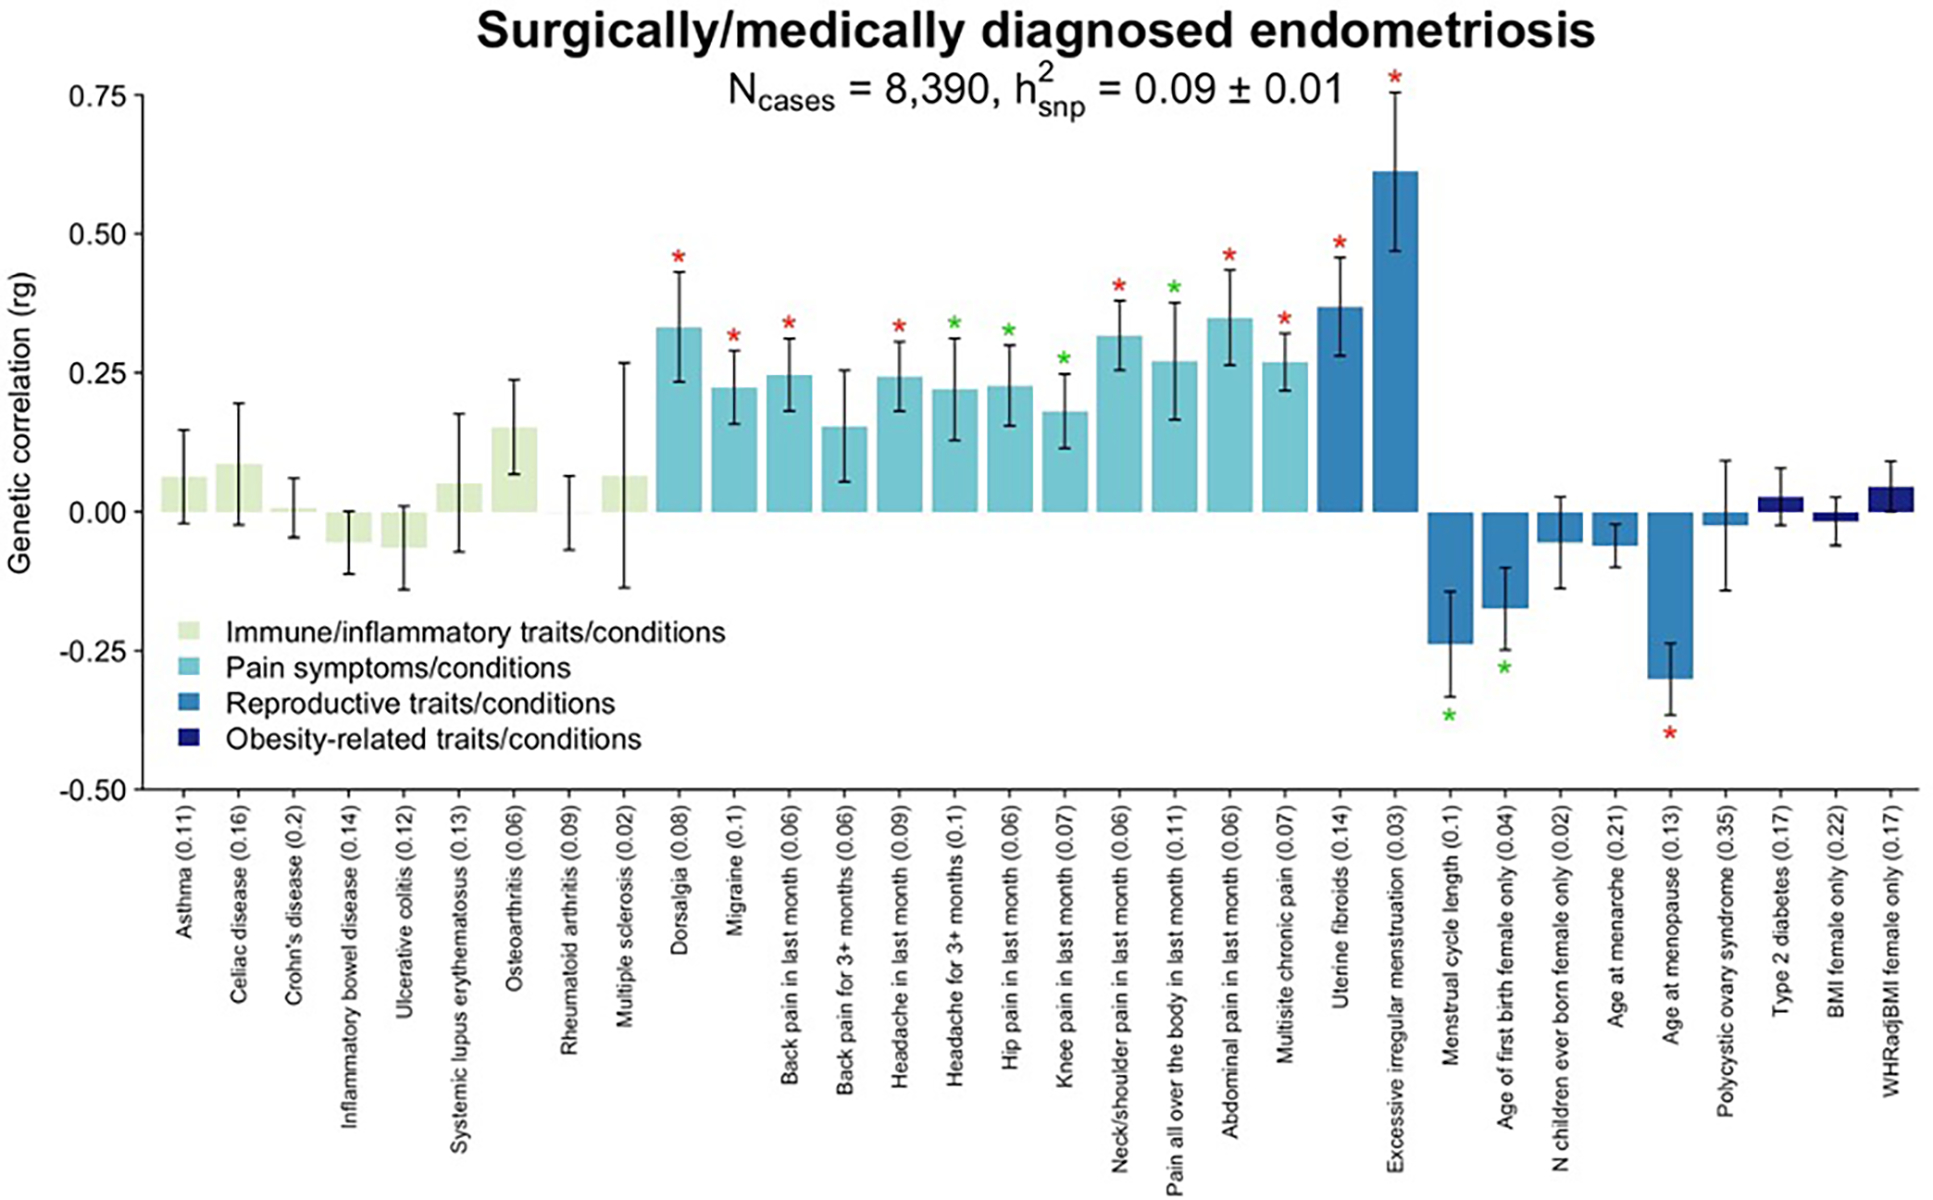
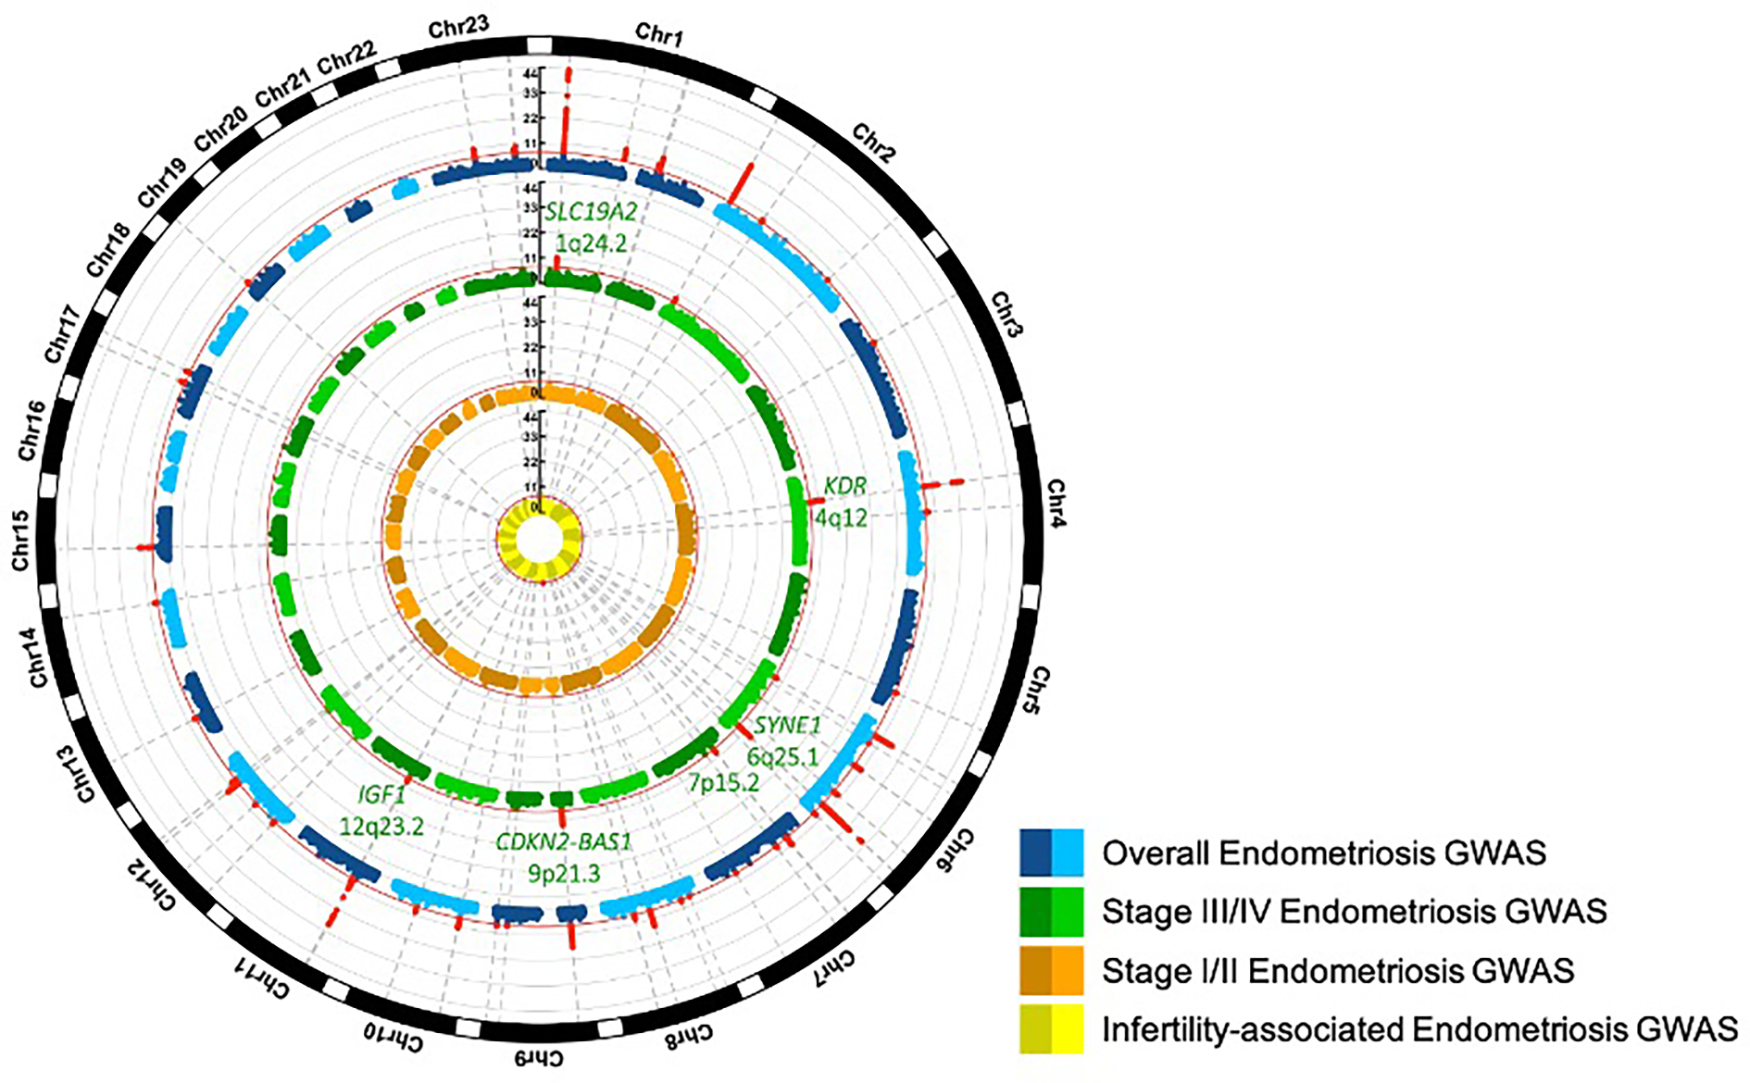
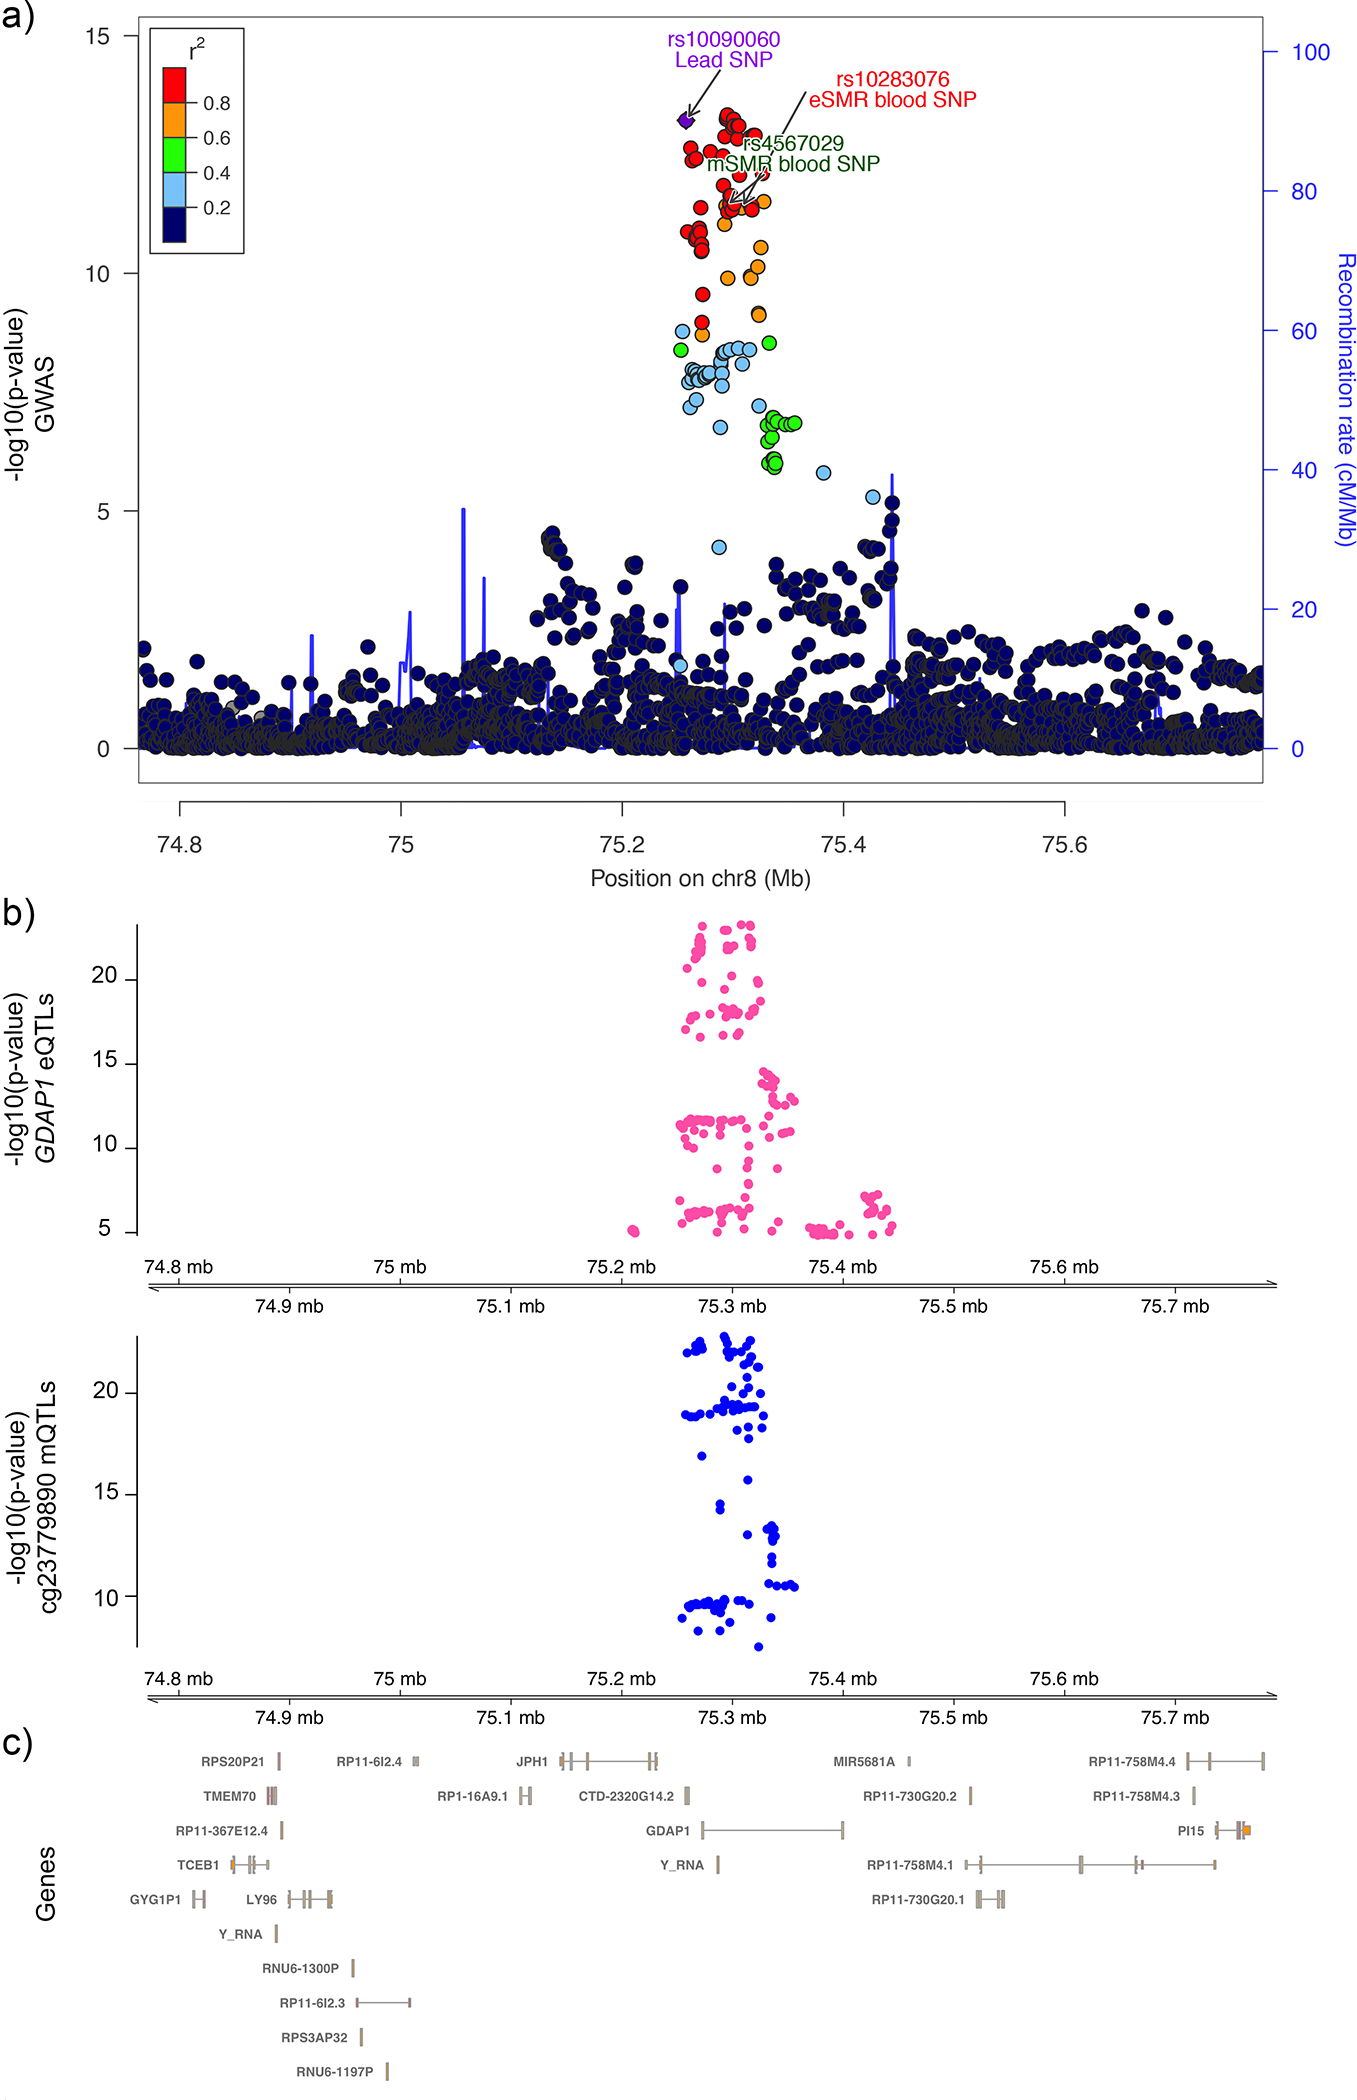
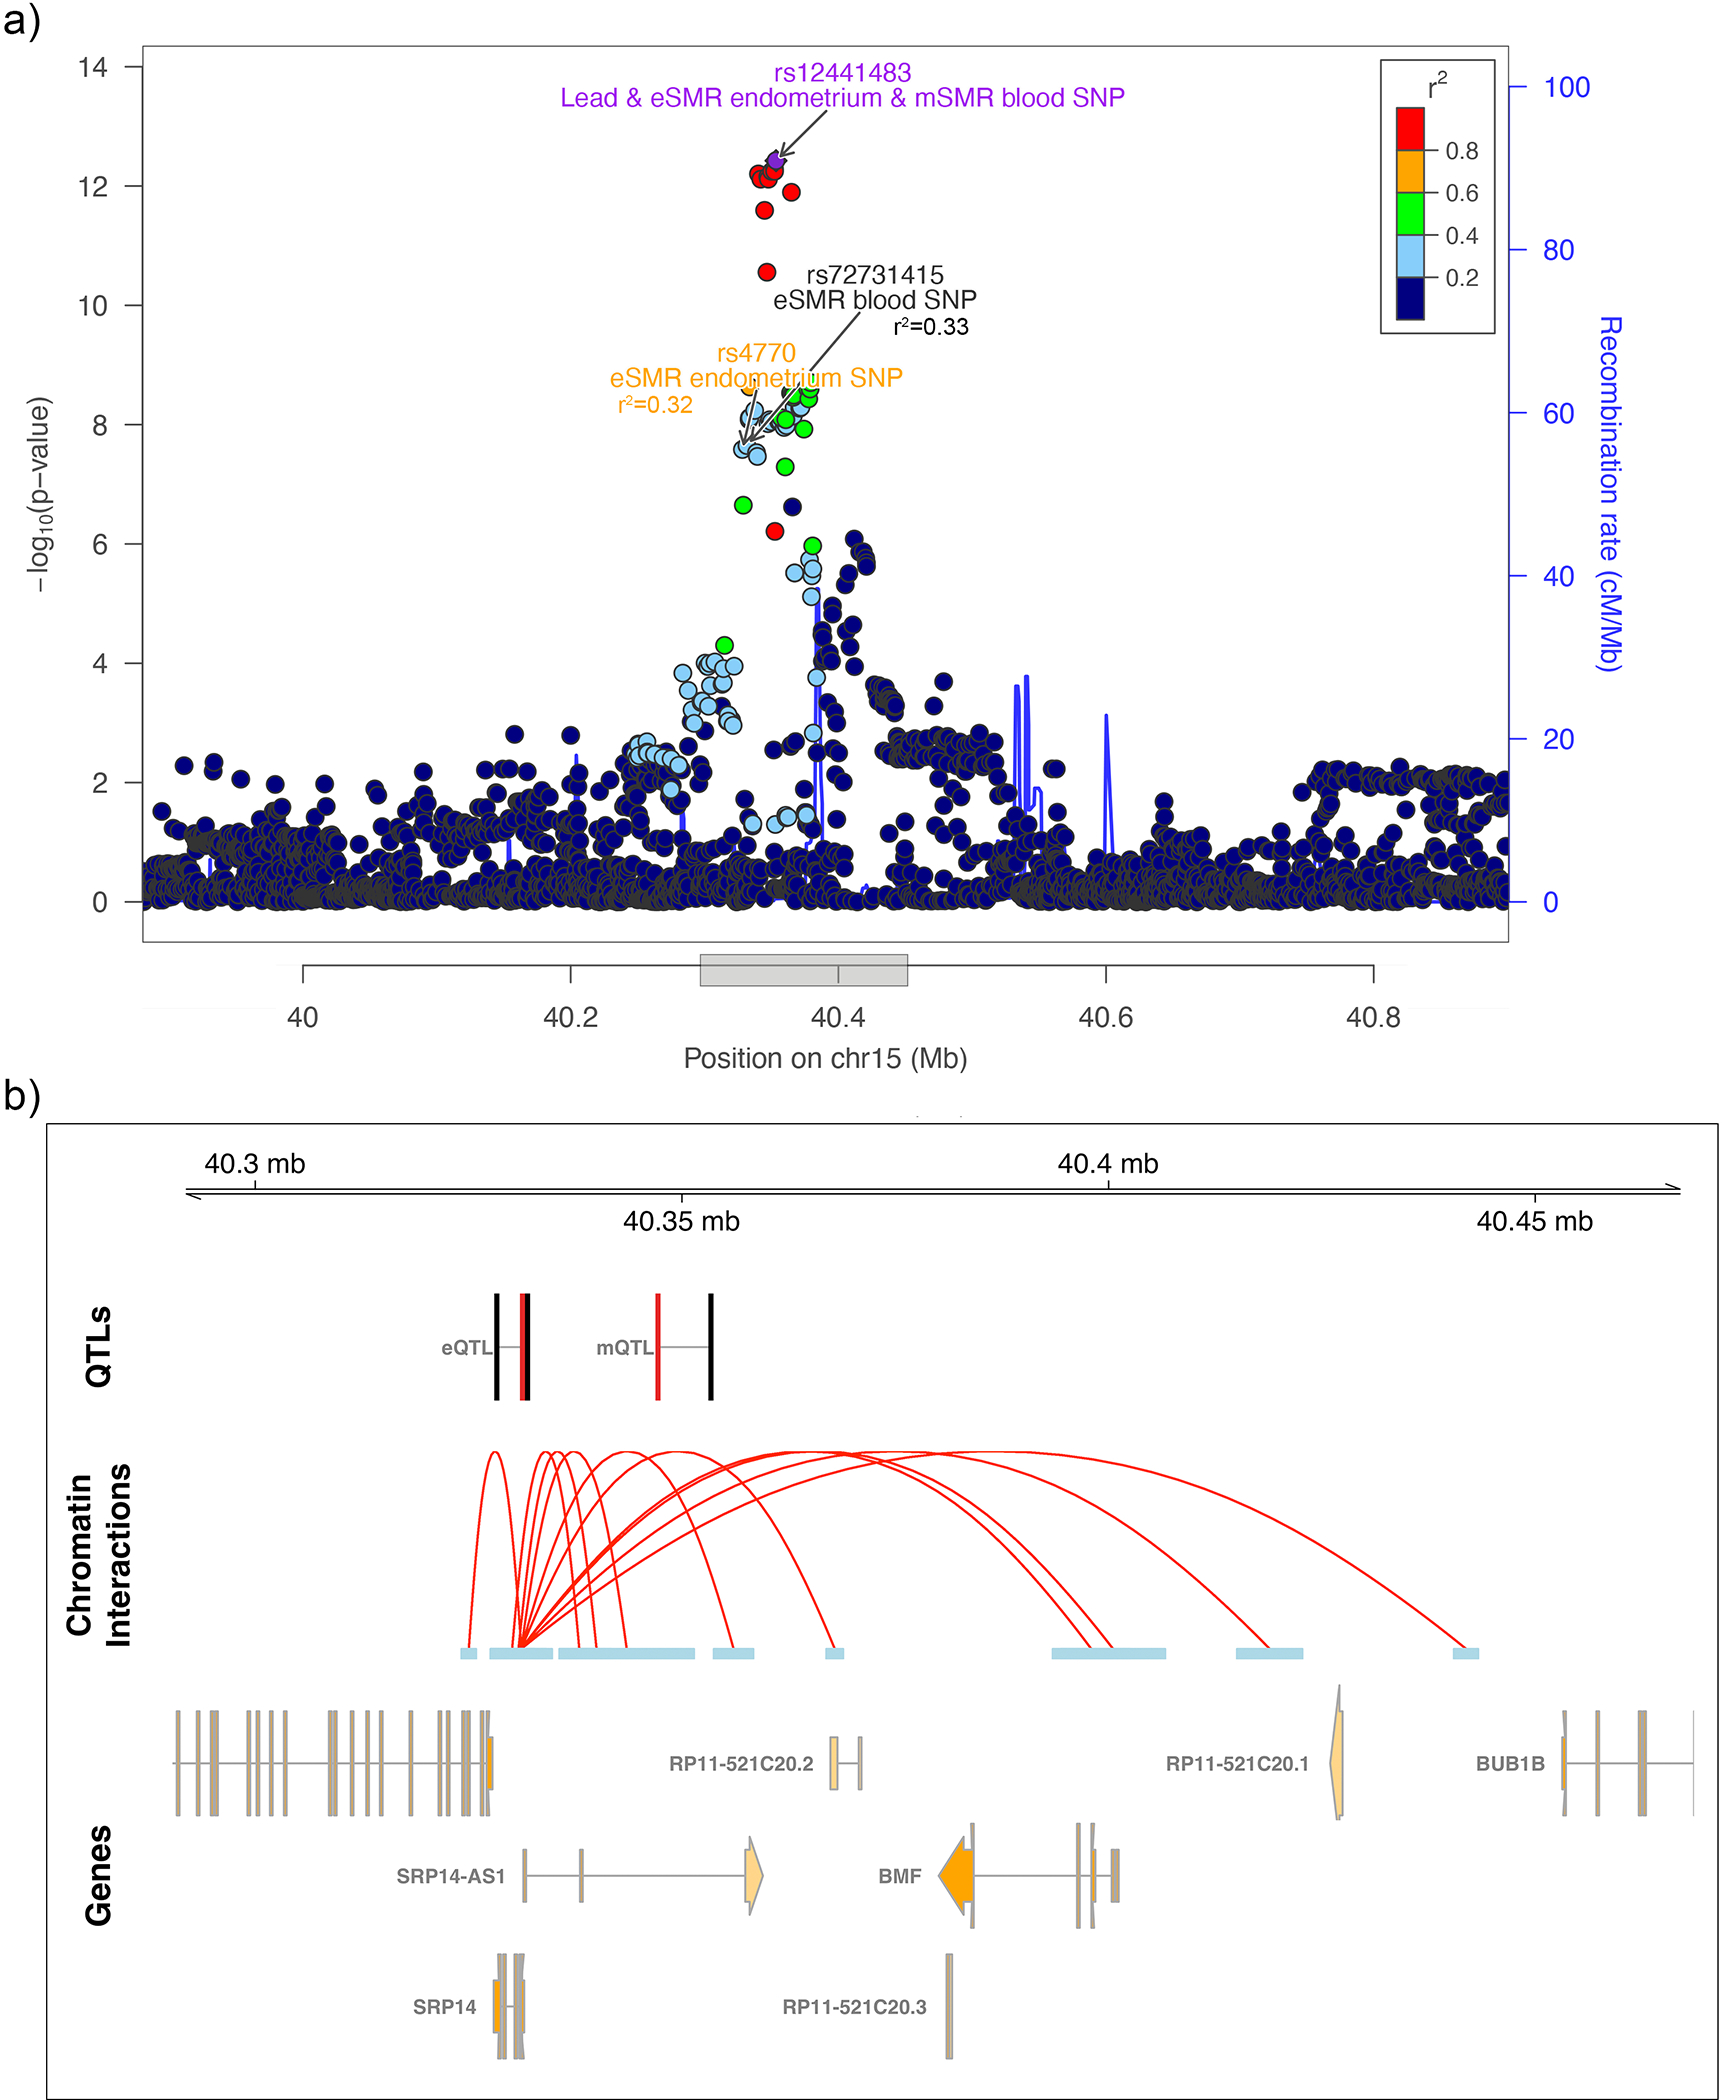
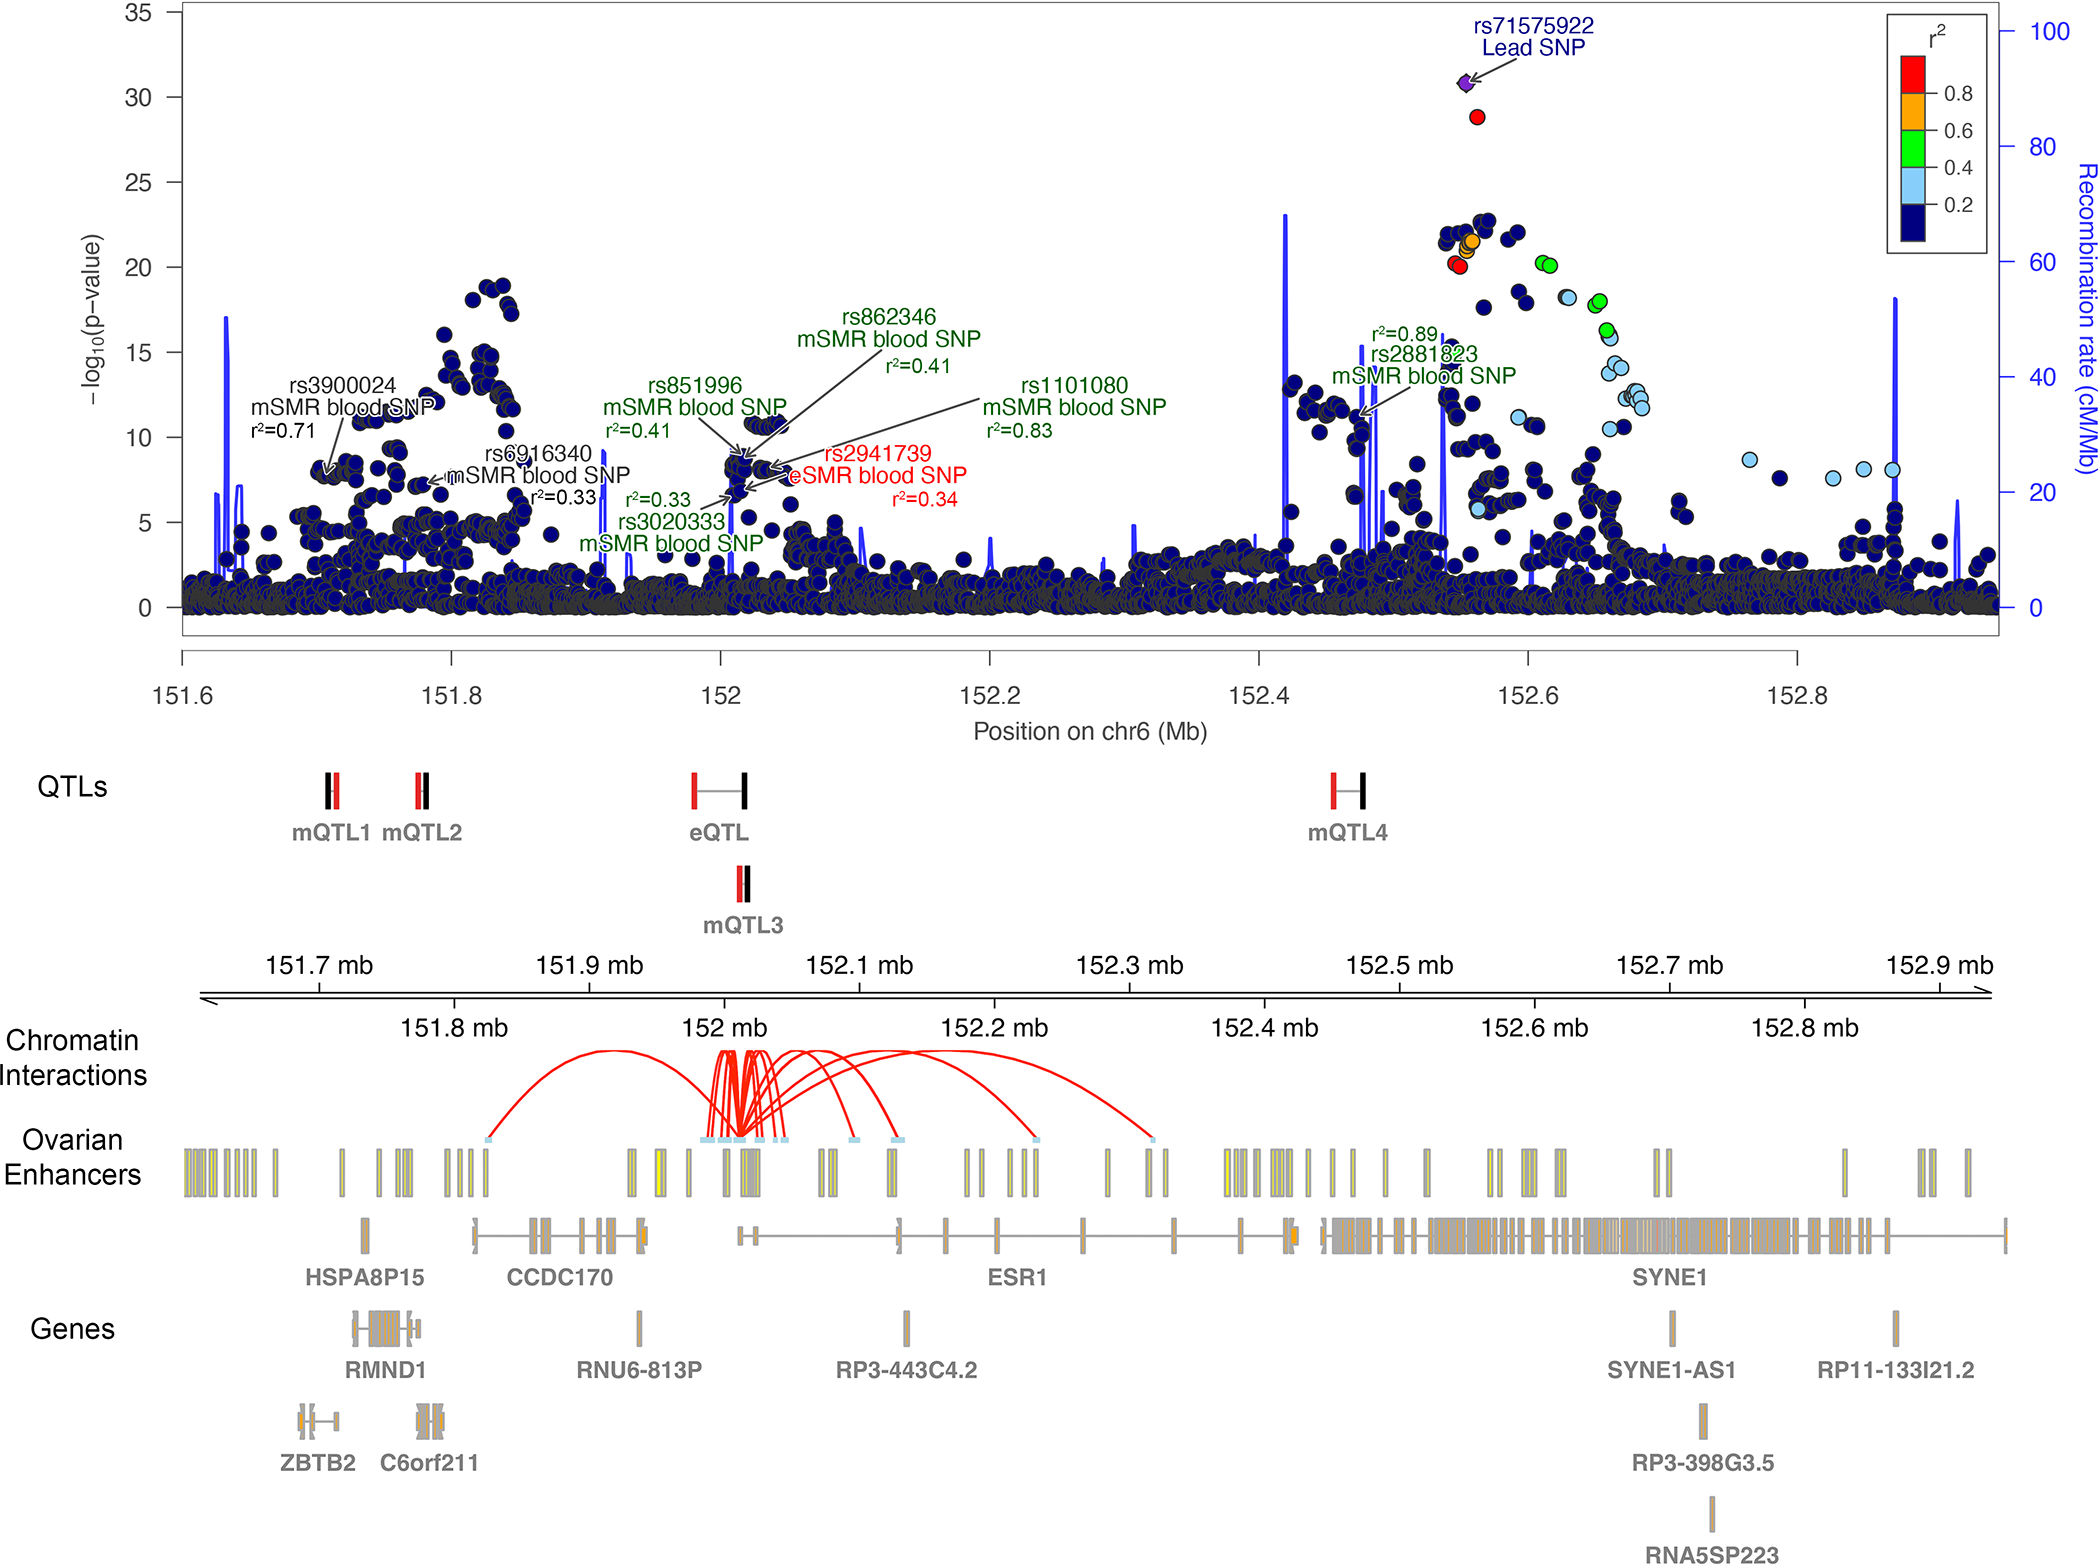
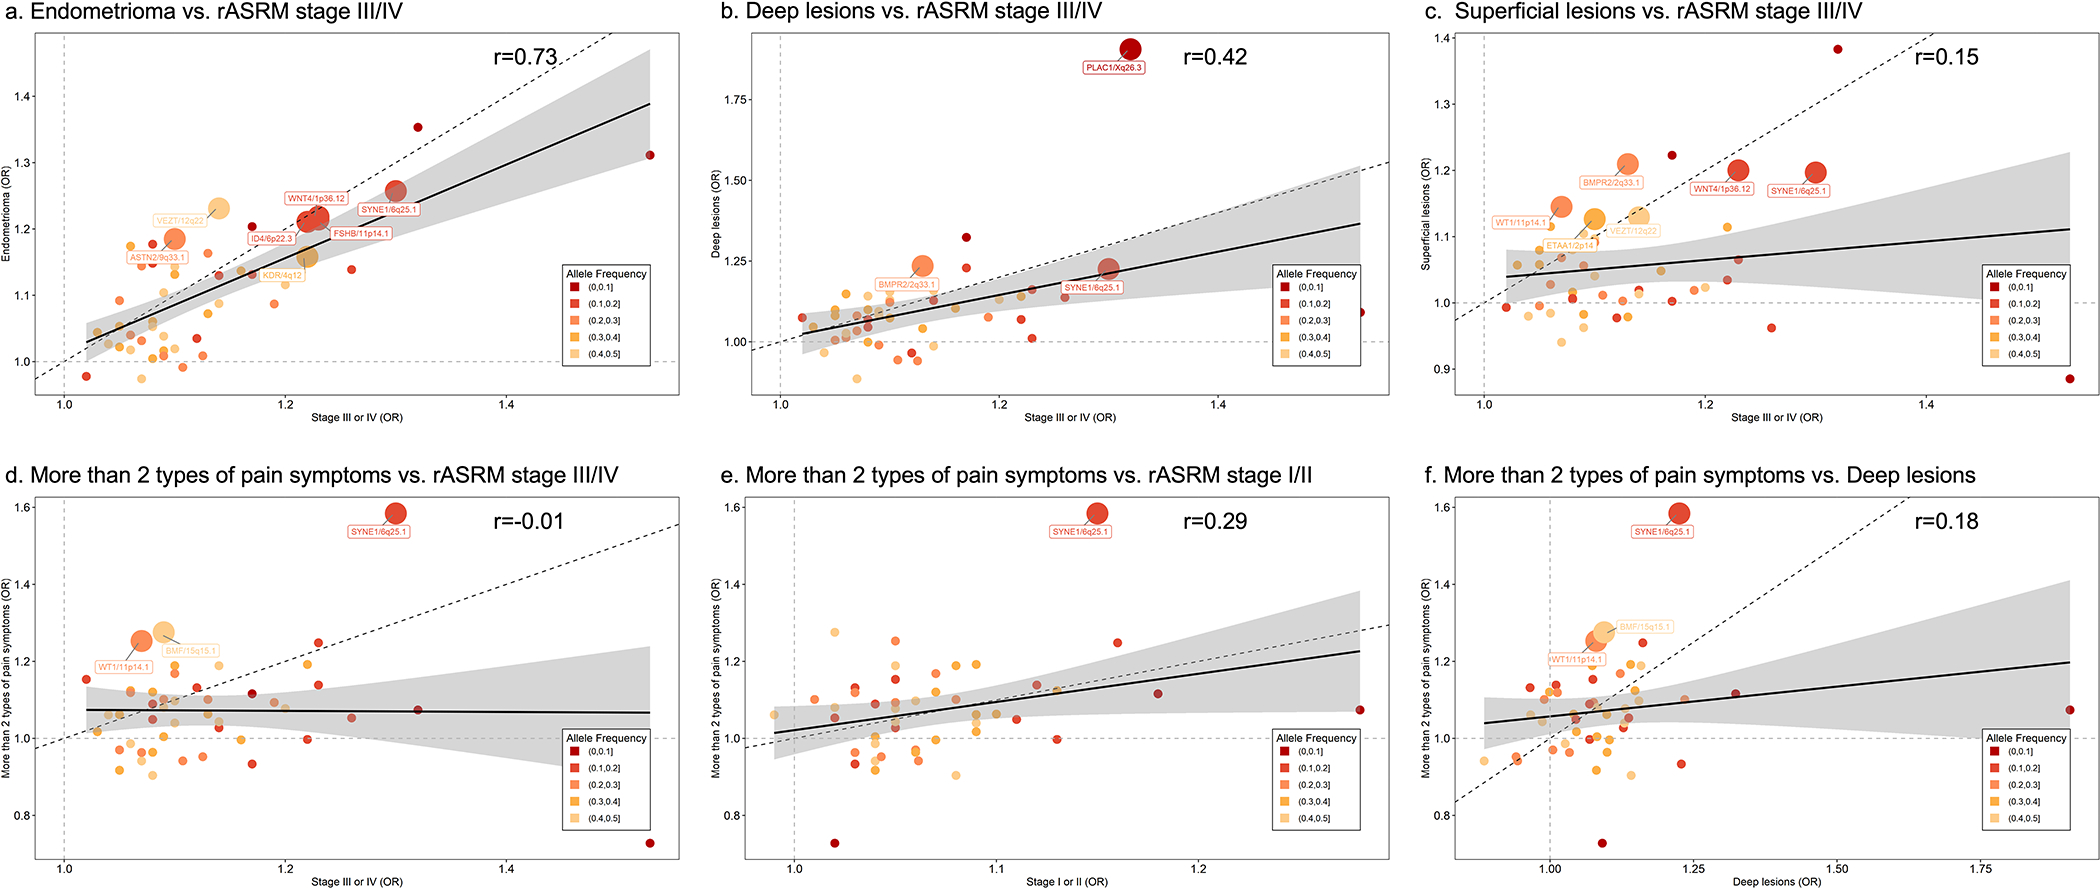
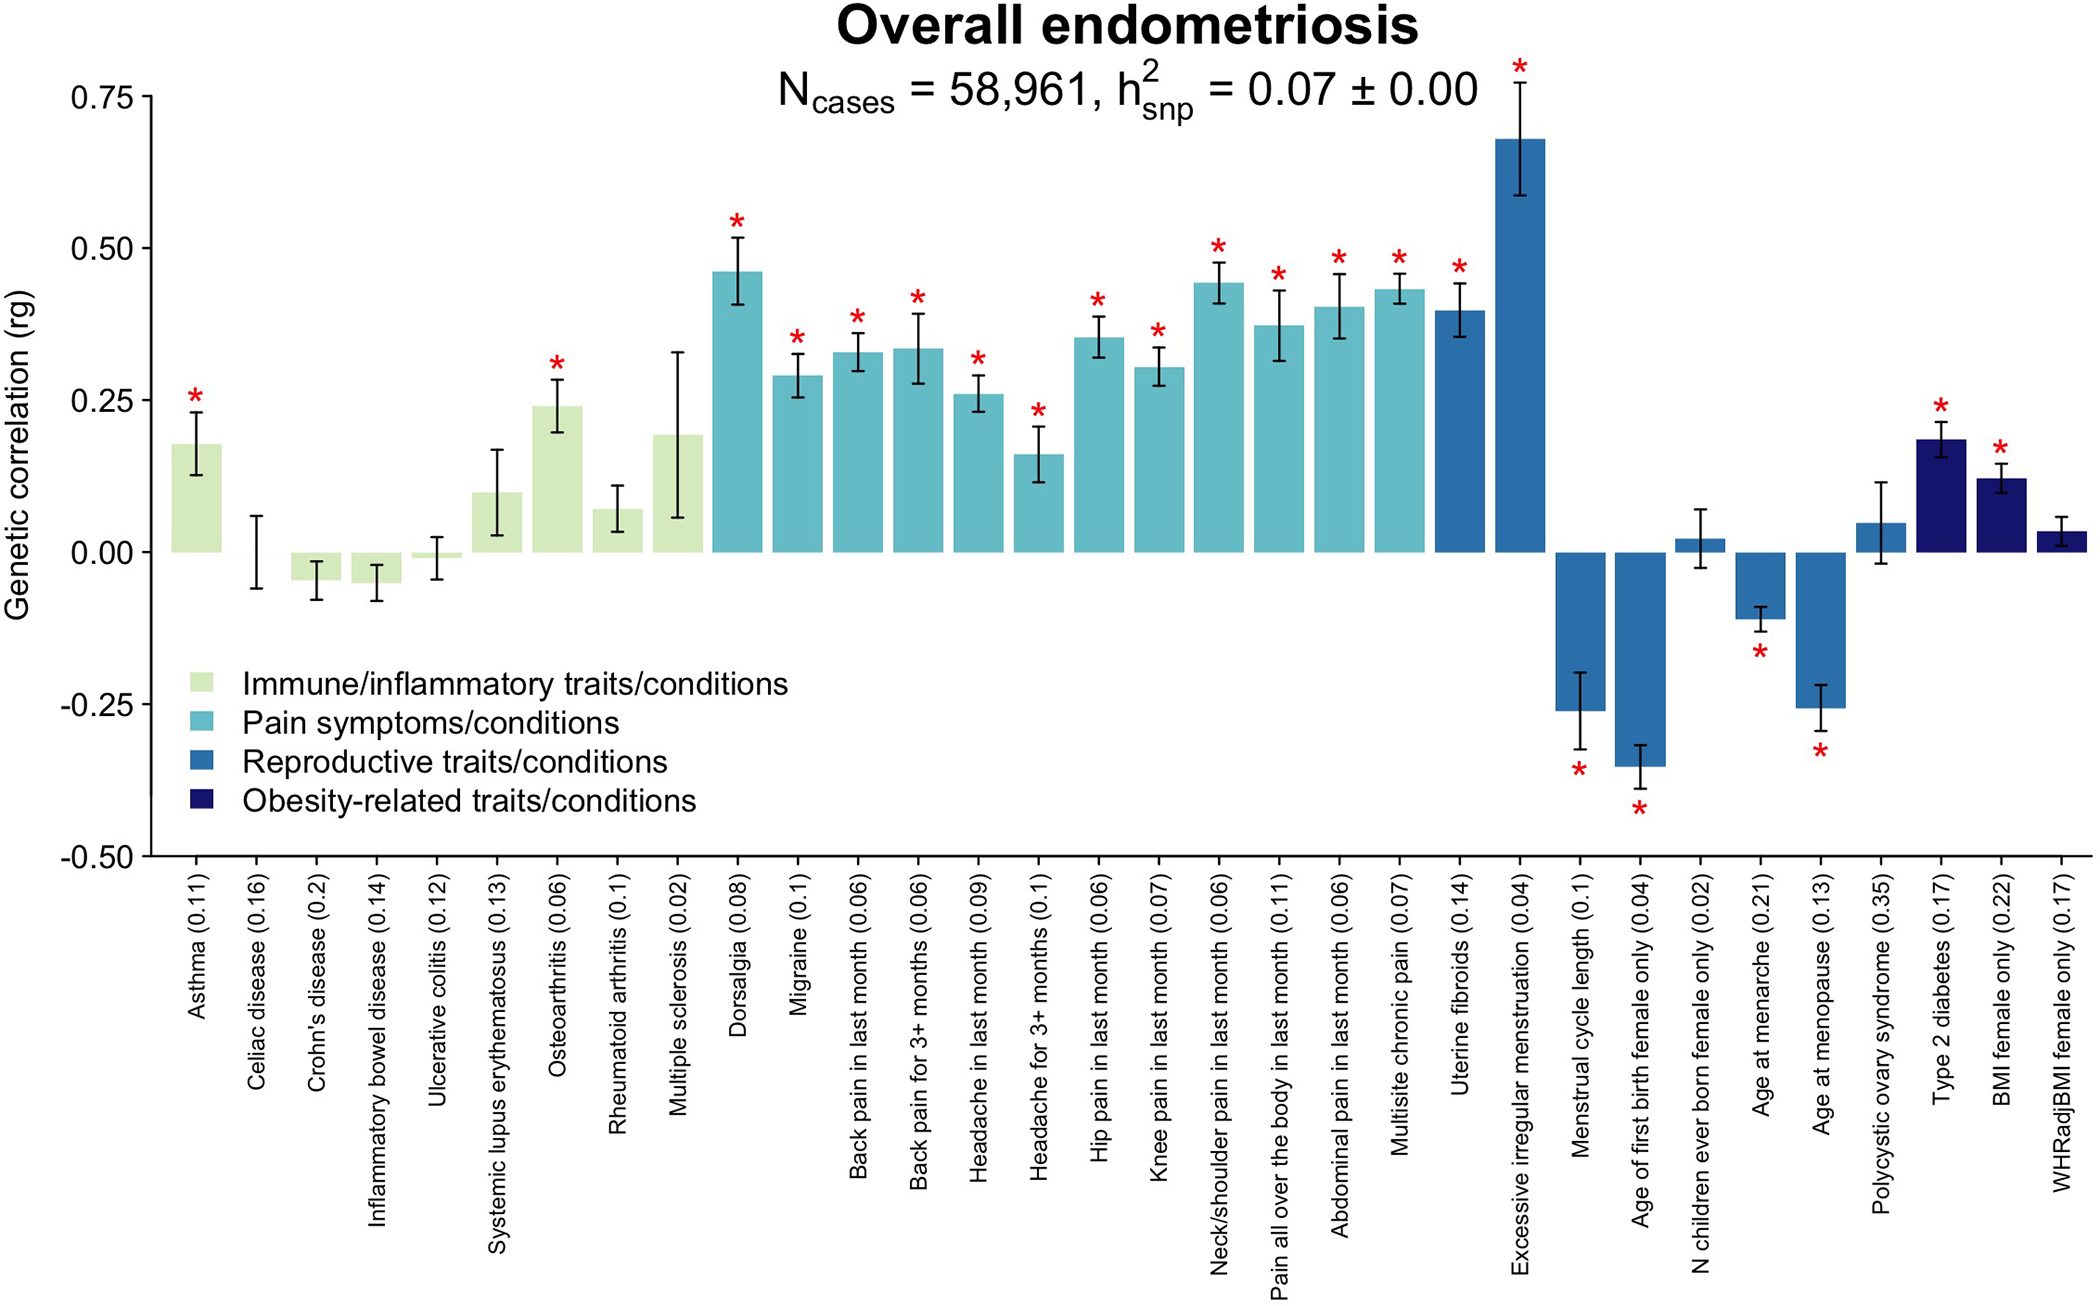
Endometriosis is a common condition associated with debilitating pelvic pain and infertility. A genome-wide association study meta-analysis, including 60,674 cases and 701,926 controls of European and East Asian descent, identified 42 genome-wide significant loci comprising 49 distinct association signals. Effect sizes were largest for stage 3/4 disease, driven by ovarian endometriosis. Identified signals explained up to 5.01% of disease variance and regulated expression or methylation of genes in endometrium and blood, many of which were associated with pain perception/maintenance (SRP14/BMF, GDAP1, MLLT10, BSN and NGF). We observed significant genetic correlations between endometriosis and 11 pain conditions, including migraine, back and multisite chronic pain (MCP), as well as inflammatory conditions, including asthma and osteoarthritis. Multitrait genetic analyses identified substantial sharing of variants associated with endometriosis and MCP/migraine. Targeted investigations of genetically regulated mechanisms shared between endometriosis and other pain conditions are needed to aid the development of new treatments and facilitate early symptomatic intervention.


Conflict of interest statement

Competing Interests

L.S., G.T., K.S. and V.S. are employees of deCODE Genetics/Amgen. G.G., C.C. and P.Y.B. are employees of Celmatix Inc., and hold stock or stock options in Celmatix Inc. P.F. and J.Y.T. are employees of 23andMe Inc. O.H. serves occasionally on advisory boards for Bayer AG, Gedeon Richter, HRA Pharma, and Vifor Pharma, and has lectured at educational events for Bayer AG, Gedeon Richter, and Sandoz AG. C.M.L. receives grant support from Bayer AG, Novo Nordisk and her husband works for Vertex. J.R. spouse receives salary and stock options from Merck & Co. K.V. receives research funding from Bayer Healthcare and Honorarium for Consultancy and Lectures from Bayer Healthcare, Grunenthal GmBH, AbbVie and Eli Lilly. T.D. is employee of Merck Healthcare KGaA, Darmstadt, Germany. T. S. is the co-founder and shareholder of Zoe Global Ltd. P.A.W.R. is an advisory board member for Bayer AG. O.U. lectured at educational events for Exeltis and Merck. K.L.T. report an endometriosis grant from Aspira which is not relevant to the submitted work. K.T.Z. and C.M.B. reported grants from Bayer AG, AbbVie Inc, Volition Rx, MDNA Life Sciences, Roche Diagnostics Inc. outside the submitted work. The remaining authors declare no competing interests.

Figures

Extended Data Figure 1.
Extended Data Figure 1.. Q-Q plots for genome-wide association results.
Q-Q plot for genome-wide association results for a. overall endometriosis, b. rASRM stage I/II endometriosis, c. rASRM stage III/IV endometriosis, d. endometriosis-associated infertility, e. only studies with >300 cases.
Extended Data Figure 2.
Extended Data Figure 2.. Manhattan plots for genome-wide association results.
Manhattan plot for genome-wide association results for a. overall endometriosis, b. rASRM stage I/II endometriosis, c. rASRM stage III/IV endometriosis, d. endometriosis associated infertility. The GWAS meta-analysis results are shown on the y-axis as −log10(P-value) and on the x-axis is the chromosomal location. The red vertical line illustrates the genome-wide significance (p<5×10⁻⁸) and the blue vertical line shows the nominal genome-wide results (p<1×10⁻⁵).
Extended Data Figure 3.
Extended Data Figure 3.. Comparison of mixed female and male controls GWAS meta-analysis vs. female only controls GWAS meta-analysis results.
Results from meta-analysis contrasting GWAS studies with mixed female and male controls (N cases=5,222, N controls=44,176) vs. GWAS studies with only female controls (N cases=44,176, N controls=657,747). Significant heterogeneity: p-value<1.19×10⁻³ (0.05/42). The error bars represent standard error estimates for the beta co-efficient estimates. * SNPs with nominal heterogeneity p-values: rs1430787, p=0.03, rs1451383, p=0.01.
Extended Data Figure 4.
Extended Data Figure 4.. Tissue-specific gene enrichment results.
Tissue-specific gene enrichment using RNA-Seq data across 35 human tissues from the Human Protein Atlas (a and b) and 29 human tissues from GTEx (c and d). The x-axis shows each of the tissues, and the y-axis represents the tissue-specific gene enrichment −Log10(P−Value) (left) and the fold-change values of the tissue-specific gene enrichment (right).
Extended Data Figure 5.
Extended Data Figure 5.. SKAP1/17q21.32 locus.
a. Illustration of the regional association plot for the SKAP1/17q21.32 locus including the 99% credible sets. eSMR endometrium SNP: SMR SNP identified as causal for endometriosis utilizing the eQTL data from endometrium; The shaded region in the credible sets panel is further annotated in panel c. b. SMR significant endometrial eQTL for HOXB9 (SMR p-value=2×10⁻⁶). The lower and upper bounds of the boxes represent the first and third quantiles, the whiskers extend 1.5 times the interquartile range from the bounds of the box and the line represents the median. c. position of the SMR-significant eQTL in the SKAP1/17q21.32 locus along with HOXB9 promoter-associated chromatin loops with anchor points containing the lead SNP and the SMR SNP. The SMR-significant SNP associated with expression of HOXB9 in endometrium (eQTL) and endometriosis is shown in black and the associated HOXB9¬ target is shown in red. Valid promoter-associated chromatin loops were generated from H3K27Ac HiChIP libraries from a normal immortalized endometrial cell line (E6E7hTERT) and three endometrial cancer cell lines (ARK1, Ishikawa and JHUEM-14).
Extended Data Figure 6.
Extended Data Figure 6.. sICAM-1 level results.
Box plots of log scale sICAM-1 levels in a. overall endometriosis cases (N=136) vs. controls (N=54), b. rASRM stage I/II cases (N=85) vs. controls and rASRM stage III/IV (N=51) vs. controls. Reported p-values are from the adjusted logistic regression model (see Supplementary Information: Methods) (Supplementary Table 19). The lower and upper bounds of the boxes represent the first and third quantiles, the whiskers extend 1.5 times the interquartile range from the bounds of the box and the line represents the median.
Extended Data Figure 7.
Extended Data Figure 7.. Single cell expression profiles.
Single cell expression profiles for 18/23 genes regulated by endometriosis risk variants in GTEx Multi-Gene Single Cell Viewer (5 were not included in the database). This is an aster plot where the fraction of cells in which a gene is detected is shown. The cells are categorised by cell-type.
Extended Data Figure 8.
Extended Data Figure 8.. Correlation of 42 GWAS loci between endometriosis surgical sub-types and adenomyosis.
Correlation between the effect sizes of 42 endometriosis-associated GWAS loci contrasting endometriosis surgical sub-types and adenomyosis: a. Adenomyosis vs. rASRM stage I/II, b. Adenomyosis vs. rASRM stage III/IV, c. Adenomyosis vs. endometrioma, d. Adenomyosis vs. deep lesions, e. Adenomyosis vs. superficial lesions. Minor allele frequency for each of the 42 variants is given by shade of grey: Lighter shade of grey designates a smaller MAF, darker shade of grey a larger MAF. Nominal associations (p<0.05) are annotated with locus name and larger circles. The solid black line represents the linear regression line and the dotted black line is the x=y with a slope of 1 for reference of change in ORs. Test statistics including p-values for all the associations are provided in Supplementary Table 21.
Extended Data Figure 9.
Extended Data Figure 9.. Genetic correlation results between only surgically or medically confirmed endometriosis and 32 traits/conditions.
Genetic correlation between only surgically or medically confirmed endometriosis (N=8,390 cases) and 32 immune/inflammatory, pain, reproductive, and metabolic traits/conditions using LD score regression analysis (LDSC). Heritability of each trait is noted in parenthesis on the x-axis. The significance threshold is adjusted for multiple testing using Bonferroni correction. Significant (p<1.56×10⁻³) correlations are denoted with a red star (*), nominal correlation (p<0.05) with a green star (*). Bars present the genetic correlation (rg) for each trait in relation to endometriosis and the error bars are standard errors. The exact p-values are provided in Supplementary Table 25.
Extended Data Figure 10.
Extended Data Figure 10.. Genetic correlation results between endometriosis and 19 brain imaging traits in UKBB.
Genetic correlation between 19 brain imaging traits in UKBB and a. endometriosis (N=58,961) and b. surgically or medically confirmed endometriosis (N=8,390 cases) using LD score regression analysis (LDSC). A total of 6 functional MRI measures (netmat_ICA_09Aug2017_001–006), structural MRI measures including 11 freesurfer derived variables (aseg_lh_volume_Left-Thalamus-Proper, aseg_lh_volume_Left-Hippocampus, aseg_lh_ volume_Left-Amygdala, aseg_lh_volume_Right-Thalamus-Proper, aseg_lh_volume_Right-Hippocampus, aseg_lh_volume_Right-Amygdala, aseg_lh_volume_CC_Posterior, aseg_lh_volume_CC_Mid_Posterior, aseg_lh_volume_CC_Central, aseg_lh_volume_CC_Mid_Anterior, aseg_lh_volume_CC_Anterior) and 2 FAST calculations for insula region (IDP_T1_FAST_ROIs_L_insular_cortex, IDP_T1_FAST_ROIs_R_insular_cortex) were analysed. Heritability of each trait is noted in parenthesis on the x-axis. Nominal correlations are denoted with a green star (*). Bars present the genetic correlation (rg) for each trait in relation to endometriosis and the error bars are standard errors. The exact p-values are provided in Supplementary Table 27 and 28.
Fig. 1.
Fig. 1.. Circular Manhattan plots for genome-wide association analysis for overall endometriosis, rASRM stage III/IV disease, rASRM stage I/II disease and infertility.
Circular Manhattan plots for genome-wide association analysis for overall endometriosis (blue), revised American Society of Reproductive Medicine (rASRM) stage III/IV disease (green), rASRM stage I/II disease (orange), and endometriosis associated infertility (yellow). Genome-wide significant signals are marked in red and their chromosomal location is denoted with dotted grey lines. The 6 loci with significantly larger effect sizes in rASRM stage III/IV vs. rASRM stage I/II analysis are annotated in green.
Fig. 2.
Fig. 2.. GDAP1/8q21.11 regional association results and summary data-based mendelian randomisation (SMR) evidence based on expression (eQTL) and methylation (mQTL) quantitative trait loci data in blood.
a) Illustration of the regional association plot for the GDAP1/8q21.11 locus. eSMR blood single nucleotide polymorphism (SNP): SMR SNP identified as causal for endometriosis utilizing the eQTL data from blood tissue. mSMR blood SNP: SMR SNP identified as causal for endometriosis utilizing the mQTL data from blood tissue. b) SMR significant blood based eQTL for GDAP1 and mQTL of probe cg23779890 located in GDAP1 gene are shown. c) The genic content and locations for the region are illustrated.
Fig. 3.
Fig. 3.. SRP14-AS1/15q15.1 regional association results and SMR evidence based on eQTL and mQTL data in endometrium and blood.
a) Illustration of the regional association plot for the SRP14-AS1/15q15.1 locus. eSMR endometrium SNP: SMR SNP identified as causal for endometriosis utilizing the eQTL data from endometrium; mSMR blood SNP: SMR SNP identified as causal for endometriosis utilising the mQTL data from blood tissue. eSMR blood SNP: SMR SNP identified as causal for endometriosis utilizing the eQTL data from blood tissue. SMR SNPs not passing the HEIDI-heterogeneity test are annotated in black. b) SMR significant eQTLs and mQTLs in the SRP14-AS1/15q15.1 locus along with SRP14 promoter associated chromatin loops with anchor points containing the lead SNP and the SMR SNPs. SMR significant SNPs associated with expression of SRP14 in endometrium and blood (eQTL), methylation at cg27155939 in blood (mQTL), and endometriosis are shown in black and the associated SRP14/CpG target is shown in red. Valid promoter associated chromatin loops were generated from H3K27Ac HiChIP libraries from a normal immortalized endometrial cell line (E6E7hTERT) and three endometrial cancer cell lines (ARK1, Ishikawa and JHUEM-14).
Fig. 4.
Fig. 4.. SYNE1/6q25.1 regional association results with 5 distinct signals and SMR evidence based eQTL and mQTL data in endometrium and blood.
Illustration of the regional association plot for the SYNE1/6q25.1 locus that includes 5 distinct signals from approximate conditional analysis. On the plot are also the SMR significant eQTL and mQTLs from endometrium and blood tissue along with promoter associated chromatin loops with anchor points containing the lead SNP and the SMR SNPs. Multiple distinct signals significantly associated with endometriosis were identified in this region and r2 values displayed are relative to the closest lead SNP. eSMR endometrium SNP: SMR SNP identified as causal for endometriosis utilizing the eQTL data from endometrium; mSMR endometrium SNP: SMR SNP identified as causal for endometriosis utilizing the mQTL data from endometrium; mSMR blood SNP: SMR SNP identified as causal for endometriosis utilising the mQTL data from blood tissue. eSMR blood SNP: SMR SNP identified as causal for endometriosis utilizing the eQTL data from blood tissue. SMR SNPs not passing the HEIDI-heterogeneity test are annotated in black. SMR significant SNPs associated with expression of ESR1 in blood (eQTL), methylation at cg24075332 (mQTL1), cg14416726 (mQTL2), cg18745416 (mQTL3) and cg01066157 (mQTL4) in blood, and endometriosis are shown in black and the associated ESR1/CpG targets are shown in red. Ovarian enhancers were available from the Roadmap Epigenomics Project. Valid promoter associated chromatin loops were generated from H3K27Ac HiChIP libraries from a normal immortalized endometrial cell line (E6E7hTERT) and three endometrial cancer cell lines (ARK1, Ishikawa and JHUEM-14).
Fig. 5.
Fig. 5.. Correlation of the effect sizes of lead SNPs between rASRM disease stage and surgical subtypes and extended of pelvic pain.
Correlation between the effect sizes of 42 endometriosis associated lead SNPs comparing rASRM stage III/IV disease vs. surgical subtypes (endometrioma; deep lesions; superficial lesions; panels a-c) and rASRM stage I/II, rASRM stage III/IV, deep lesions vs. risk of reporting more than 2 types of pelvic pain (panels d-f). Loci nominally associated (p<0.05) with individual sub-phenotypes are annotated with locus name and larger circles. Circle size represent significance level of correlation: Larger circles have smaller p-values and smaller circles have larger p-values. Solid black line represents the linear regression line, dotted black line is the x=y reference slope, dotted grey lines x=1 and y=1 are reference to odds ratio (OR). The grey error band represents 95% confidence interval. Test statistics including p-values for all the associations are provided in Supplementary Table 21.
Fig. 6.
Fig. 6.. Genetic correlation between endometriosis and 32 immune/inflammatory, pain, reproductive, and metabolic traits/conditions.
Genetic correlation between endometriosis and 32 immune/inflammatory, pain, reproductive, and metabolic traits/conditions using linkage disequilibrium score regression analysis (LDSC). Heritability of each trait is noted in parenthesis on the x-axis. The significance threshold is adjusted for multiple testing using Bonferroni correction. Significant (p<1.56×10⁻³) correlations are denoted with a red asterisk (*). Bars present the genetic correlation (rg) for each trait in relation to endometriosis and the error bars are standard errors. The exact p-values are provided in Supplementary Table 24.

References

    1. Zondervan KT, Becker CM & Missmer SA Endometriosis. N Engl J Med 382, 1244–1256 (2020). - PubMed
    1. Nnoaham KE et al. Impact of endometriosis on quality of life and work productivity: a multicenter study across ten countries. Fertil Steril 96, 366–373 e8 (2011). - PMC - PubMed
    1. ASRM. Revised American Society for Reproductive Medicine classification of endometriosis: 1996. Fertil Steril 67, 817–21 (1997). - PubMed
    1. Saha R et al. Heritability of endometriosis. Fertil Steril 104, 947–952 (2015). - PubMed
    1. Treloar SA, O’Connor DT, O’Connor VM & Martin NG Genetic influences on endometriosis in an Australian twin sample. sueT@qimr.edu.au. Fertil Steril 71, 701–10 (1999). - PubMed

Publication types