. 2023 Nov;41(11):1618-1632.
doi: 10.1038/s41587-023-01684-0. Epub 2023 Mar 13.

Single-cell transcriptomic atlas-guided development of CAR-T cells for the treatment of acute myeloid leukemia

Affiliations

Single-cell transcriptomic atlas-guided development of CAR-T cells for the treatment of acute myeloid leukemia

Adrian Gottschlich et al. Nat Biotechnol. 2023 Nov.

Abstract

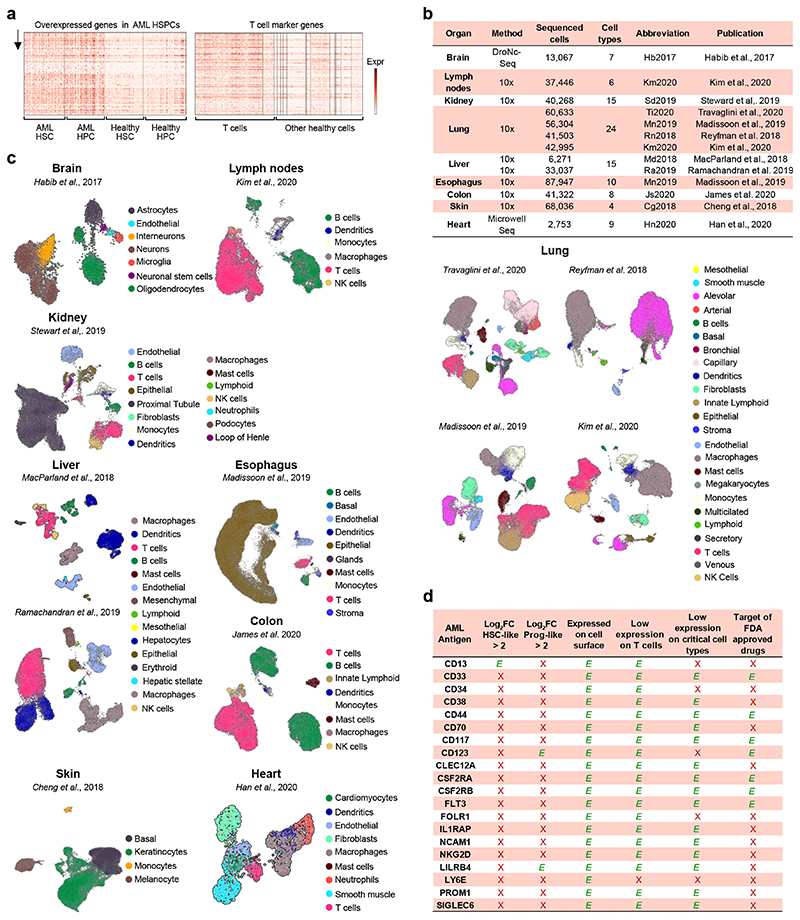
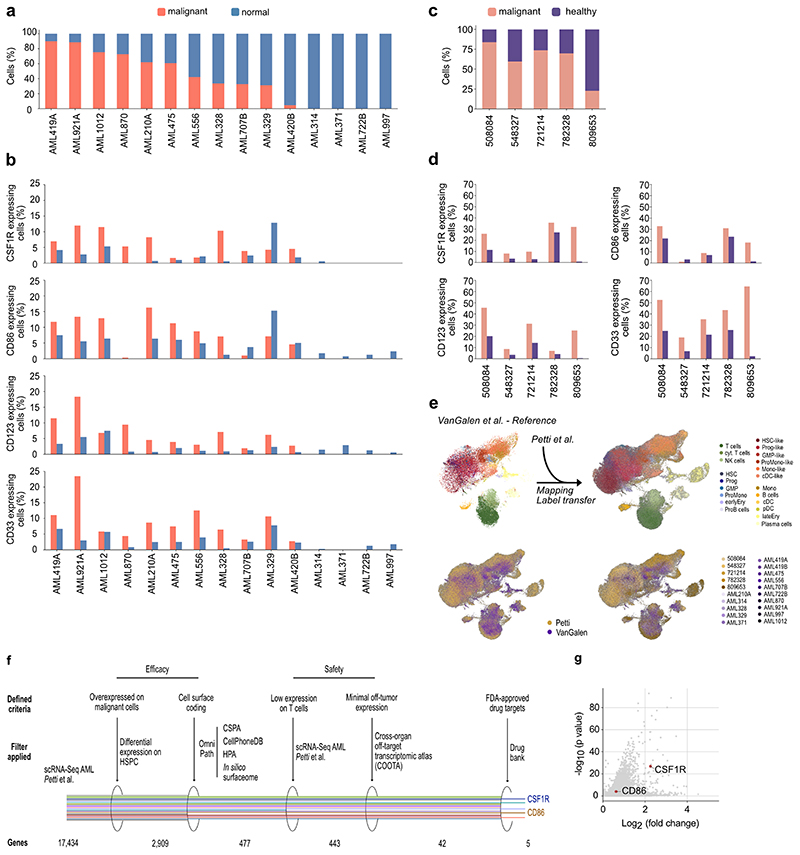
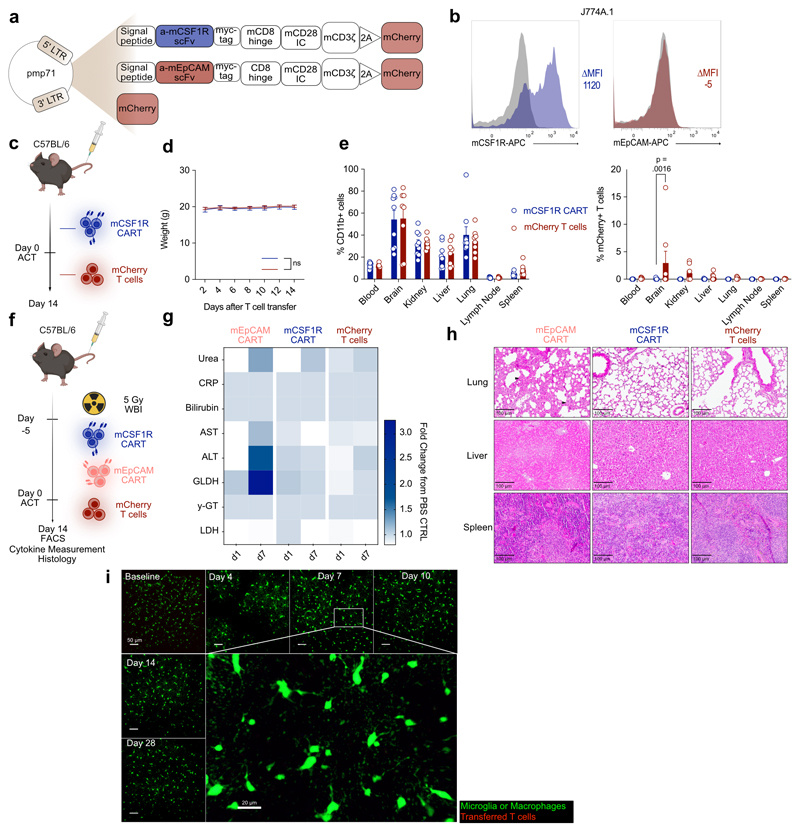
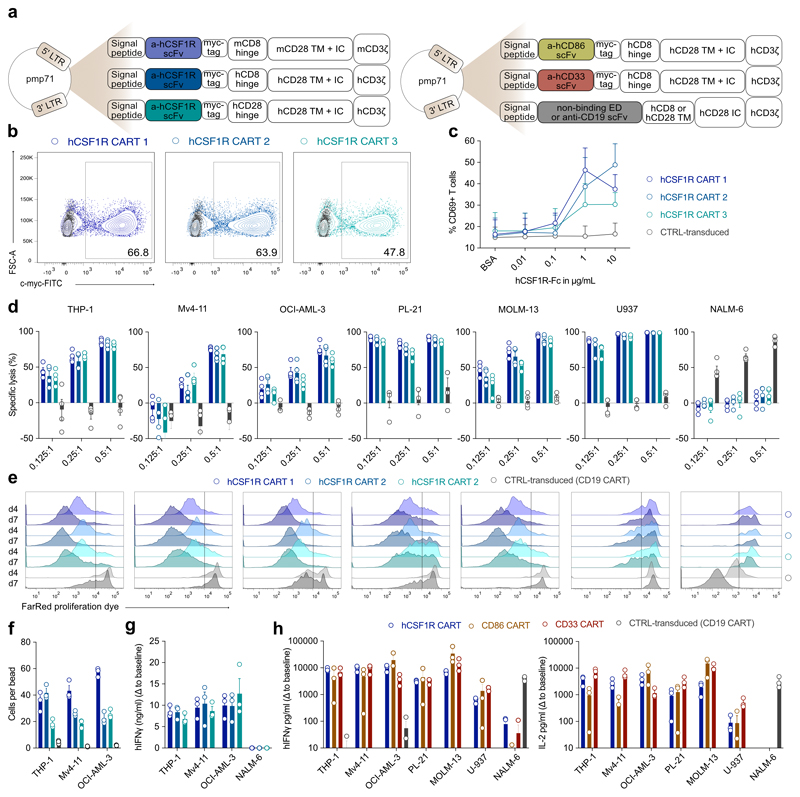
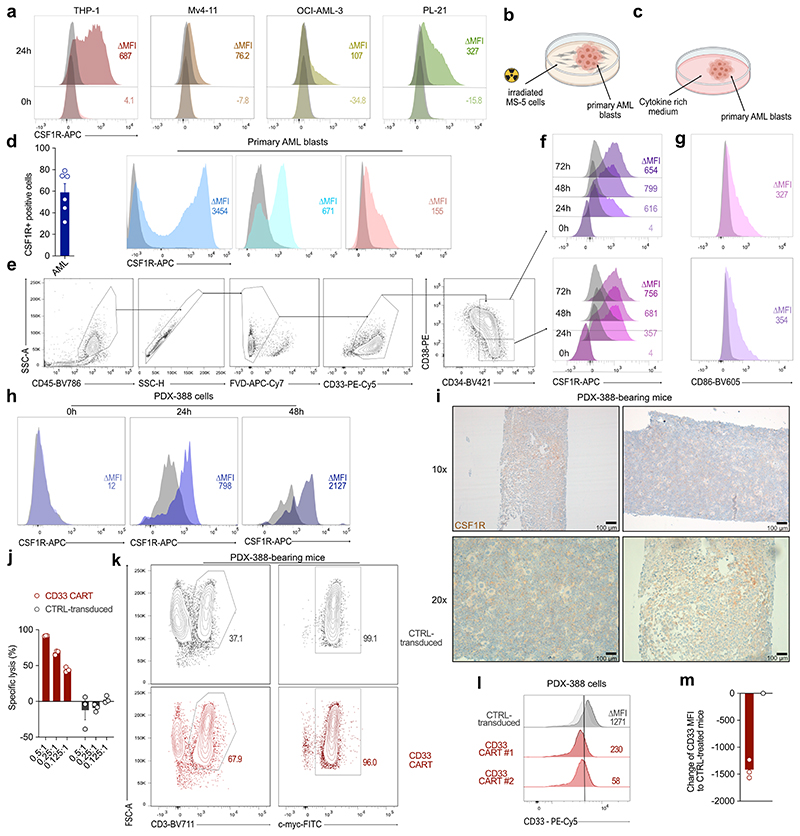
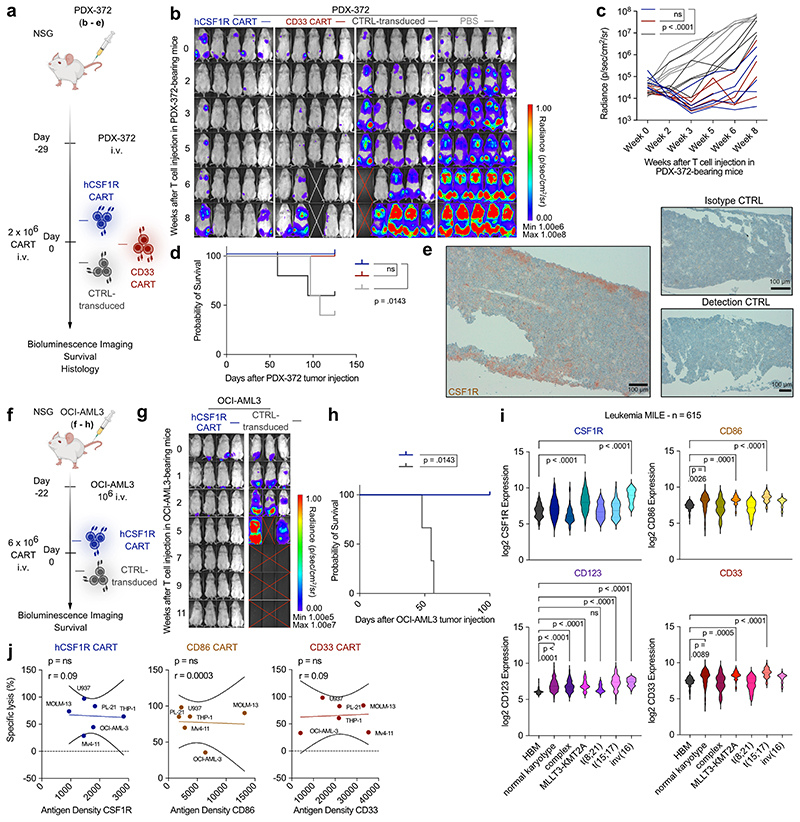
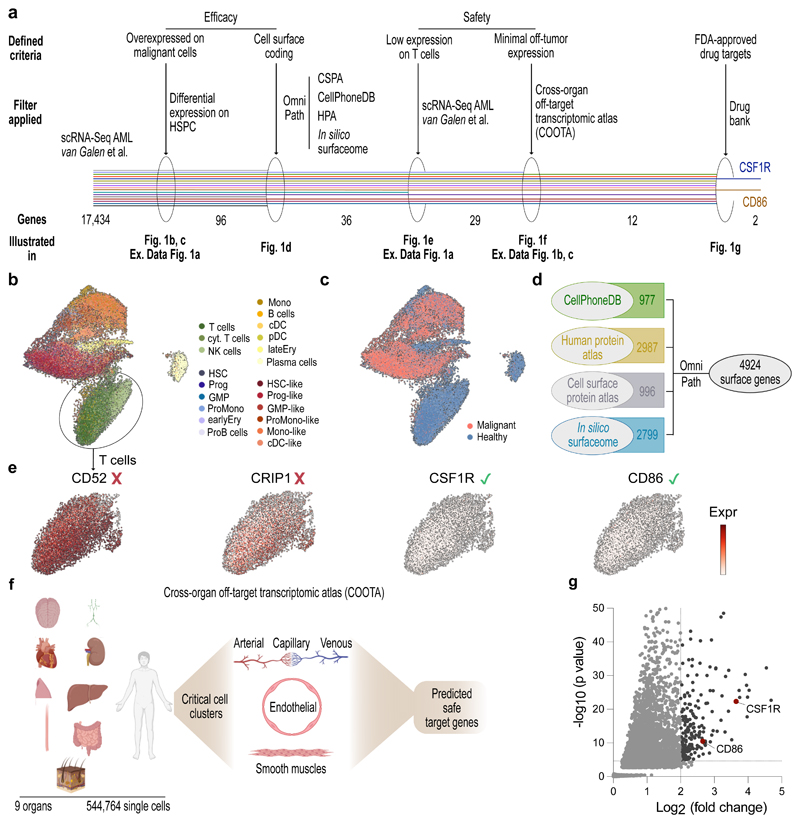
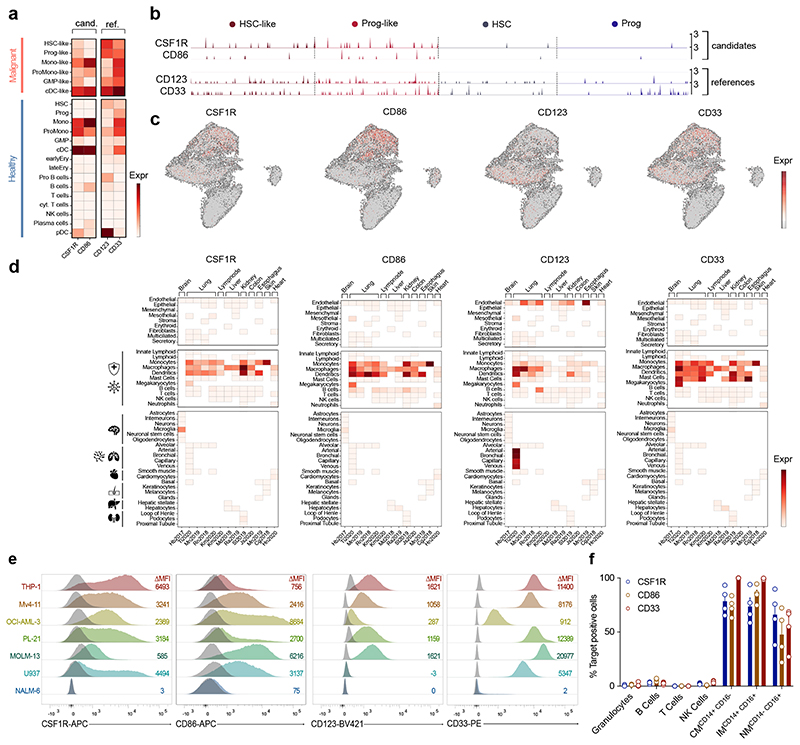
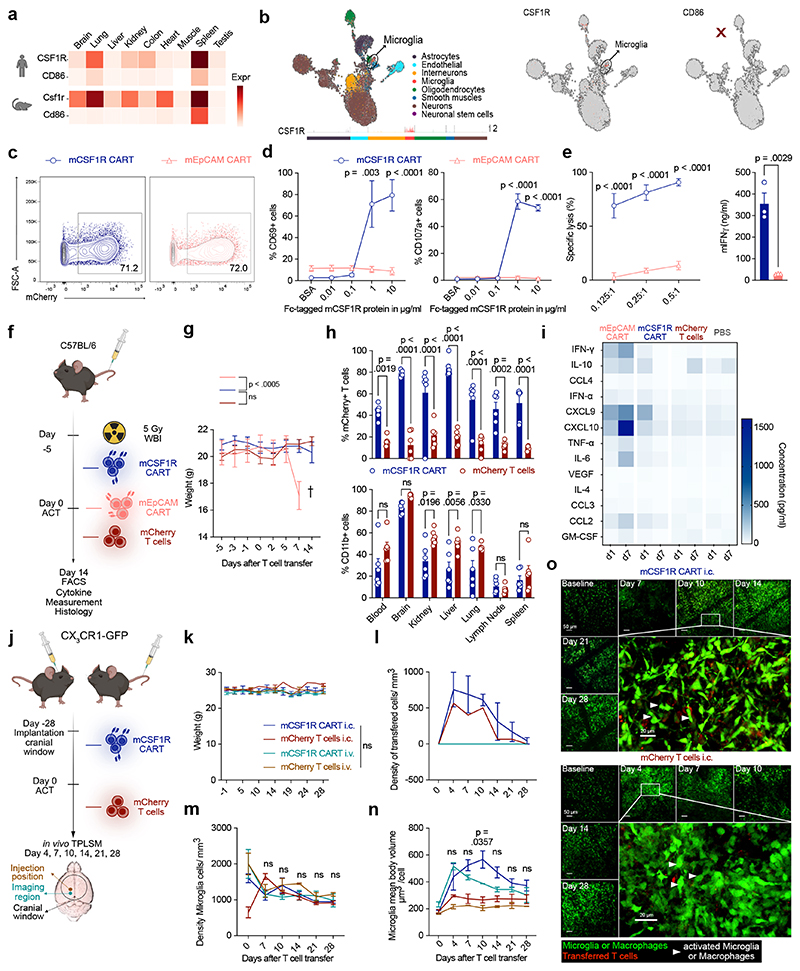
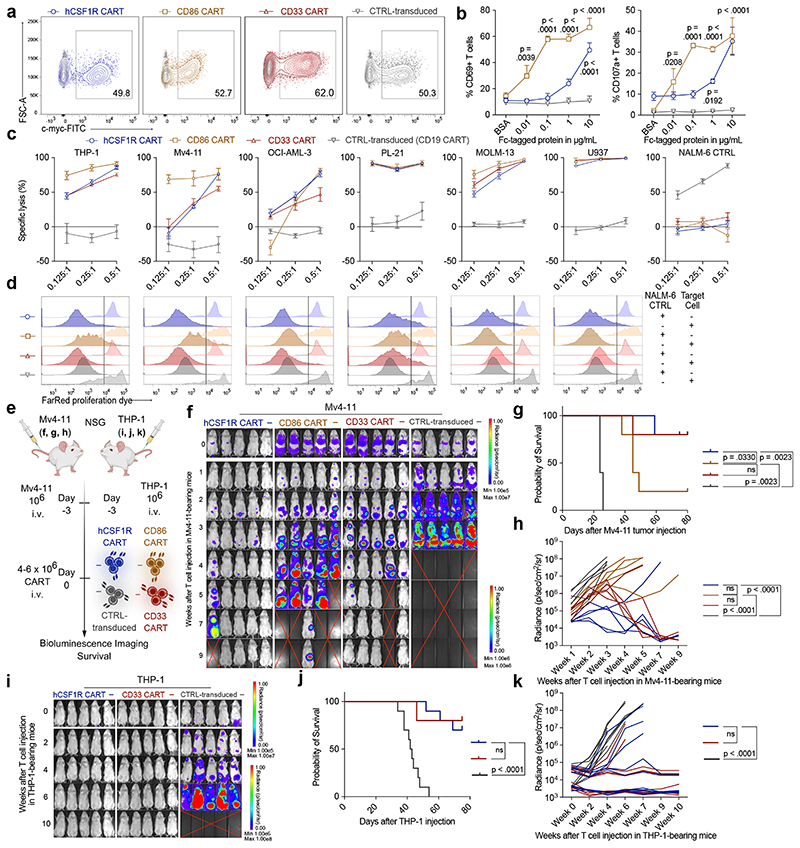
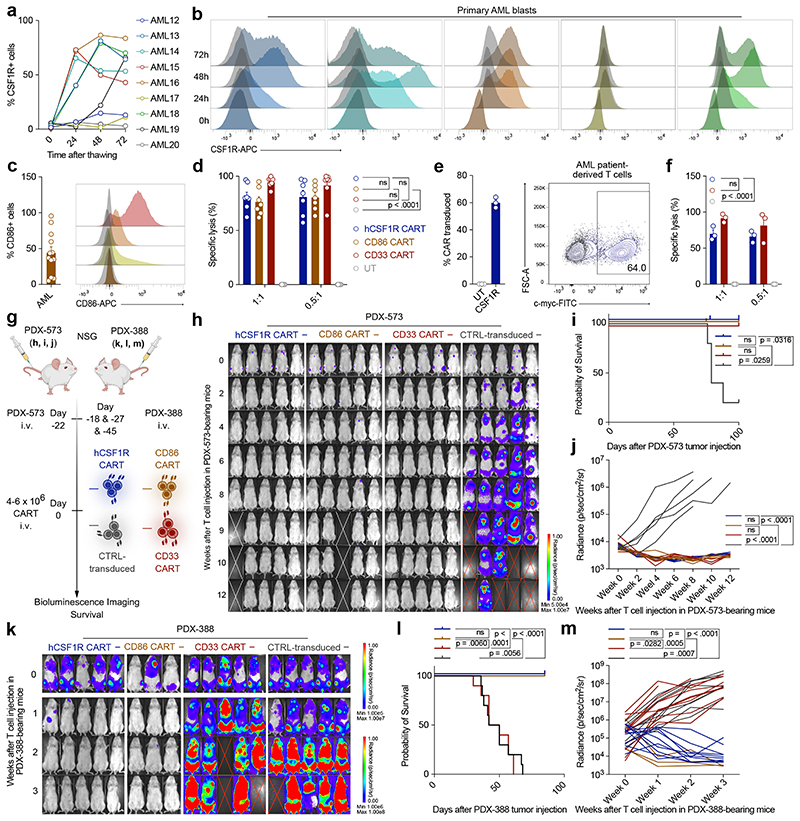
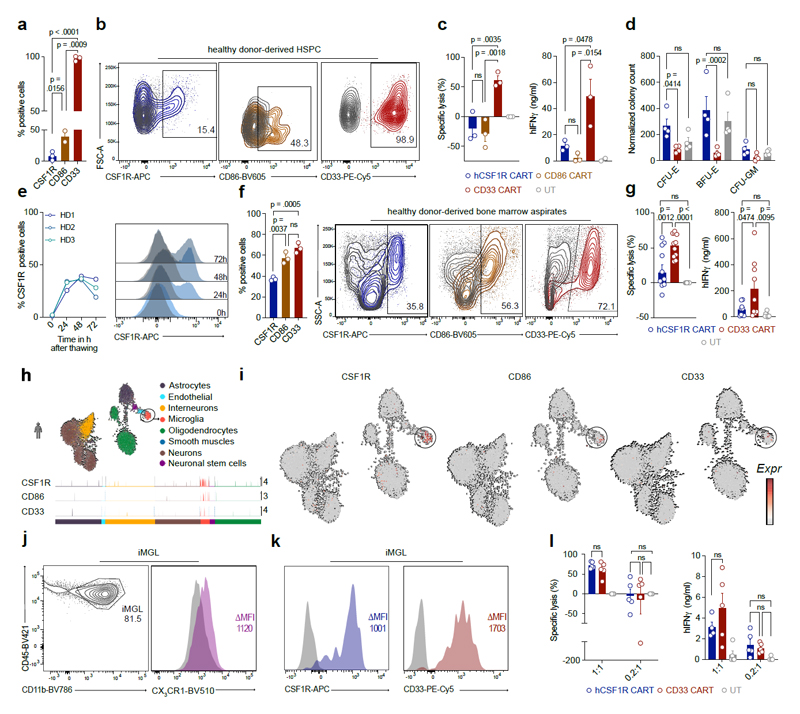
Chimeric antigen receptor T cells (CAR-T cells) have emerged as a powerful treatment option for individuals with B cell malignancies but have yet to achieve success in treating acute myeloid leukemia (AML) due to a lack of safe targets. Here we leveraged an atlas of publicly available RNA-sequencing data of over 500,000 single cells from 15 individuals with AML and tissue from 9 healthy individuals for prediction of target antigens that are expressed on malignant cells but lacking on healthy cells, including T cells. Aided by this high-resolution, single-cell expression approach, we computationally identify colony-stimulating factor 1 receptor and cluster of differentiation 86 as targets for CAR-T cell therapy in AML. Functional validation of these established CAR-T cells shows robust in vitro and in vivo efficacy in cell line- and human-derived AML models with minimal off-target toxicity toward relevant healthy human tissues. This provides a strong rationale for further clinical development.


Conflict of interest statement

Competing interests

Parts of this work have been performed for the doctoral thesis of M.T., R.G., D.D. and S.D., at Technische Universität München and Ludwig -Maximilians-Universität München. A.G., M.T., R.G., S.L., S.E., C.M. and S.K. submitted patent applications related to this work filed by the Ludwig-Maximilians-Universität München the University Hospital of the LMU Munich or the Helmholtz Centre Munich. S.K. has received honoraria from TCR2 Inc, Novartis, BMS and GSK. S.K. and S.E. are inventors of several patents in the field of immuno-oncology. S.K. and S.E. received license fees from TCR2 Inc and Carina Biotech. A.G. received research support from Tabby Therapeutics for work unrelated to the manuscript. S.K. and S.E. received research support from TCR2 Inc. and Arcus Bioscience for work unrelated to the manuscript.

F. M. received support for meeting attendance from Servier, AbbVie, Incyte, Gilead, Jazz Pharmaceuticals, Novartis, Teva, Pfizer, Amgen; received support for medical writing from Servier; received research grant from Apis Technologies, Daiichi Sankyo and received speaker honoraria from Servier, Jazz Pharmaceuticals and AbbVie.

W.F. received payment or honoraria for lectures, presentations, speakers bureaus, manuscript writing or educational events from Novartis, Abbvie, Pfizer, Amgen. W.F. received support for attending meetings and/or travel: Amgen, Gilead, Jazz Pharmaceuticals, Servier, Daiichi Sankyo. W.F. participates on a Data Safety Monitoring Board or Advisory Board: Amgen, ARIAD/Incyte, Pfizer, Novartis, Jazz Pharmaceuticals, Morphosys, Abbvie, Celgene, Stemline, Clinigen.

The remaining authors declare no competing interests.

Figures

Extended Data Figure 1
Extended Data Figure 1. Summary of the cross-organ off-target transcriptomic atlas (COOTA).
(a) Top 100 overexpressed genes in AML HSPC (left) and healthy T cells (right) from differential expression analysis. Normalized expression values were logarithmized and scaled to unit variance. (b) Overview of 11 scRNA-seq datasets of various healthy tissues used to quantify off-target antigen expression. (c) UMAP plots of 11 scRNA-seq datasets with colors highlighting clustering into respective cell types. Cell annotations were provided by the authors of the respective studies. (d) Current CAR targets in AML were cross-referenced to filters used for the single cell-based target screening approach. OE HSC-/Prog-like: overexpressed on HSC-/Prog-like cells with log fold change > 2 and FDR-adjusted p ≤ 0.01, using a t-test with overestimated variance. Red cross: Antigen did not fulfill the respective threshold or criteria. Green check: Thresholds or criteria were passed.
Extended Data Figure 2
Extended Data Figure 2. CSF1R and CD86 are consistently expressed across multiple patients with differing molecular subtypes.
(a, c) Amount of malignant and normal cells per AML patient of van Galen et al. (a) or Petti et al. (c). (b, d) Percentage of malignant and normal cells expressing target genes CSF1R, CD86 and reference genes CD123, CD33 for each sequenced AML patient of van Galen et al. (b) or Petti et al. (d). (e) Data from van Galen et al. was used as a reference (top left) to map cells from Petti et al. (top right) using scANVI. UMAP representation showing the mapped query and reference data together (bottom). (f) Computational CAR target antigen identification using the mapped dataset of Petti et al. by stepwise evaluation against a set of criteria for an ideal and effective CAR target antigen. The decreasing number of screened AML target genes are shown on the bottom. CSPA: Cell surface protein atlas; HPA: Human protein atlas. (g) Volcano plot showing CD86 and CSF1R target genes with their respective FDR-adjusted log10 p-value and log2 fold changes from differential expression analysis between malignant HSPC-like and healthy HSPC using a t-test with overestimated variance.
Extended Data Figure 3
Extended Data Figure 3. mCSF1R CART do not persist in immunocompetent mice.
(a) Construct design of mCSF1R or mEpCAM CART or mCherry T cells. (b) Representative histograms of mCSF1R or mEpCAM expression on J774A.1 cells. Staining was carried out twice. (c) Summary of treatment schedule for in vivo toxicity assessment of mCSF1R CART. (d) Mean weight curves of mice treated with 3 x 10⁶ mCSF1R CART or mCherry T cells. n = 10 mice per group. Error bars indicate s.e.m. (e) Quantification of tissue-resident CD11b+ cells (left) or mCherry+ T cells of parent population (right, parent population: CD3 and CD8 positive cells) in different organs by flow cytometry. Data are mean ± s.e.m. of n = 10 mice. (d, e) Statistical significance was calculated using two-way ANOVA with Šidák multiple comparison correction. (f) Scheme of treatment schedule for in vivo toxicity assessment of mCSF1R CART. WBI, whole body irradiation. Mice were treated with 3 x 10⁶ mCSF1R CART or mCherry T cells per mouse. 6 x 10⁶ mEpCAM CART were transferred as a positive control. (g) Serum levels of indicated markers one (d1) or seven (d7) days after ACT. Depicted is the fold change of serum levels of the indicated groups from the PBS-treated control group. CRP, C-reactive protein; AST, aspartate aminotransferase; ALT, alanine aminotransferase; GLDH, glutamate dehydrogenase; γ-GT, gamma-glutamyl-transferase; LDH, lactate dehydrogenase. n = 3 mice per group. Statistically significant increases in the serum of mEpCAM CART treated mice compared to mCSF1R CART or control-treated mice at day 7 were observed for GLDH (p < 0.0001). (h) Histopathological analysis of indicated organs after treatment with mEpCAM or mCSF1R CART or mCherry T cells. Representative images of n = 3 mice per group. Signs of organ damage are indicated in the picture: black arrowhead: thickening of alveolar epithel. (i) Representative maximum intensity projection of microglia (green) and macrophages (green) in CX3CR1-GFP mice on days 0 (baseline), 4, 7, 10, 14, 21 and 28 after intravenous injection of 107 mCSF1R CART (red). Depth from brain surface: 0-100 μm. Scale bars as depicted: 50 μm and 20 μm. mCSF1R CART: i.c. injection, n = 5 mice; i.v. injection, n = 3 mice; mCherry T cells: i.c./ i.v. injection = 2 mice.
Extended Data Figure 4
Extended Data Figure 4. Assessment of different hCSF1R CAR constructs in vitro.
(a) Construct design of all anti-human constructs used throughout the course of the study. (b) Representative flow cytometric images of construct expression on primary human T cells. (c) Activation of different hCSF1R CART after incubation with plate-bound hCSF1R protein quantified by flow cytometry. (d) T cells expressing different hCSF1R CAR constructs were co-cultured with luc+ target antigen expressing AML tumor cell lines or antigen negative NALM-6 control cells for 48 hours at the indicated E:T ratios. Cell lysis was quantified by BLI. (e) Proliferation dye-labeled hCSF1R CART were co-cultured with respective cell lines for 4 or 7 days at a E:T ratio of 0.5:1. Proliferation was subsequently assessed by trace dilution. One representative image of three different donors is shown. (f) Bead quantified T cell numbers. (g) Secretion of IFNγ by T cells transduced with different hCSF1R CAR constructs after co-culture with AML cell lines. (h) Secretion of IFNγ (left) or IL-2 (right) of hCSF1R, CD86 or control CART in co-culture with AML cell lines. (c, d, f - h) Data are mean ± s.e.m. of three independent donors. LTR, long terminal repeat; scFv, single chain fragment variable; TM, transmembrane, IC, intracellular, ED, extracellular domain, CTRL-transduced, control-transduced.
Extended Data Figure 5
Extended Data Figure 5. CSF1R is highly expressed on primary AML blasts.
(a) Representative histograms of CSF1R expression on AML cell lines after freeze and thaw cycles. (b, c) Schematic of culture methods used to cultivate primary AML samples throughout the course of the study. (d) Expression of CSF1R on primary AML samples after 24 to 48 hours of culture in cytokine rich medium. Left: Percentage positive cells gated to isotype. Each dot represents different primary AML samples. Right: Representative flow cytometric images from three different AML samples. Data are mean ± s.e.m. from six different donors. (e) Gating strategy to identify CD34+ CD38± malignant HSPC. (f, g) Expression of target antigens (CSF1R, f; CD86, g) on malignant HPC (top) and HSC (bottom). (h) Expression of CSF1R on PDX-388 sample at indicated time points after thawing. (i) IHC staining of human CSF1R in the bone marrow of control-treated PDX-388-bearing mice. Shown are two representative pictures (right, left) in two different magnifications (top 10x, bottom 20x). (j) Left: CD33 CART used for i.v. injection into PDX-388-bearing mice (Fig. 5 k - m) were co-cultured ex vivo with luc+ Mv4-11 tumor cells for 48 hours at indicated E:T ratios. Specific lysis was quantified by BLI. Shown is mean ± s.e.m. of three biological replicates. Experiment was carried out twice. (k) Representative flow cytometric image of percentage of CD3 positive T cells (left) and percentage of CAR (c-myc) positive T cells (right) in the blood of PDX-388-bearing mice. (l, m) Ex vivo CD33 expression on PDX-388 AML blasts in the bone marrow after treatment with CD33 CART or CTRL-transduced T cells (CD19 CART) measured by flow cytometry. Depicted are representative histograms (l) or the change of CD33-PE-Cy5 MFI in CD33 CART treated mice compared to CTRL-transduced treated mice (m). (m) Data are mean ± s.e.m. from n = 3 mice injected with CD33 CART compared to CTRL-transduced mouse. (k - m) n = 3 mice injected with CD33 CART), n = 1 mouse injected with CTRL-transuced T cells.
Extended Data Figure 6
Extended Data Figure 6. hCSF1R CAR T cells are effective in vivo.
(a) Treatment scheme used for PDX-372 model. (b - d) BLI images (b), BLI quantification of tumor-burden (c) and survival curves (d) of PDX-372 tumor-bearing mice injected with 2 x 10⁶ hCSF1R, CD33 CART or control-transduced T cells (n = 5 mice per group). (b) White cross, censored mice; red cross, mice succumbed to disease. (e) IHC staining of human CSF1R in the bone marrow of control-treated PDX-372-bearing mice. Left: IHC for human CSF1R. Right: Isotype (top) and detection system control (bottom) for CSF1R IHC staining. (f) Schematic of treatment scheme used for OCI-AML3 cell line xenograft model. (g, h) BLI images (g) and survival curves (h) of OCI-AML3 tumor-bearing mice injected with 6 x 10⁶ hCSF1R CART or control-transduced T cells (n = 3 - 4 mice per group). (g) Red cross, mice succumbed to disease. (a - h) Statistical significance was calculated using two-way ANOVA with Sidak multiple comparison correction. (i) log2 expression of CSF1R and CD86 target antigens or CD123 and CD33 controls in bulk RNA-sequencing dataset of the Leukemia MILE study (n = 615 different patients). HBM, healthy bone marrow. Data was obtained from bloodspot.eu. Dashed line represents the median, dotted line the interquartile ranges. Statistical significance was calculated using ordinary one-way ANOVA with Sidak multiple comparison correction. (j) Simple linear regression analysis of in vitro lysis of CAR T cells and target antigen density of the indicated AML cell line measured by flow cytometry. r = spearman correlation coefficient, p = p-value. Three independent antigen density measurements were used to perform regression analysis. For Kaplan-Meier-Curves, statistical significance was calculated with log-rank test.
Figure 1
Figure 1. A single-cell RNA Seq-based screening approach identifies CSF1R and CD86 as potential CAR targets in AML.
(a) Workflow of computational CAR target antigen identification by stepwise evaluation against a set of criteria for an ideal and effective CAR target antigen. The decreasing number of screened AML target genes are shown on the bottom. CSPA: Cell surface protein atlas; HPA: Human protein atlas. (b, c) UMAP showing 28,404 healthy and malignant cells from data of 15 previously published AML patients harboring 15 different mutations. Normalized gene expression values were log-transformed. Cell annotations were provided by the authors. (d) Summary of databases used to identify cell surface coding genes. (e) Quantification of T cell expression of newly identified targets. Red cross: Targets with high expression on T cells, which were excluded from further analyses. Green check: No significant expression on T cells. (f) Harmonization of 11 scRNA-Seq datasets from nine healthy human tissues into a cross-organ off-target transcriptomic atlas (COOTA) consisting of 544,764 cells. A detailed summary of all used datasets is provided in Extended Data Fig. 1b. Targets highly expressed in non-immune cell lineages or on cell types in direct proximity to infused T cells (critical cell clusters: arterial, capillary, venous, endothelial and smooth muscle cells) were excluded from further analysis (g) Volcano plot showing the remaining two target antigens with their respective FDR-adjusted log10 p-value and log2 fold changes from differential expression analysis between malignant HSPC-like and healthy HSPC using a t-test with overestimated variance. Dotted lines indicate applied thresholds at log2fc=2 and p-value=0.01.
Figure 2
Figure 2. CSF1R and CD86 are preferentially expressed on malignant HSPC-like compared to healthy HSPC and off-tumor expression is restricted to infiltrating or tissue-resident immune cells.
(a) Expression of target and reference genes (CD123, CD33) on single healthy and malignant cell types. Normalized expression values were log-transformed and scaled to unit variance. (b) Expression of CSF1R and CD86 target genes in malignant (HSC-like, Prog-like; left) and healthy (HSC, Prog; right) stem cells. For visualization purposes, normalized expression values of healthy HSPC and a random subsample of malignant HSPC were log-transformed and scaled to unit variance. Each peak corresponds to a cell, peak height indicates expression intensity. (c) Expression of CSF1R and CD86 target genes in healthy and malignant cells of 15 AML patients. Normalized gene expression values were log-transformed and visualized in a UMAP embedding. (d) Single-cell cross-organ off-target transcriptomic atlas screening for target (CSF1R, CD86) and reference (CD123, CD33) genes. Single-cell transcriptomic atlas consists of a total of 544,764 sequenced cells comprising 9 different organs. Each field represents the mean expression value per cluster. Blank fields indicate cell types not present in a study. (e) Representative flow cytometric images of target gene expression on a panel of six different AML cell lines or NALM-6 control cells. Staining for target antigens was carried out at least twice. (f) Expression of target antigens on human immune cell population quantified by flow cytometry. Data are mean ± s.e.m. of four different donors. CM, classical monocytes; IM, intermediate monocytes; NM, non-classical monocytes.
Figure 3
Figure 3. mCSF1R CART do not cause toxicity in mice.
(a) Target expression (transcripts per million) across organs in human (top) or mouse (bottom) quantified using bulk RNAseq. (b) Target expression in single mouse brain cells. UMAP embedding of sequenced brain cells (left). Each peak corresponds to a cell, peak height indicates expression intensity. Normalized, log-transformed antigen expression per cell type (right). (c) Construct expression on transduced primary murine T cells. (d) Activation of mCSF1R or mEpCAM CART after incubation with plate-bound mCSF1R measured by flow cytometry. (e) mCSF1R or mEpCAM CART co-cultured with J774A.1-Luc+ for 48 hours. Cell lysis quantified by BLI (left). Secretion of IFNγ quantified by ELISA (right). (d, e) Data are mean ± s.e.m of three independent experiments. (e) Right: statistical significance calculated with unpaired t test. (f) Treatment schedule for in vivo toxicity assessment of mCSF1R CART. WBI, whole body irradiation. (g) Weight curves of mice treated with 3 x 10⁶ mCSF1R CART (n = 9) or mCherry T cells (n = 11). 6 x 10⁶ mEpCAM CART (n = 5) were transferred as a toxicity control. Error bars indicate s.e.m. (h) Quantification of mCherry+ T cells of parent population (left; parent population: CD3+-CD8+ cells), or CD11b+ cells (right) by flow cytometry. Data are mean ± s.e.m. of n = 6 mice. Shown statistical significance applies to d7. (i) Serum cytokine levels one (d1) or seven (d7) days after ACT. Cytokine levels measured with LEGENDplex™. n = 3 mice. Statistically significant increases in serum cytokine levels (mEpCAM versus mCSF1R CART or mCherry T cell-treated mice) at d7: IFN-γ (p = 0.0371), CXCL9 (p = 0.0096) and CXCL10 (p < 0.0001). (j)Treatment regimen to assess neurological toxicity in CX3CR1-GFP reporter mice. (k) Weight curves of mice after intracranial (i.c. – 2 x 10⁵) or intravenous (i.v. – 3 x 10⁶) injection of mCSF1R CART or mCherry T cells. Quantification of transferred T cells (l) or microglia (m) by TPLSM. (m) Indicated p-values apply to comparison between all groups. (n) Mean body volume of microglia (MBV). P-values of comparison mCSF1R CAR i.c. versus mCherry T cells i.c. (o) Representative maximum intensity projection of microglia, macrophages (green) in CX3CR1-GFP mice after i.c. injection mCSF1R CART (red, top) or mCherry T cells (red, bottom). White Arrowhead: Microglia and macrophages with higher mean density and MBV. Depth from brain surface: 0 - 100 μm. Scale bars: 50 μm and 20 μm. (k, m, n) Data are mean ± s.e.m. mCSF1R CART: i.c., n = 5; i.v., n = 4; mCherry T cells: i.c./ i.v. n = 2. (l) Data are mean ± s.e.m. mCSF1R CART: i.c., n = 3; i.v., n = 4; mCherry T cells: i.c. one control mouse. For all panels, if not otherwise indicated, statistical significance was calculated using two-way ANOVA with Šidák multiple comparison correction.
Figure 4
Figure 4. Anti-target CAR-T cells are functional and efficiently lyse AML cell lines in vitro and in vivo.
(a) Representative flow cytometric images of construct expression on primary human T cells. (b) Activation of hCSF1R or CD86 CART after incubation with plate-bound hCSF1R or hCD86 protein was quantified using flow cytometry. Data are mean ± s.e.m of three different donors. (c) hCSF1R or CD86 CART were co-cultured with luc+ target antigen expressing AML tumor cell lines or antigen negative NALM-6 control cells expressing luciferase for 48 hours at indicated E:T ratios. CD33 and CD19 CART (CTRL-transduced) were used as positive or negative controls, respectively. Cell lysis was quantified by BLI. Data are mean ± s.e.m of three different donors. (d) Proliferation dye-labeled CART were co-cultured with above indicated cell lines for 7 days at a E:T ratio of 0.5:1. One representative image of three different donors is shown. (e) Schematic of treatment scheme used for in vivo experiments. BLI images (f) survival curves (g) and quantification of tumor-burden (h) in Mv4-11-tumor bearing mice after treatment with different CART. (f - h) n = 5 mice per group. (i - k) BLI images (i), survival curves (j) and quantification of tumor burden (k) of THP-1-bearing mice treated with hCSF1R CART or control-transduced T cells. n = 10 mice per group. Shown is pooled data ± s.e.m. from two independent experiments. (f, i) Red cross, mice succumbed to disease. For all experiments, statistical significance was calculated using two-way ANOVA with Šidák multiple comparison correction. For Kaplan-Meier-Curves, statistical significance was calculated with log-rank test.
Figure 5
Figure 5. CSF1R and CD86 are readily detected on primary AML samples and hCSF1R CART show efficient lysis of primary AML samples in vitro and in vivo.
(a) Expression of CSF1R following thawing of primary AML samples over 72 h. Each line represents one patient. (b) Representative histograms of CSF1R (colored) expression on primary AML samples over time in comparison to isotype control (grey). (c) Expression of CD86 on primary AML samples. Each dot represents one patient. Left: Percentage positive cells gated to isotype. Right: Representative histograms of four different patients. Data are mean ± s.e.m of eleven different primary AML samples. (d) hCSF1R, CD86 or CD33 CART or untransduced T cells were co-cultured with primary AML samples for 72 hours. Specific lysis was assessed using flow cytometry. Data are mean ± s.e.m of seven different primary AML samples. Indicated p-values apply to E:T ratio 0.5:1. (e) hCSF1R CAR construct transduced into T cells of AML patients. Left: Transduction efficiency of AML patient-derived CAR-T cells. Right: Representative flow cytometric image. (f) Patient-derived CART or untransduced T cells were co-cultured with primary AML samples of the same donor. Experiments were carried out as outlined in (d). (e, f) Data are mean ± s.e.m of three different autologous donors. (g) Summary of treatment scheme used for in vivo experiments. (h - j) BLI images (h), survival curves (i) and BLI quantification of tumor-burden (j) of PDX-573 tumor-bearing mice injected with 6 x 10⁶ hCSF1R, CD33 CART or control-transduced T cells (n = 5 mice per group). (j) P-values calculated at week 8. (h) White cross, censored mice; red cross, mice succumbed to disease. (k - m) BLI images (k), survival curves (l) and BLI quantification of tumor-burden (m)of PDX-388 tumor-bearing mice injected with 6 x 10⁶ hCSF1R, CD86, CD33 CART, control-transduced T cells or PBS. (n = 3 - 10 mice per group). CD86 CART treatment was carried out separately. For all experiments statistical significance was calculated using two-way ANOVA with Šidák multiple comparison correction. For Kaplan-Meier-Curves, statistical significance was calculated with log-rank test.
Figure 6
Figure 6. hCSF1R CART show better discriminatory capacity towards healthy human hematopoietic cells than CD33 CART.
(a) Target expression on MACS-enriched, bone marrow-derived CD34+ HSPC. Data are mean ± s.e.m of two to three independent, pooled HSPC donors. (b) Representative flow cytometric image of target expression on HSPC. (c) CSF1R, CD86 or CD33 CART or untransduced T cells were co-cultured with HSPC for 24 hours at an E:T ratio of 2:1. Lysis of HSPC was quantified by flow cytometry (left). IFNγ secretion measured by ELISA (right). (d) CSF1R, CD33 CART or untransduced T cells were co-cultured with HSPC for 24 hours at an E:T ratio of 2:1 and CFU assay was performed. Colony count was quantified after 14 days. (c, d) Data are mean ± s.e.m. from three (c) or four (d) different donors. (e) CSF1R expression on healthy donor-derived bone marrow aspirates (HD). Left: Percentage CSF1R positive cells gated to isotype. Right: Representative histograms of CSF1R expression on HD. (f) Quantified target expression on HD. Left: Percentage positive cells gated to isotype. Right: Representative flow cytometric image. (e, f) Data are mean ± s.e.m. from three different donors. (g) hCSF1R, CD33 CART or untransduced T cells were co-cultured with HD for 72 hours at the indicated E:T ratios. Left: Off-tumor lysis of CART assessed by flow cytometry. Right: Activation of T cells quantified by IFNγ secretion. Data are mean ± s.e.m. from 11 different samples. (h, i) Quantification of log-transformed normalized target expression in 13,067 single human brain cells. Each peak corresponds to a cell, peak height indicates expression intensity. (i) UMAP plot illustrating expression patterns of CSF1R, CD86 and CD33 in human brain cells. (j) Phenotype of human iPSC-derived microglia-like cells (iMGL). (k) Representative histograms of CSF1R and CD33 expression on iMGL. (l) hCSF1R CART, CD33 or untransduced T cells were co-cultured with iMGL for 24 hours at indicated E:T ratios. Lysis of iMGL was quantified by flow cytometry (left). T cell activation quantified by ELISA (right). Data are mean ± s.e.m. from five T cell donors. For all experiments statistical significance was calculated using two-way ANOVA with Šidák multiple comparison correction.

References

    1. June CH, Sadelain M. Chimeric Antigen Receptor Therapy. New England Journal of Medicine. 2018;379:64–73. doi: 10.1056/NEJMra1706169. - DOI - PMC - PubMed
    1. Maude SL, et al. Tisagenlecleucel in Children and Young Adults with B-Cell Lymphoblastic Leukemia. N Engl J Med. 2018;378:439–448. doi: 10.1056/NEJMoa1709866. - DOI - PMC - PubMed
    1. Schuster SJ, et al. Tisagenlecleucel in Adult Relapsed or Refractory Diffuse Large B-Cell Lymphoma. N Engl J Med. 2019;380:45–56. doi: 10.1056/NEJMoa1804980. - DOI - PubMed
    1. Raje N, et al. Anti-BCMA CAR T-Cell Therapy bb2121 in Relapsed or Refractory Multiple Myeloma. N Engl J Med. 2019;380:1726–1737. doi: 10.1056/NEJMoa1817226. - DOI - PMC - PubMed
    1. Lesch S, et al. Determinants of response and resistance to CAR T cell therapy. Semin Cancer Biol. 2020;65:80–90. doi: 10.1016/j.semcancer.2019.11.004. - DOI - PubMed