. 2023 Nov;41(11):1549-1556.
doi: 10.1038/s41587-023-01702-1. Epub 2023 Mar 13.

An integrated platform for high-throughput nanoscopy

Affiliations

An integrated platform for high-throughput nanoscopy

Andrew E S Barentine et al. Nat Biotechnol. 2023 Nov.

Abstract

Single-molecule localization microscopy enables three-dimensional fluorescence imaging at tens-of-nanometer resolution, but requires many camera frames to reconstruct a super-resolved image. This limits the typical throughput to tens of cells per day. While frame rates can now be increased by over an order of magnitude, the large data volumes become limiting in existing workflows. Here we present an integrated acquisition and analysis platform leveraging microscopy-specific data compression, distributed storage and distributed analysis to enable an acquisition and analysis throughput of 10,000 cells per day. The platform facilitates graphically reconfigurable analyses to be automatically initiated from the microscope during acquisition and remotely executed, and can even feed back and queue new acquisition tasks on the microscope. We demonstrate the utility of this framework by imaging hundreds of cells per well in multi-well sample formats. Our platform, implemented within the PYthon-Microscopy Environment (PYME), is easily configurable to control custom microscopes, and includes a plugin framework for user-defined extensions.


Conflict of interest statement

Competing Interests

J. B. discloses a financial interest in Bruker Corp. and Hamamatsu Photonics. All other authors declare no competing interests.

Figures

Figure 1:
Figure 1:
High-throughput SMLM. (a) Example timelines for SMLM acquisition of 36,000-frame ROIs performed at 50 FPS manually and automated at 800 FPS. (b) Schematic of automated multicolor 3D biplanar-astigmatism SMLM microscope. Mot. S.: motorized sample stage; OBJ: objective; DM1–3: dichroic mirrors; QBF: quad-band filter; TL: tube lens; CL: cylindrical lens; L1–2: relay lenses; BM: biplane module; BS: beamsplitter cube; Man. S.: manual translation stage; EF1–2: emission filters. (c) Diagram of scalable data pipeline for real-time localization and automated post-localization analysis.
Figure 2:
Figure 2:
3D Multicolor Acquisition at 800 Hz Framerate (a, b) Rapid 2-color 3D SMLM of microtubules (alpha-tubulin immunolabeled with CF568) and endoplasmic reticulum (Sec61β-GFP immunolabeled with AF647) in a COS-7 cell. (c, d) Mitochondria (TOM20 immunolabeled with AF647) and nucleoids (double-stranded DNA immunolabeled with CF568ST) in a U-2 OS cell. (e) Lamin a/c (immunolabeled with CF568) and a lamin-associated chromatin domain (LAD, Chr13: 24405079–24709084, labeled with AF647 via FISH) in an IMR-90 cell. (f) All 27 topologically associating chromatin domains (TADs) along chromosome 22 (FISH-labeled with CF568) and a LAD (Chr5:115508197–115813276, FISH-labeled with AF647) in an IMR-90 cell. All data sets were acquired at a frame rate of 800 Hz for 8,000 frames (a-d) or 24,000 frames (e, f). Images are colored by label (a, c, e, f) or axial position (b, d).
Figure 3:
Figure 3:
Data Volume Solutions. (a) Sankey diagram showing approximate data bandwidths as they are transferred from the camera to instrument computer RAM before being sharded, compressed (lossy), sent across a local network, and saved locally on hard disk drives on multiple computer nodes. (b) Our lossy compression algorithm re-scales the analog-digital units such that the corresponding number of photoelectrons represented by each unique value scales with a set fraction of the shot noise. (c) A simulated localization ROI shown at various quantization levels. (d) The relative localization error as a function of quantization for simulated localizations with an sCMOS noise model. (e) The compression ratio achieved at the same quantization levels as in (d).
Figure 4:
Figure 4:
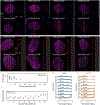
3D Multicolor SMLM imaging of 10,000 cells a day. (a) Overview mosaic image of U-2 OS cells on a coverslip, from which 11,160 fields of view were automatically detected for imaging. A magnified view of the dashed box in the overview image is shown in the large inset, with a further magnification shown inside the solid box. Nuclei that were queued and imaged are highlighted in yellow and their queue number displayed in the smaller inset. Each detected nucleus was automatically imaged, averaging 9.44 seconds per FOV, or 10,000 cells per 26.2 hours. The first and last nucleus imaged are shown in (b). principal component analysis on the SMLM datasets was used to select representative cells, choosing the cell closest to the mean (c, blue) and ±2 median absolute deviations from it (d-g). (h) Sum-normalized nucleophosmin-nucleophosmin pairwise distance histograms for these selected cells c-g are shown after a secondary normalization to the ensemble-median (black, interquartile range shown in gray).
Figure 5:
Figure 5:
(a, b) Example PCA-selected ROI from an osmotic shock experiment on HeLa cells (a) and U-2 OS cells (b) in automatically-imaged 8-well slides. The concentation of KCl, number of ROIs containing a segmented Cajal body (NCB+), and number of ROIs successfully imaged and analyzed (N) are annotated on the example ROI for each condition. (c) Size of CBs at each concentration. (d, e) Coilin enrichment relative to a uniform random distribution within a fitted nucleus model for HeLa cells (d) and U-2 OS cells (e). (f) Coilin edge enrichment for each ROI, calculated as the average coilin enrichment relative to a uniform random distribution at normalized radii larger than 0.85.

References

    1. Baddeley D & Bewersdorf J Biological Insight from Super-Resolution Microscopy: What We Can Learn from Localization-Based Images. Annual Review of Biochemistry 87, 965–989 (2018). - PubMed
    1. Xu K, Zhong G & Zhuang X Actin, spectrin, and associated proteins form a periodic cytoskeletal structure in axons. Science 339, 452–456 (2013). - PMC - PubMed
    1. Szymborska A et al. Nuclear pore scaffold structure analyzed by super-resolution microscopy and particle averaging. Science 341, 655–658 (2013). - PubMed
    1. Zhang Y, Lara-Tejero M, Bewersdorf J & Galán JE Visualization and characterization of individual type iii protein secretion machines in live bacteria. Proceedings of the National Academy of Sciences 114, 6098–6103 (2017). - PMC - PubMed
    1. Yuan P et al. Trem2 haplodeficiency in mice and humans impairs the microglia barrier function leading to decreased amyloid compaction and severe axonal dystrophy. Neuron 90, 724–739 (2016). - PMC - PubMed

Publication types

MeSH terms