. 2023 Apr;24(4):690-699.
doi: 10.1038/s41590-023-01449-6. Epub 2023 Mar 13.

Infection with wild-type SARS-CoV-2 elicits broadly neutralizing and protective antibodies against omicron subvariants

Affiliations

Infection with wild-type SARS-CoV-2 elicits broadly neutralizing and protective antibodies against omicron subvariants

Bin Ju et al. Nat Immunol. 2023 Apr.

Abstract

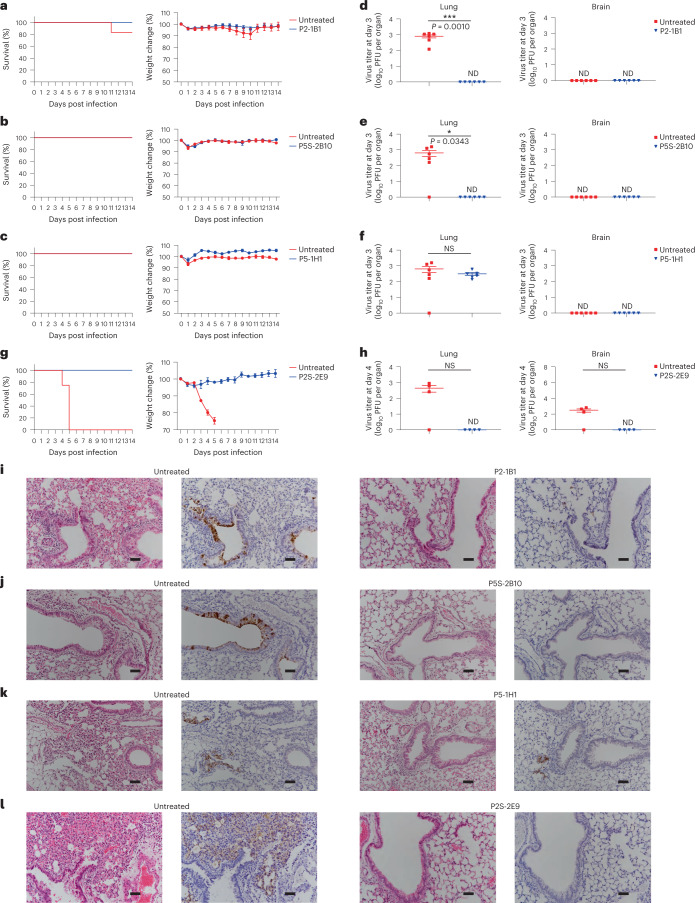
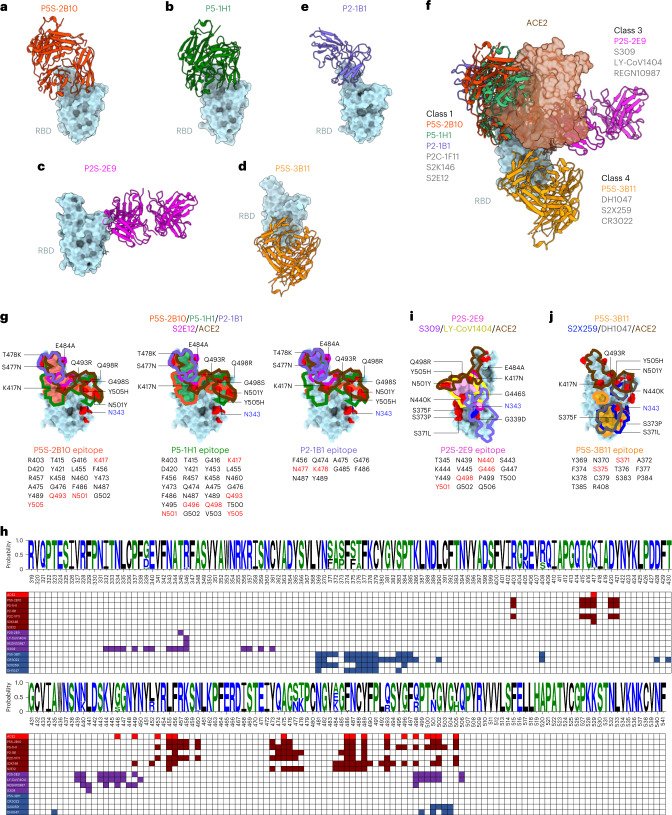
The omicron variants of SARS-CoV-2 have substantial ability to escape infection- and vaccine-elicited antibody immunity. Here, we investigated the extent of such escape in nine convalescent patients infected with the wild-type SARS-CoV-2 during the first wave of the pandemic. Among the total of 476 monoclonal antibodies (mAbs) isolated from peripheral memory B cells, we identified seven mAbs with broad neutralizing activity to all variants tested, including various omicron subvariants. Biochemical and structural analysis indicated the majority of these mAbs bound to the receptor-binding domain, mimicked the receptor ACE2 and were able to accommodate or inadvertently improve recognition of omicron substitutions. Passive delivery of representative antibodies protected K18-hACE2 mice from infection with omicron and beta SARS-CoV-2. A deeper understanding of how the memory B cells that produce these antibodies could be selectively boosted or recalled can augment antibody immunity against SARS-CoV-2 variants.


Conflict of interest statement

Patent applications have been filed that cover some of the antibodies presented here (patent application nos. 202310046052.1, 202310046053.6, 202310046054.0, 202310046051.7, 202310046056.X, 202310107070.6, 202310130257.8, 202310050519.X, 202310118826.7, 202310050250.5, 202310050475.0 and 202310050170.X). L.Z., Z.Z., Q.Z., B.J., P.C., B.Z. and X.S. are the inventors. The other authors declare no competing interests.

Figures

Fig. 1
Fig. 1. Identification and characterization of SWT-specific antibodies from convalescent patients in the early pandemic.
a, Initial screening for SWT-specific antibodies from nine convalescent patients using ELISA. Of 771 antibodies produced in the culture supernatant, 476 (61.7%) had strong binding with optical density (OD) values above the cut-off of 0.2, more than threefold higher than the background. b, Epitope specificity of the 476 antibodies identified in a. The patient number and the number of antibodies obtained from each patient are shown in the inner circle. Each slice is colored according to its epitope specificity and is proportional to the total antibodies obtained. c, Initial screening of the 476 antibodies as in a for their neutralizing activity against wild-type SARS-CoV-2 using pseudovirus-based neutralization assay. The cut-off value of neutralization was 10,000 ng ml−1. d, Proportions of nAbs among those binding to RBD (40 of 132, 30%), S2 (1 of 214, 0.5%) and others (17 of 130, 13%). Results are representative of at least two independent experiments. IC50, half-maximum inhibitory concentration. Source data
Fig. 2
Fig. 2. Neutralizing activity, epitope characterization and gene family analysis of the top 40 RBD-specific antibodies.
Neutralization activity against a panel of 17 pseudoviruses carrying the S proteins of wild-type and various VOCs and VOIs, indicated by antibody concentration required to achieve 50% reduction in viral infectivity (IC50, ng ml−1). The neutralizing activity is colored from red, orange, yellow, green to gray, with red being the strongest, while gray failed to reach IC50 at the highest concentration tested (10,000 ng ml−1). A few representative mutations that potentially facilitate viral escape from antibodies are indicated below each of the VOCs and VOIs. The complete set of mutations for each of the VOCs and VOIs can be found in the Methods. Epitope specificity was determined by competition with typical class 1 (P2C-1F11 and REGN10933), class 2 (P2B-2F6) and class 3 (REGN10987 and S309) antibodies measured by surface plasmon resonance (SPR). All results were calculated from at least two independent experiments. The germline gene usage (IGHV, IGKV, IGLV), the length of complementarity determining region (CDR) 3 and the proportion of somatic hypermutation (SHM) were estimated using the IMGT program. Antibodies highlighted in red text are those competed with typical class 1 antibody P2C-1F11 and which preferentially used germline IGHV3-53/66. For clarity, the five antibodies that had their crystal or cryo-EM structures resolved in complex with RBD or S trimer are labeled with either red (class 1) or black (other classes) background. G1 to G5, group 1 to group 5; VOIs, variants of interest.
Fig. 3
Fig. 3. Preferred germline gene usage among the RBD-specific and the S-specific antibodies.
ad, Germline heavy and light gene usage and pairing among the top 40 RBD-specific (a,b) and the 476 S-specific antibodies (c,d), presented in chord diagrams (a,c) and heatmaps (b,d). In the chord diagrams, each of the paired germline heavy and light chains are linked by arcs, the sizes of which are proportional to the total antibodies identified. The number and the color in the heatmaps represent the number of antibodies identified with their germline heavy and light chains indicated along the vertical and horizontal axes. The preferred germline usages are highlighted by colored background in both chord diagrams and heatmaps. Source data
Fig. 4
Fig. 4. P2-1B1, P5S-2B10, P5-1H1 and P2S-2E9 prophylaxis protects K18-hACE2 mice from infection with SARS-CoV-2 omicron BA.1 or beta.
ac, Survival percentage and body weight recorded daily post infection with BA.1 until death occurred or at the end point of experiments at 14 dpi in P2-1B1 (a), P5S-2B10 (b) and P5-1H1 (c) groups. df, Lung viral titers and brain viral titers in mice killed at 3 dpi for BA.1 in P2-1B1 (d), P5S-2B10 (e) and P5-1H1 (f) groups. g, Survival percentage and body weight recorded daily post infection with beta until death occurred or at the end point of experiments at 14 dpi in P2S-2E9 group. h, Lung viral titers and brain viral titers in mice killed at 4 dpi for beta in P2S-2E9 group. Weight change and PFU per organ are presented as mean ± s.e.m. The significance was estimated by a two-tailed, unpaired t-test. *P < 0.05; ***P < 0.001; NS, not significant; ND, not detected. il, H&E and immunohistochemistry staining of lung tissue from P2-1B1 (i), P5S-2B10 (j), P5-1H1 (k) or P2S-2E9 (l) intraperitoneally treated and corresponding untreated mice at day 3 (BA.1) or day 4 (beta) post infection. Dark brown, cells positive for SARS-CoV-2 N protein. Scale bars, 50 µm. Images were derived from one representative mouse in each group. The P2-1B1 experiment shared the same negative control mice as previously published. P5S-2B10 and P5-1H1 experiments shared the same negative control mice in this study. dpi, days post infection; H&E, hematoxylin and eosin. Source data
Fig. 5
Fig. 5. Binding mode and epitope specificity of five bnAbs to SARS-CoV-2.
ae, Crystal or cryo-EM structures of five Fab fragments complexed with RBDs derived from wild-type, beta or omicron BA.1. All RBDs are colored in cyan whereas P5S-2B10 (a) is in red, P5-1H1 (b) is in green, P2S-2E9 (c) is in magenta, P5S-3B11 (d) is in orange and P2-1B1 (e) is in purple. f, Fab fragments of P5S-2B10, P5-1H1, P2S-2E9, P5S-3B11 and P2-1B1 complexed with RBDs superimposed into one composite together with receptor ACE2 (brown). g, The footprints of P5S-2B10, P5-1H1 and P2-1B1 Fabs, together with those of S2E12 and ACE2, shown on the surface of the SARS-CoV-2 RBD. The epitope residues are indicted just below each structure, with the mutation sites found in omicron BA.1 indicated in red. h, Comparison of the epitope residues of the P5S-2B10, P5-1H1, P2-1B1, P2S-2E9 and P5S-3B11 antibodies with published representative antibodies and the receptor ACE2 along the linear RBD sequence. A logo plot of RBD sequences was created based on all tested SARS-CoV-2 variants. The numbering system follows that in the GISAID database. i,j, The footprints of P2S-2E9 (i) and P5S-3B11 (j) Fabs, together with those of representative antibodies and ACE2, shown on the surface of the SARS-CoV-2 RBD. The epitope residues are indicted just below each structure, with the mutation sites found in omicron BA.1 indicated in red. The highly conserved N-glycosylation residue N343 among the sarbecoviruses is indicated.
Extended Data Fig. 1
Extended Data Fig. 1. Analysis of plasma antibody response and SWT-specific single B cells from convalescent patients.
a, b, Neutralizing (a) and binding (b) activity of convalescent plasma analyzed by wild-type pseudovirus and ELISA. Recombinant S, S1, RBD, and S2 proteins derived from the wild-type strain was used in the ELISA. The samples are labeled as A, B, C, or D depending on the collection sequence. The date of sampling was presented as days post symptom onset. Results calculated from two independent experiments. c-d, Gating strategy for isolating SWT-specific single B cells from 9 convalescent individuals by FACS. PBMCs from four healthy donors were used as the background control. SWT-specific single B cells were either gated as (c) CD19+CD3CD8CD14CD27+IgG+SWT+ or (d) CD19+CD3CD8CD14IgMIgDSWT+. The percentage of SWT-specific single B cells from each sample were shown. FSC-A: forward scatter area. SSC-A: side scatter area. FSC-W: forward scatter width. Source data
Extended Data Fig. 2
Extended Data Fig. 2. Binding specificity of 476 isolated antibodies.
Binding specificity was analyzed by ELISA against recombinant S, S1, RBD, and S2 proteins of wild-type SARS-CoV-2, and S1 or S proteins of SARS-CoV-1 and MERS-CoV. Each antibody was tested in duplicates and presented as such on the same row. The binding activity is colored from red to green, with red being the strongest and green just above the optical density (OD) cut-off value of 0.2, at least 3−fold higher than the background. The negative ones are in light grey with OD450nm < 0.2. Source data
Extended Data Fig. 3
Extended Data Fig. 3. Neutralization activity of top 40 RBD-specific antibodies against pseudoviruses bearing spike of wild-type, major VOCs and other variants of SARS-CoV-2.
Pseudoviruses were tested against serial dilutions of the testing antibodies. Neutralization activity was defined as the concentration required to achieve 50% reduction in viral infection (IC50) relative to no antibody controls. Results were calculated from at least two independent experiments. One representative curve was displayed. Source data
Extended Data Fig. 4
Extended Data Fig. 4. Epitope characterization of top 40 RBD-specific antibodies.
Epitope specificity was determined by competition with ACE2, typical class 1 (P2C-1F11 and REGN10933), class 2 (P2B-2F6), and class 3 (REGN10987 and S309) antibodies measured by surface plasmon resonance (SPR). For clarity, the five antibodies had their crystal or cryo-EM structures resolved in complex with RBD or S trimer are highlighted in either red (class 1) or back (other classes) background. G1 to G5: group 1 to group 5.
Extended Data Fig. 5
Extended Data Fig. 5. Data collection and refinement statistics (molecular replacement).
This summary contained four crystal structures, SARS-CoV-2 wild-type (WT) RBD in complex with Fab P5S-2B10, Fab P5-1H1 and SARS-CoV-2 beta RBD in complex with Fab P2S-2E9, Fab P5S-3B11.
Extended Data Fig. 6
Extended Data Fig. 6. Flowchart for SARS-CoV-2 BA.1 S trimer in complex with Fab P2-1B1.
The flowchart of cryo-EM data processing only exhibited key step, including representative electron micrograph, 2D class averages, 3D classification density map and local refinement density map.
Extended Data Fig. 7
Extended Data Fig. 7. Cryo-EM data collection and processing, model building and refinement statistics.
The statistics of model building and refinement based on the local refinement density map, the structure composing by BA.1 spike RBD and Fab P2-1B1.
Extended Data Fig. 8
Extended Data Fig. 8. Hydrogen bonds and salt bridges formed between antibodies and SARS-CoV-2 RBD.
(a) Those potentially affected by omicron BA.1 mutations are highlighted in red. b-e, Zoomed-in view of the hydrogen bonds and salt bridges as well as residues involved from P5S-2B10 (b), P5-1H1 (c), P2S-2E9 (d) and P5S-3B11 (e) antibodies and SARS-CoV-2 RBD are shown.
Extended Data Fig. 9
Extended Data Fig. 9. Antibody binding to cell-surface expressed spikes of wild-type, omicron BA.1, BA.2, BA.2.12.1, BA.2.75, BA.3, and BA.4/5.
Binding of the five testing mAbs and ACE2 to the S protein expressed on the surface of HEK 293T, measured by flow cytometry. Fold changes in binding activity were measured by mean fluorescence intensity (MFI) relative to that of wild-type and summarized in (a). The symbol ‘+’ and ‘−‘ indicate increase and decrease in binding, respectively. The result was calculated from two independent experiments. (b) The flow cytometry shown was representative of two independent experiments. Anti-S2 is a S2-specific antibody used for positive and normalized control. This mouse anti-S2 monoclonal antibody specifically targeted the epitope (1129-VIGIVNNTVYDPLQPELDSF-1148), which was identical among all tested SARS-CoV-2 variants. The numbers highlighted in the gates represent the percent of positive cells detected by indicated antibodies or ACE2.
Extended Data Fig. 10
Extended Data Fig. 10. Electrostatic potential maps of the omicron BA.1 RBD (left) and P2-1B1 (right).
The BA.1 RBD is shown by a cyan ribbon in the right panel and the side chain of mutation residue K478 is shown by stick.

References

    1. Wang P, et al. Antibody resistance of SARS-CoV-2 variants B.1.351 and B.1.1.7. Nature. 2021;593:130–135. doi: 10.1038/s41586-021-03398-2. - DOI - PubMed
    1. Planas D, et al. Reduced sensitivity of SARS-CoV-2 variant Delta to antibody neutralization. Nature. 2021;596:276–280. doi: 10.1038/s41586-021-03777-9. - DOI - PubMed
    1. Liu L, et al. Striking antibody evasion manifested by the Omicron variant of SARS-CoV-2. Nature. 2021;602:676–681. doi: 10.1038/s41586-021-04388-0. - DOI - PubMed
    1. Cameroni E, et al. Broadly neutralizing antibodies overcome SARS-CoV-2 Omicron antigenic shift. Nature. 2022;602:664–670. doi: 10.1038/s41586-021-04386-2. - DOI - PMC - PubMed
    1. Iketani S, et al. Antibody evasion properties of SARS-CoV-2 Omicron sublineages. Nature. 2022;604:553–556. doi: 10.1038/s41586-022-04594-4. - DOI - PMC - PubMed

Publication types

Supplementary concepts