. 2023 Mar;29(3):719-728.
doi: 10.1038/s41591-023-02235-5. Epub 2023 Mar 13.

Optimal dietary patterns for prevention of chronic disease

Affiliations

Optimal dietary patterns for prevention of chronic disease

Peilu Wang et al. Nat Med. 2023 Mar.

Erratum in

Abstract

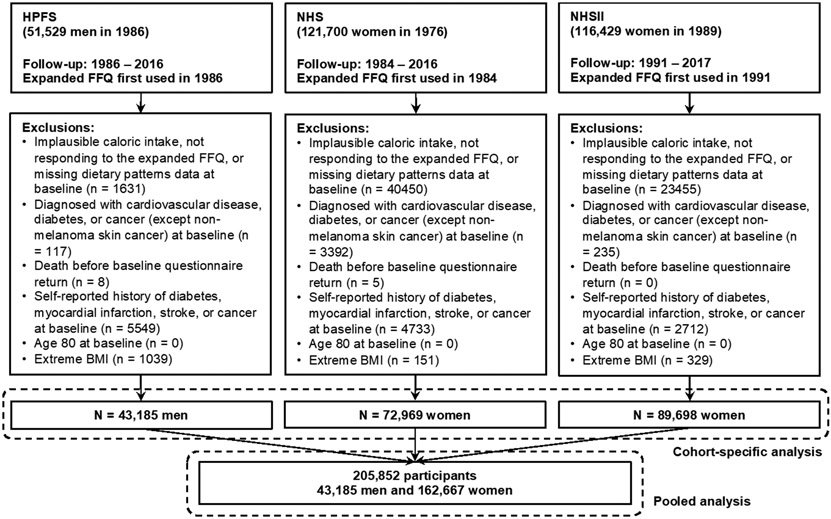
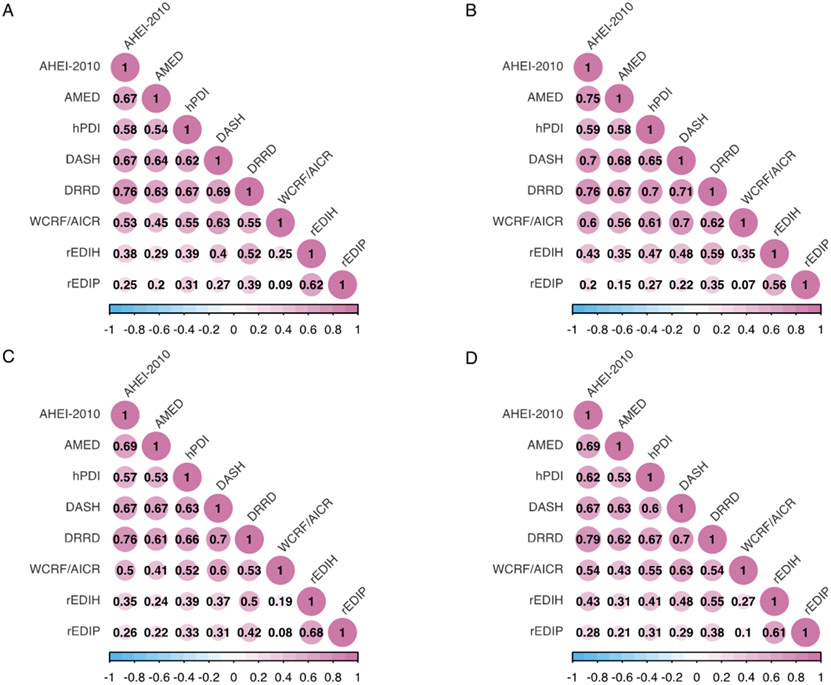
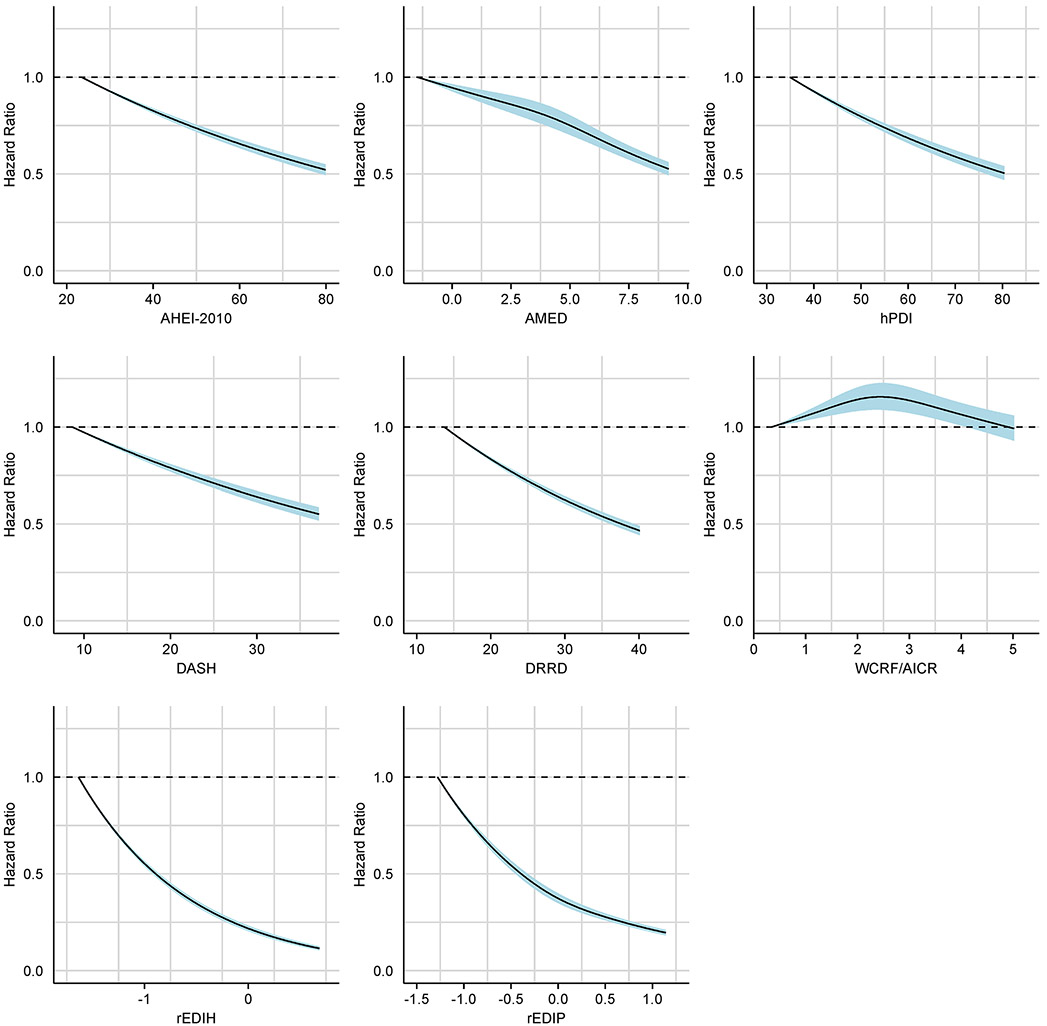
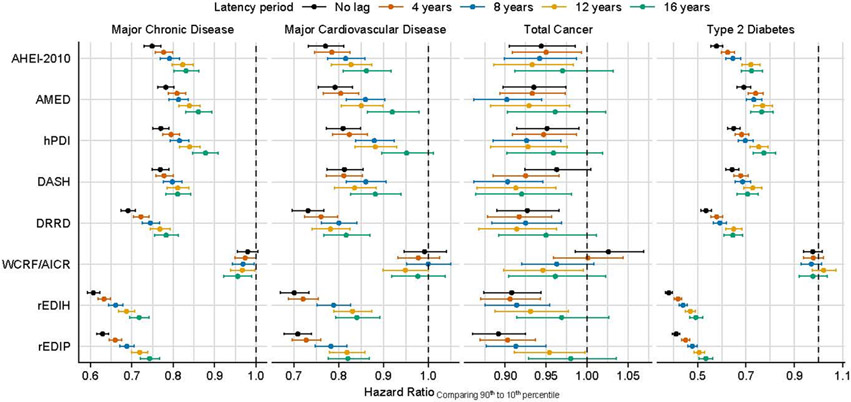
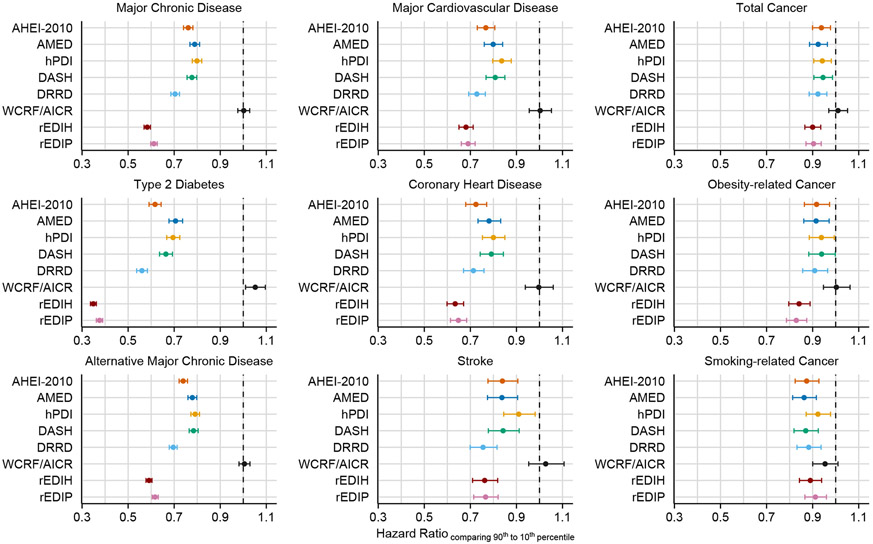
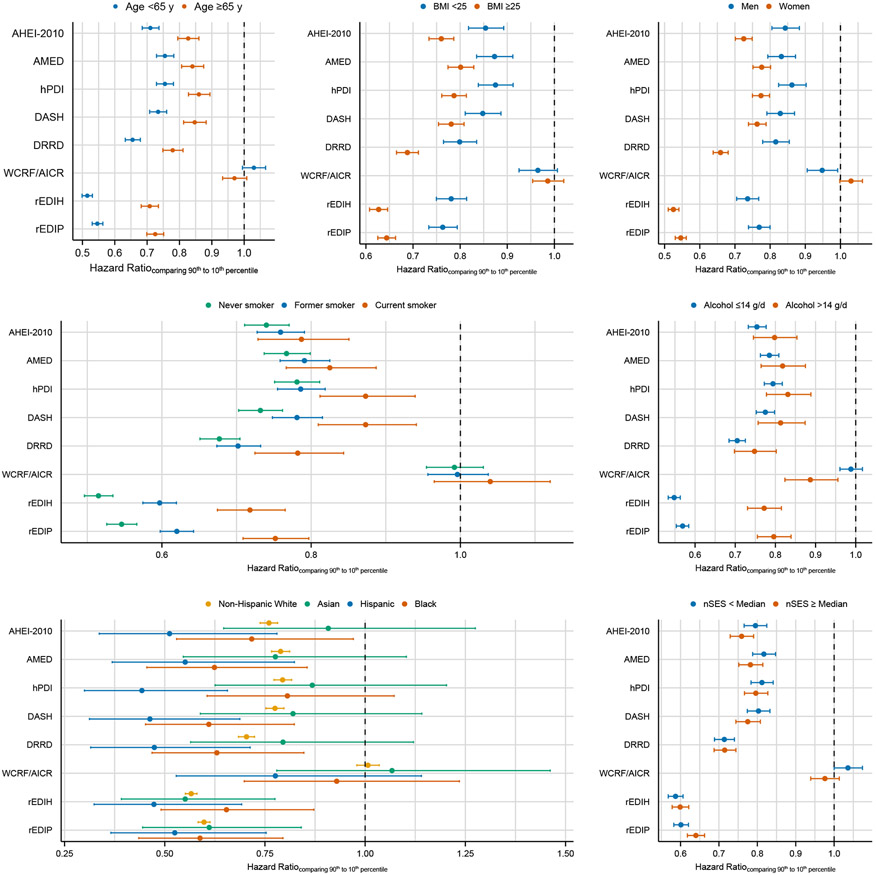
Multiple dietary patterns have been associated with different diseases; however, their comparability to improve overall health has yet to be determined. Here, in 205,852 healthcare professionals from three US cohorts followed for up to 32 years, we prospectively assessed two mechanism-based diets and six diets based on dietary recommendations in relation to major chronic disease, defined as a composite outcome of incident major cardiovascular disease (CVD), type 2 diabetes and cancer. We demonstrated that adherence to a healthy diet was generally associated with a lower risk of major chronic disease (hazard ratio (HR) comparing the 90th with the 10th percentile of dietary pattern scores = 0.58-0.80). Participants with low insulinemic (HR = 0.58, 95% confidence interval (CI) = 0.57, 0.60), low inflammatory (HR = 0.61, 95% CI = 0.60, 0.63) or diabetes risk-reducing (HR = 0.70, 95% CI = 0.69, 0.72) diet had the largest risk reduction for incident major CVD, type 2 diabetes and cancer as a composite and individually. Similar findings were observed across gender and diverse ethnic groups. Our results suggest that dietary patterns associated with markers of hyperinsulinemia and inflammation and diabetes development may inform on future dietary guidelines for chronic disease prevention.


Conflict of interest statement

Competing Interests

The authors have declared that no conflict of interest exists.

Figures

Extended Data Fig.1
Extended Data Fig.1. Flowchart of participants included in the main analysis.
BMI, body mass index; FFQ, food frequency questionnaires; Nurses’ Health Study (NHS); Health Professionals Follow-up Study (HPFS).
Extended Data Fig.2
Extended Data Fig.2. Baseline Spearman correlations between energy-adjusted cumulative average dietary patterns in (A) all cohorts, (B) the Health Professionals Follow-up Study, (C) the Nurses’ Health Study, and (D) Nurses’ Health Study II.
P values based on the two-sided tests were <0.0001 for all correlations (not adjusted for multiple comparisons). AHEI-2010, Alternative Healthy Eating Index-2010; AMED, Alternate Mediterranean Diet score; DASH, Dietary Approaches to Stop Hypertension score; DRRD, Diabetes Risk Reduction Diet; hPDI, Healthful plant-based diet index; rEDIH, reversed Empirical dietary index for hyperinsulinemia; rEDIP, reversed Empirical dietary inflammation pattern; WCRF/AICR, World Cancer Research Fund/American Institute for Cancer Research (WCRF/AICR) dietary score.
Extended Data Fig.3
Extended Data Fig.3. Multivariable-adjusted spline analysis of dietary pattern scores with risk of major chronic disease.
P values for nonlinearity based on the two-sided tests were statistically significant for AMED (P = 0.03), WCRF/AICR (P = 0.007), and rEDIP (P = 0.008) (not adjusted for multiple comparisons). The hazard ratios (black line) and the 95% confidence intervals (grey bands) are shown. The models were adjusted for the same list of covariates as in Table 2. AHEI-2010, Alternative Healthy Eating Index-2010; AMED, Alternate Mediterranean Diet score; DASH, Dietary Approaches to Stop Hypertension score; DRRD, Diabetes Risk Reduction Diet; hPDI, Healthful plant-based diet index; HR, Hazard ratio; rEDIH, reversed Empirical dietary index for hyperinsulinemia; rEDIP, reversed Empirical dietary inflammation pattern; WCRF/AICR, World Cancer Research Fund/American Institute for Cancer Research (WCRF/AICR) dietary score.
Extended Data Fig.4
Extended Data Fig.4. Multivariable-adjusted associations between cumulative average dietary patterns (comparing the 90th to 10th percentile) and major chronic disease and major components in the pooled data of three cohorts (n = 205,852 participants) with different lags.
Analyses details and corresponding estimates are provided in Extended Data Table 3. The hazard ratios are indicated by the circles and the 95% confidence intervals are reflected by the error bars. AHEI-2010, Alternative Healthy Eating Index-2010; AMED, Alternate Mediterranean Diet score; DASH, Dietary Approaches to Stop Hypertension score; DRRD, Diabetes Risk Reduction Diet; hPDI, Healthful plant-based diet index; rEDIH, reversed Empirical dietary index for hyperinsulinemia; rEDIP, reversed Empirical dietary inflammation pattern; WCRF/AICR, World Cancer Research Fund/American Institute for Cancer Research (WCRF/AICR) dietary score.
Fig.1
Fig.1
Detailed components of dietary patterns. Higher points or positive weights were assigned to higher intakes of components in green. Lower points or negative weights were assigned to higher intakes of components in red. Higher points were assigned to moderate intakes of components in blue. AHEI-2010, Alternative Healthy Eating Index-2010; AMED, Alternate Mediterranean Diet score; DASH, Dietary Approaches to Stop Hypertension score; DRRD, Diabetes Risk Reduction Diet; hPDI, Healthful plant-based diet index; rEDIH, reversed Empirical dietary index for hyperinsulinemia; rEDIP, reversed Empirical dietary inflammation pattern; WCRF/AICR, World Cancer Research Fund/American Institute for Cancer Research (WCRF/AICR) dietary score.
Fig.2
Fig.2
Multivariable-adjusted associations of cumulative average dietary patterns (comparing the 90th to 10th percentile) with major chronic disease and secondary outcomes in the pooled data of three cohorts (n = 205,852 participants). The Analyses details and corresponding estimates are provided in Table 2 and Extended Data Table 1. The hazard ratios are indicated by the circles and the 95% confidence intervals are reflected by the error bars. AHEI-2010, Alternative Healthy Eating Index-2010; AMED, Alternate Mediterranean Diet score; DASH, Dietary Approaches to Stop Hypertension score; DRRD, Diabetes Risk Reduction Diet; hPDI, Healthful plant-based diet index; rEDIH, reversed Empirical dietary index for hyperinsulinemia; rEDIP, reversed Empirical dietary inflammation pattern; WCRF/AICR, World Cancer Research Fund/American Institute for Cancer Research (WCRF/AICR) dietary score.
Fig.3
Fig.3
Baseline Spearman correlations between energy-adjusted cumulative average dietary patterns and food groups in the pooled data of three cohorts (n = 205,852 participants). Spearman correlation coefficients are shown and highlighted in color. Food groups are ordered based on the hazard ratios of their associations with major chronic disease (Chr). The associations of food groups (comparing the 90th to 10th percentile) with major chronic disease (Chr), major cardiovascular disease (CVD), type 2 diabetes (T2D), or total cancer (CA) are indicated on the left of the figure. We reported unadjusted P values based on two-sided statistical tests. Significant associations (P<0.05) are highlighted in color according to the magnitude of hazard ratios. AHEI-2010, Alternative Healthy Eating Index-2010; AMED, Alternate Mediterranean Diet score; DASH, Dietary Approaches to Stop Hypertension score; DRRD, Diabetes Risk Reduction Diet; hPDI, Healthful plant-based diet index; rEDIH, reversed Empirical dietary index for hyperinsulinemia; rEDIP, reversed Empirical dietary inflammation pattern; WCRF/AICR, World Cancer Research Fund/American Institute for Cancer Research (WCRF/AICR) dietary score.
Fig.4
Fig.4
Multivariable-adjusted associations between cumulative average dietary patterns (comparing the 90th to 10th percentile) and major chronic disease in subgroups. Analyses details and corresponding estimates are provided in Extended Data Table 2. The hazard ratios are indicated by the circles and the 95% confidence intervals are reflected by the error bars. AHEI-2010, Alternative Healthy Eating Index-2010; AMED, Alternate Mediterranean Diet score; BMI, body mass index; DASH, Dietary Approaches to Stop Hypertension score; DRRD, Diabetes Risk Reduction Diet; hPDI, Healthful plant-based diet index; nSES, neighborhood socioeconomic status; rEDIH, reversed Empirical dietary index for hyperinsulinemia; rEDIP, reversed Empirical dietary inflammation pattern; WCRF/AICR, World Cancer Research Fund/American Institute for Cancer Research (WCRF/AICR) dietary score.

Similar articles

Cited by

References

    1. Buttorff C, Ruder T & Bauman M Multiple Chronic Conditions in the United States. (RAND Corporation, Santa Monica, CA, 2017).
    1. Murphy SL, Kochanek KD, Xu J & Arias E Mortality in the United States, 2020. NCHS Data Brief, 1–8 (2021). - PubMed
    1. Rao M, Afshin A, Singh G & Mozaffarian D Do healthier foods and diet patterns cost more than less healthy options? A systematic review and meta-analysis. BMJ Open 3, e004277 (2013). - PMC - PubMed
    1. GBD 2017 Diet Collaborators. Health effects of dietary risks in 195 countries, 1990-2017: a systematic analysis for the Global Burden of Disease Study 2017. Lancet. 2019. May 11;393(10184):1958–1972. doi: 10.1016/S0140-6736(19)30041-8. Epub 2019 Apr 4. Erratum in: Lancet. 2021 Jun 26;397(10293):2466. PMID: 30954305; PMCID: PMC6899507. - DOI - PMC - PubMed
    1. Dietary Guidelines Advisory Committee. Scientific Report of the 2020 Dietary Guidelines Advisory Committee: Advisory Report to the Secretary of Agriculture and the Secretary of Health and Human Services. (U.S. Department of Agriculture, Agricultural Research Service, Washington, D.C., 2020).

Methods only references

    1. Salvini S, et al. Food-based validation of a dietary questionnaire: the effects of week-to-week variation in food consumption. Int J Epidemiol 18, 858–867 (1989). - PubMed
    1. Yuan C, et al. Validity of a Dietary Questionnaire Assessed by Comparison With Multiple Weighed Dietary Records or 24-Hour Recalls. Am J Epidemiol 185, 570–584 (2017). - PMC - PubMed
    1. Feskanich D, et al. Reproducibility and validity of food intake measurements from a semiquantitative food frequency questionnaire. J Am Diet Assoc 93, 790–796 (1993). - PubMed
    1. Hu FB, et al. Reproducibility and validity of dietary patterns assessed with a food-frequency questionnaire. Am J Clin Nutr 69, 243–249 (1999). - PubMed
    1. Al-Shaar L, et al. Reproducibility and Validity of a Semiquantitative Food Frequency Questionnaire in Men Assessed by Multiple Methods. Am J Epidemiol 190, 1122–1132 (2021). - PMC - PubMed

Publication types

MeSH terms