. 2023 Apr;29(4):906-916.
doi: 10.1038/s41591-023-02234-6. Epub 2023 Mar 13.

A non-antibiotic-disrupted gut microbiome is associated with clinical responses to CD19-CAR-T cell cancer immunotherapy

Affiliations

A non-antibiotic-disrupted gut microbiome is associated with clinical responses to CD19-CAR-T cell cancer immunotherapy

Christoph K Stein-Thoeringer et al. Nat Med. 2023 Apr.

Abstract

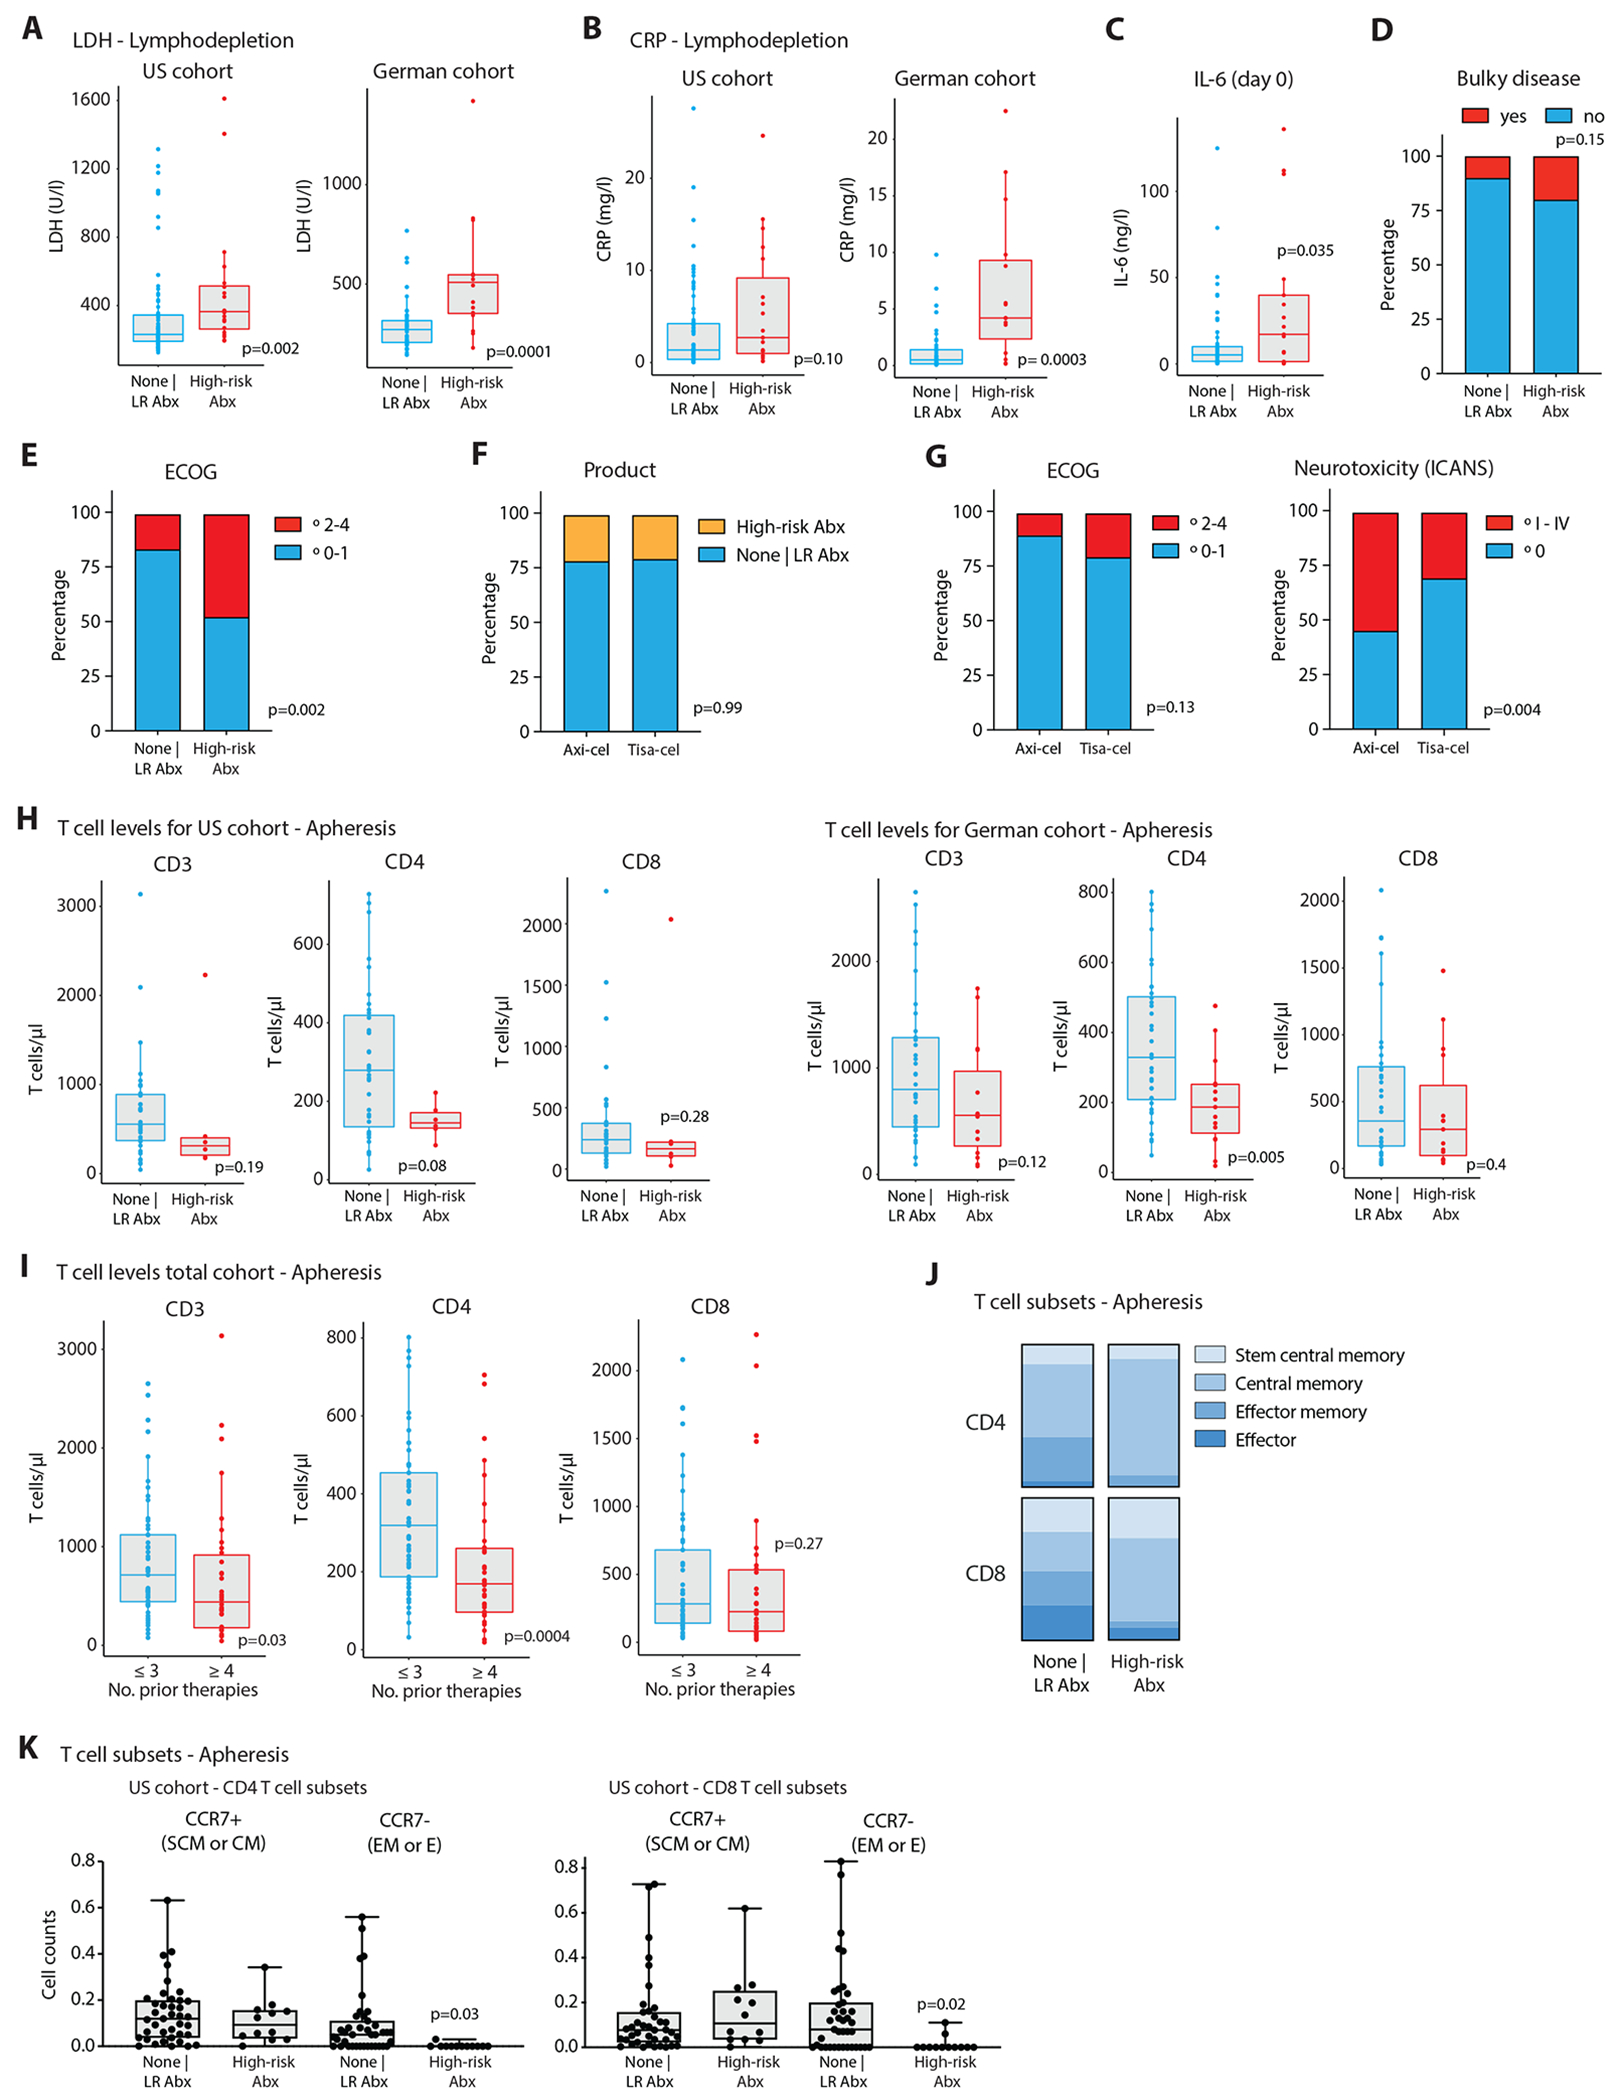
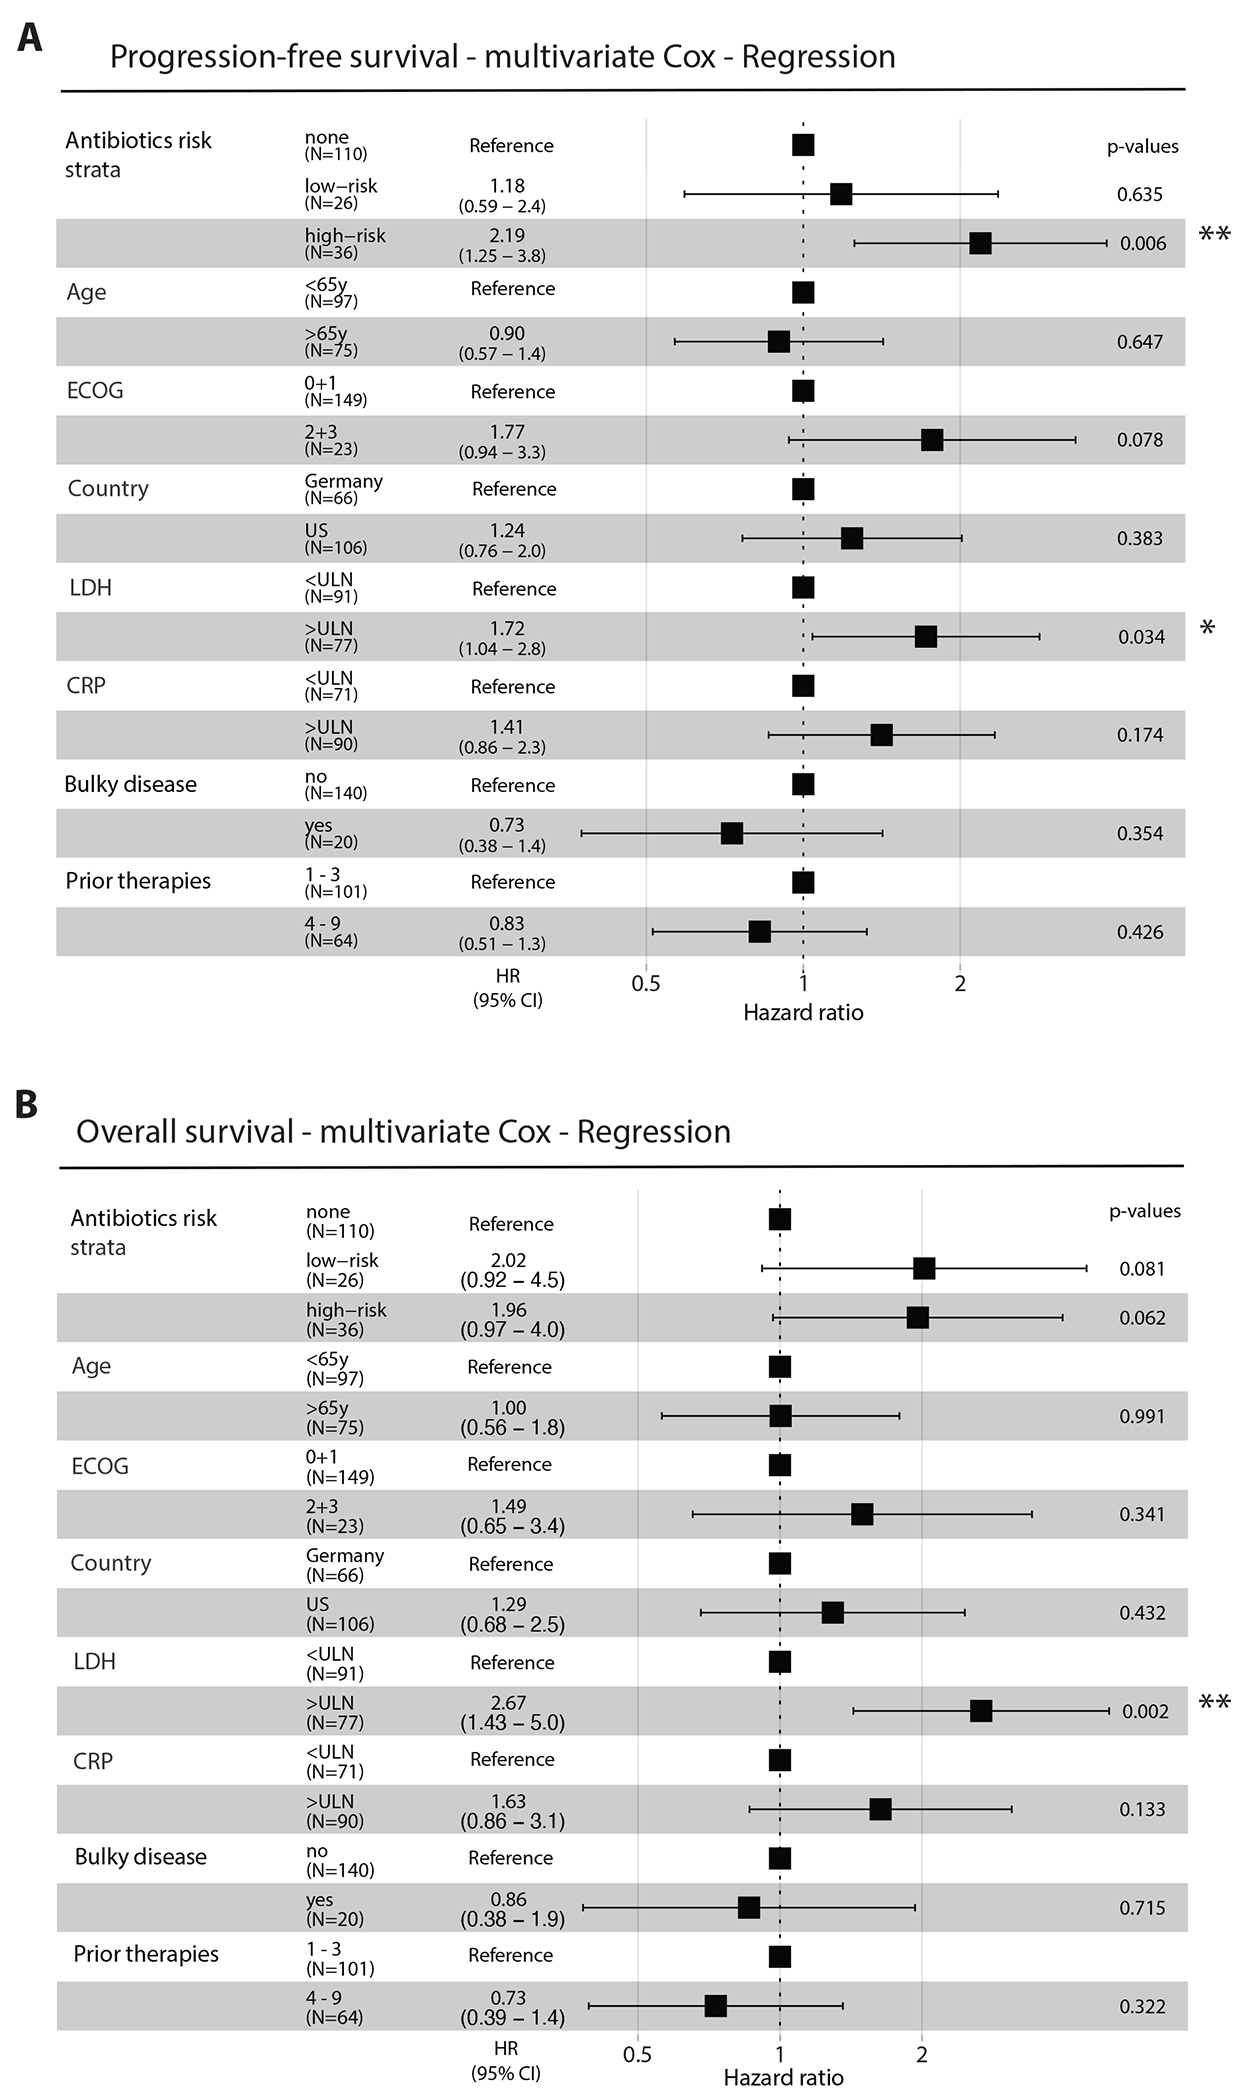
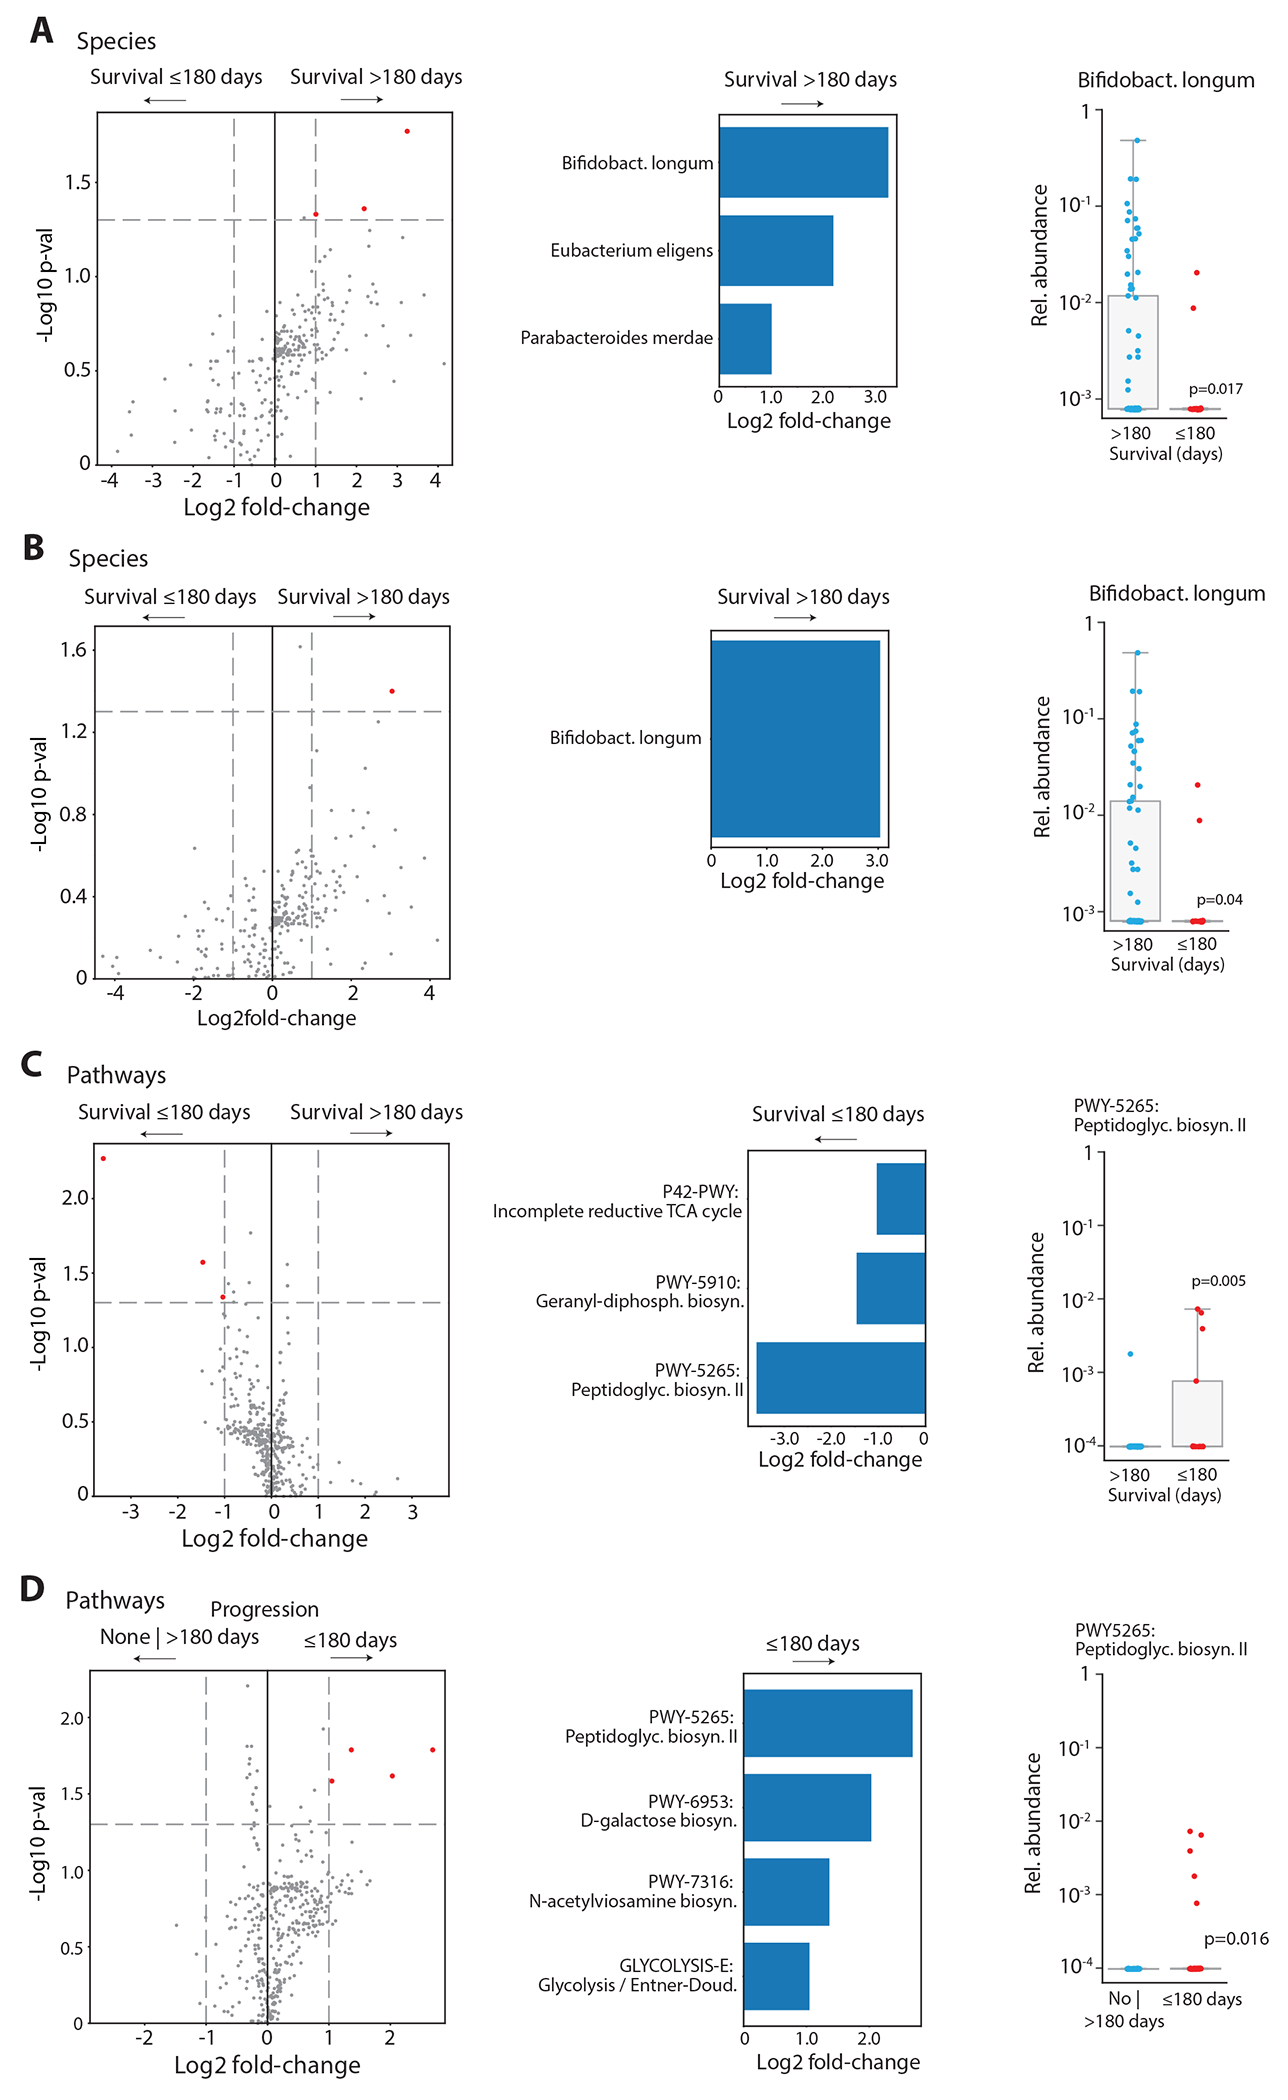
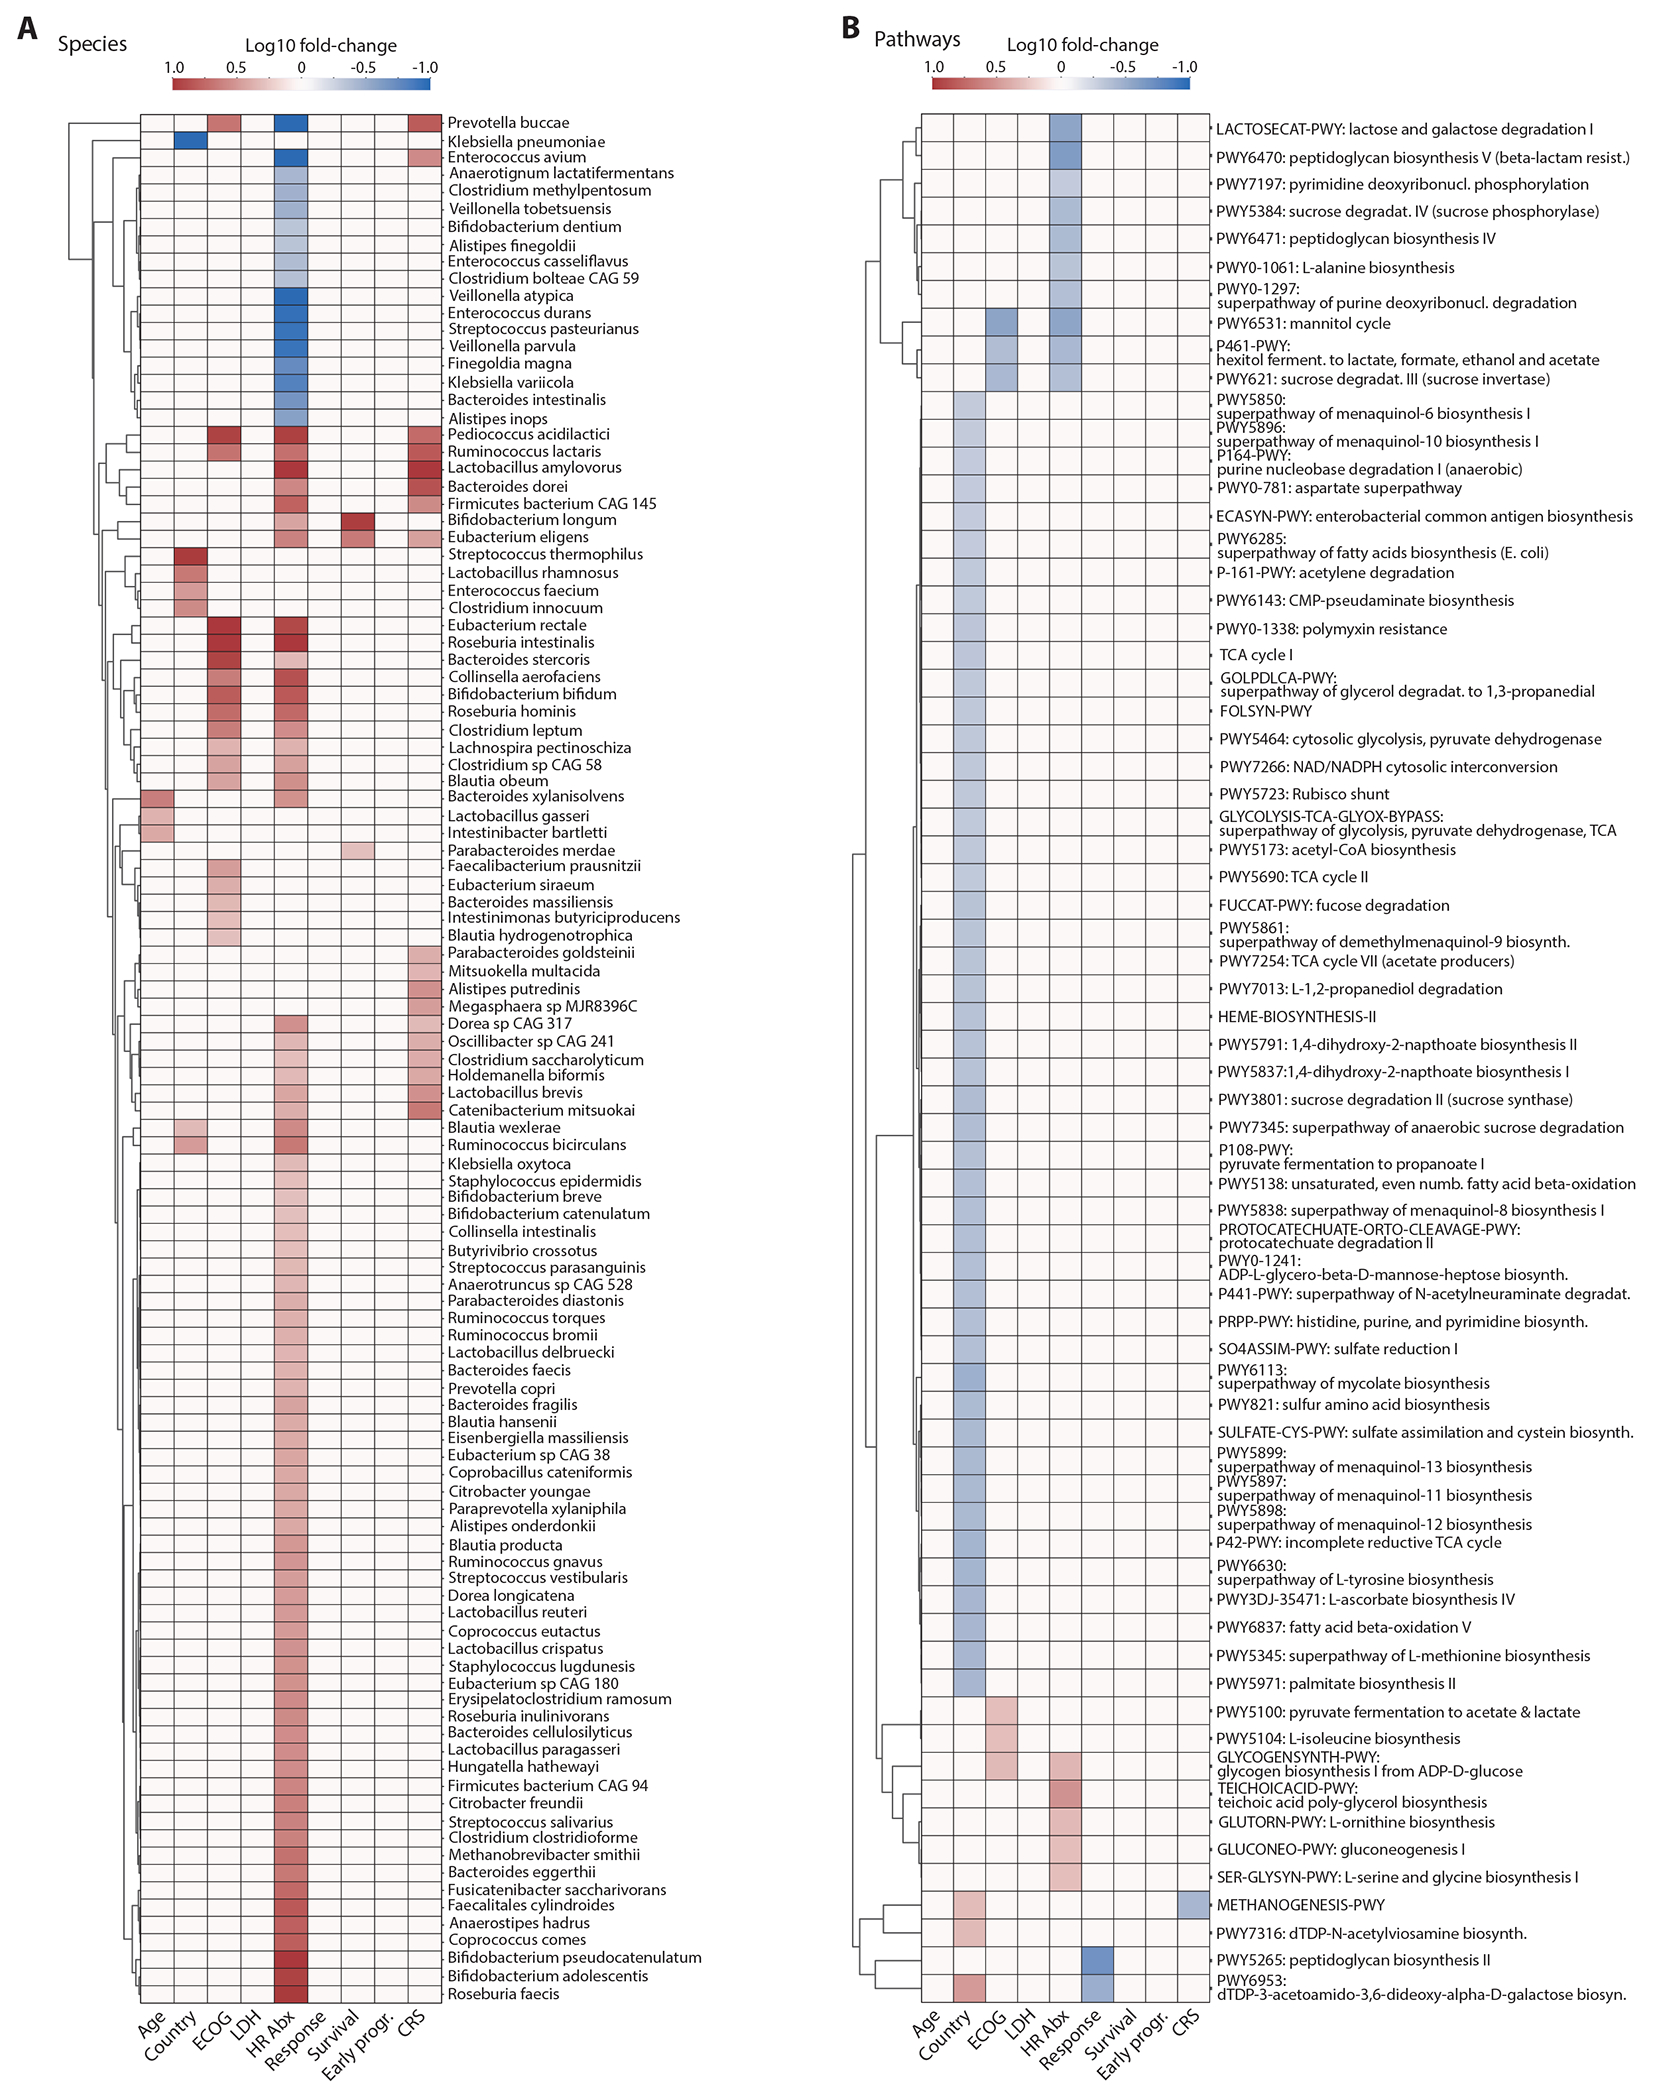
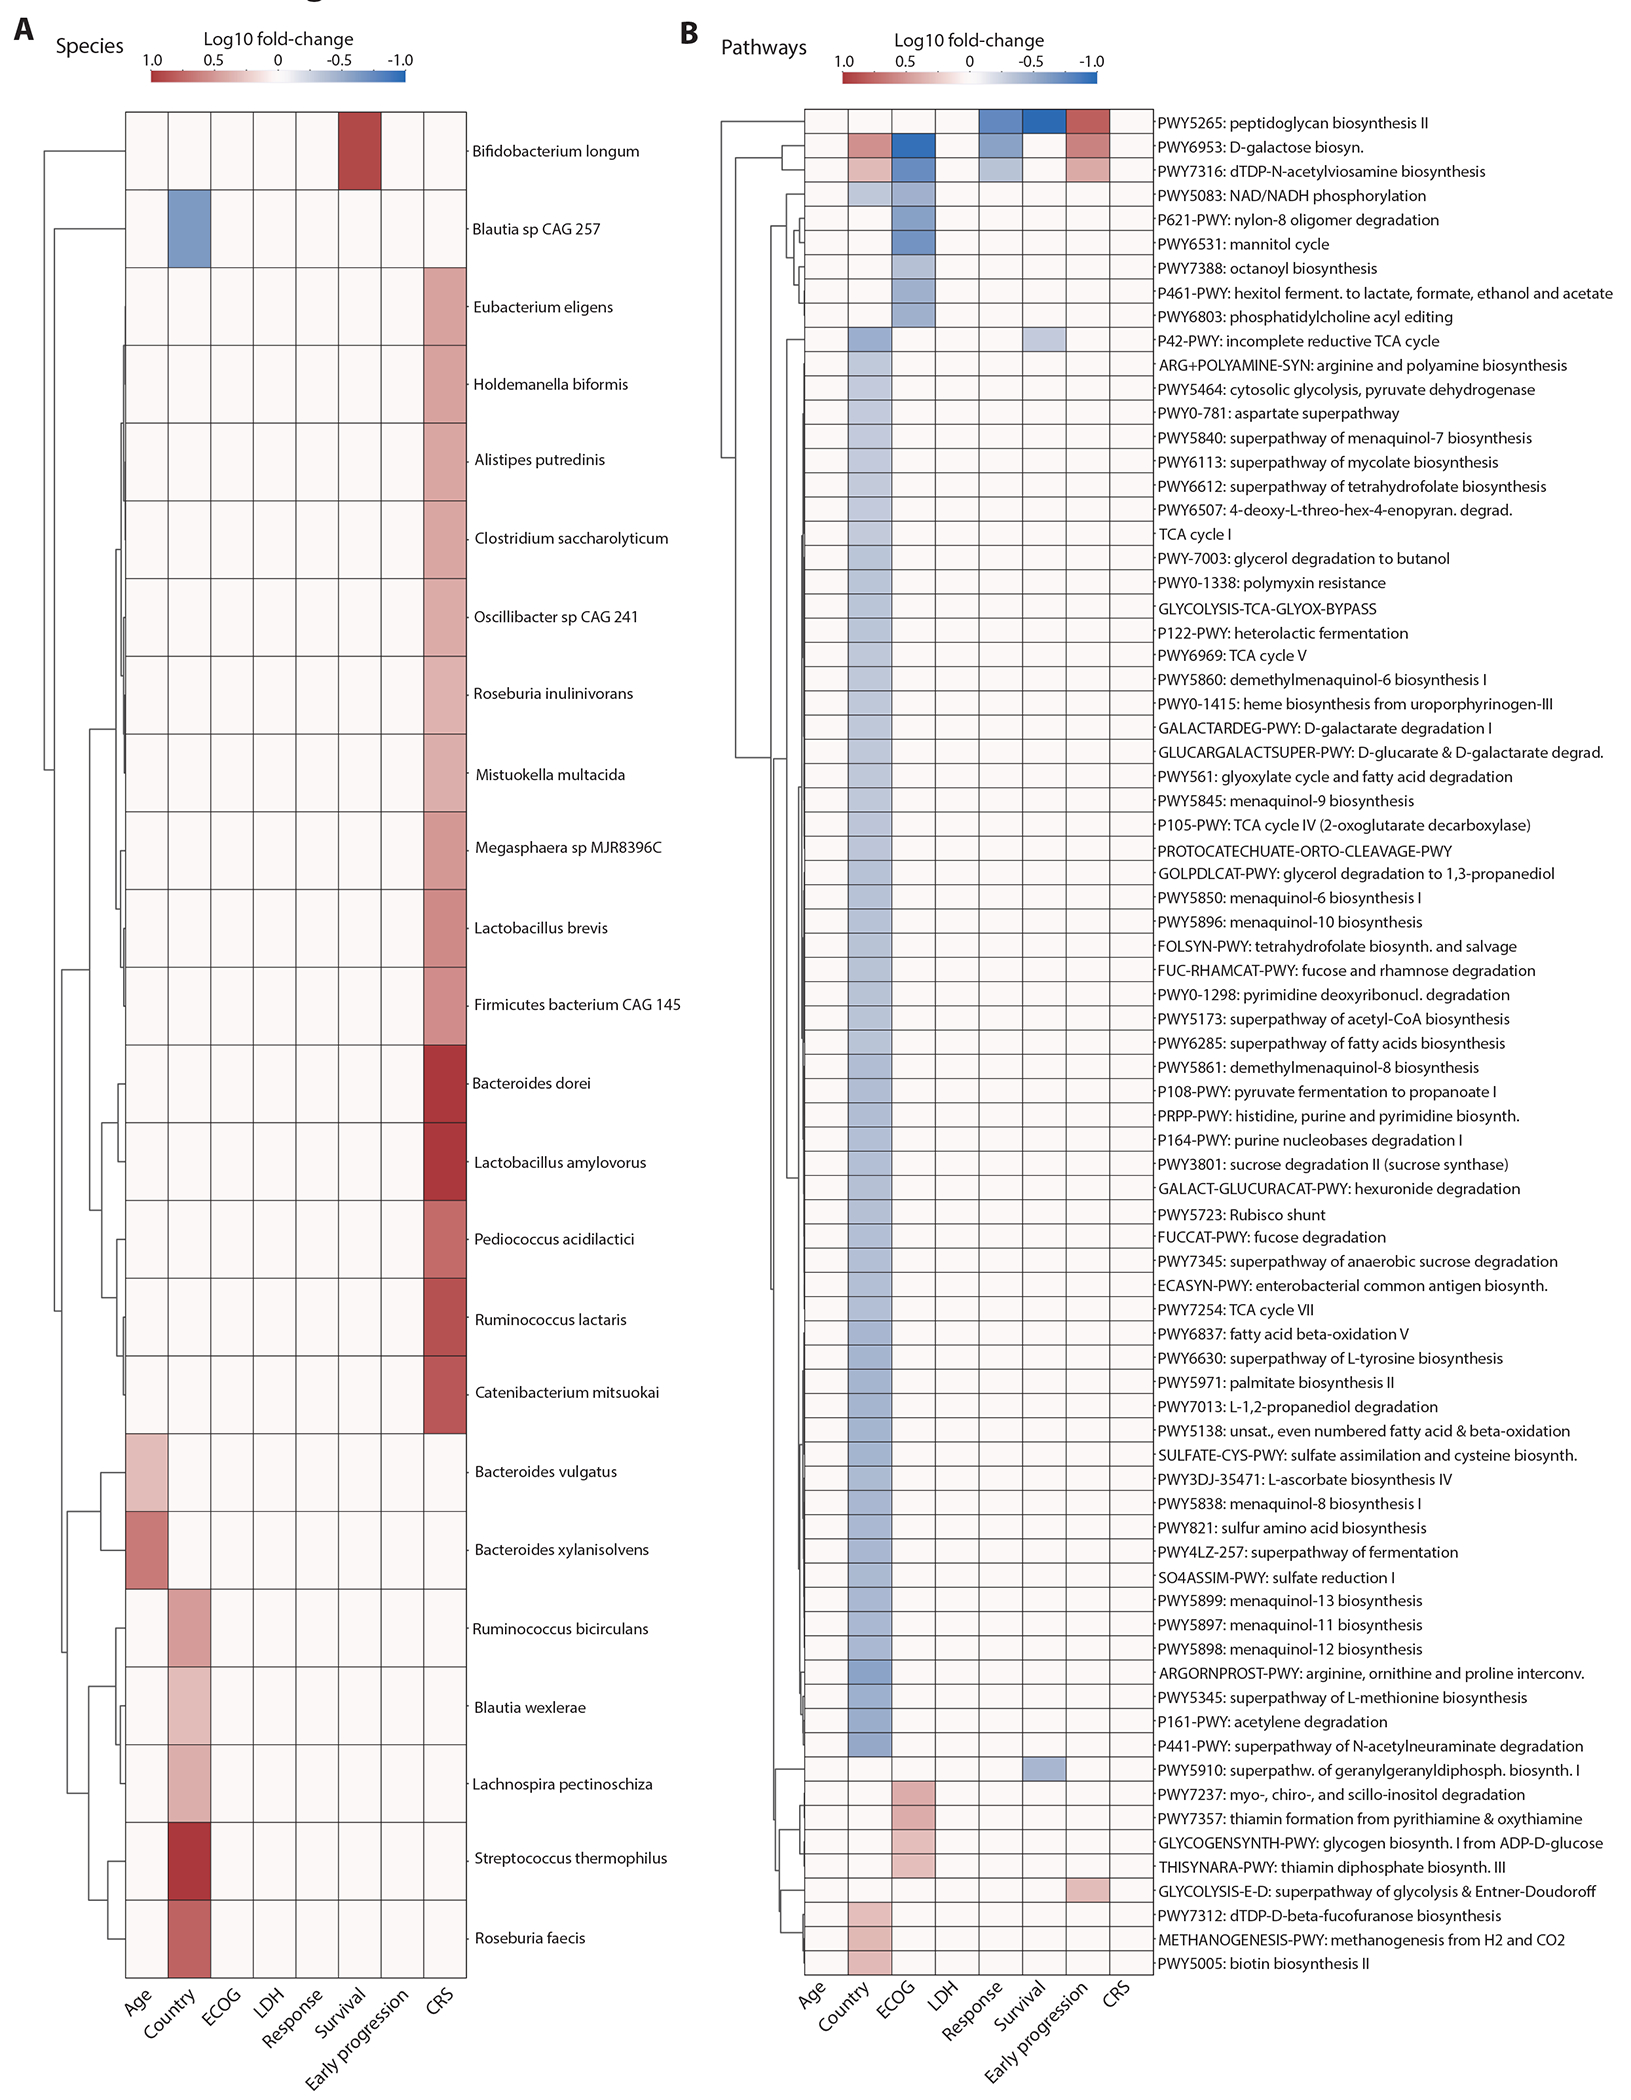
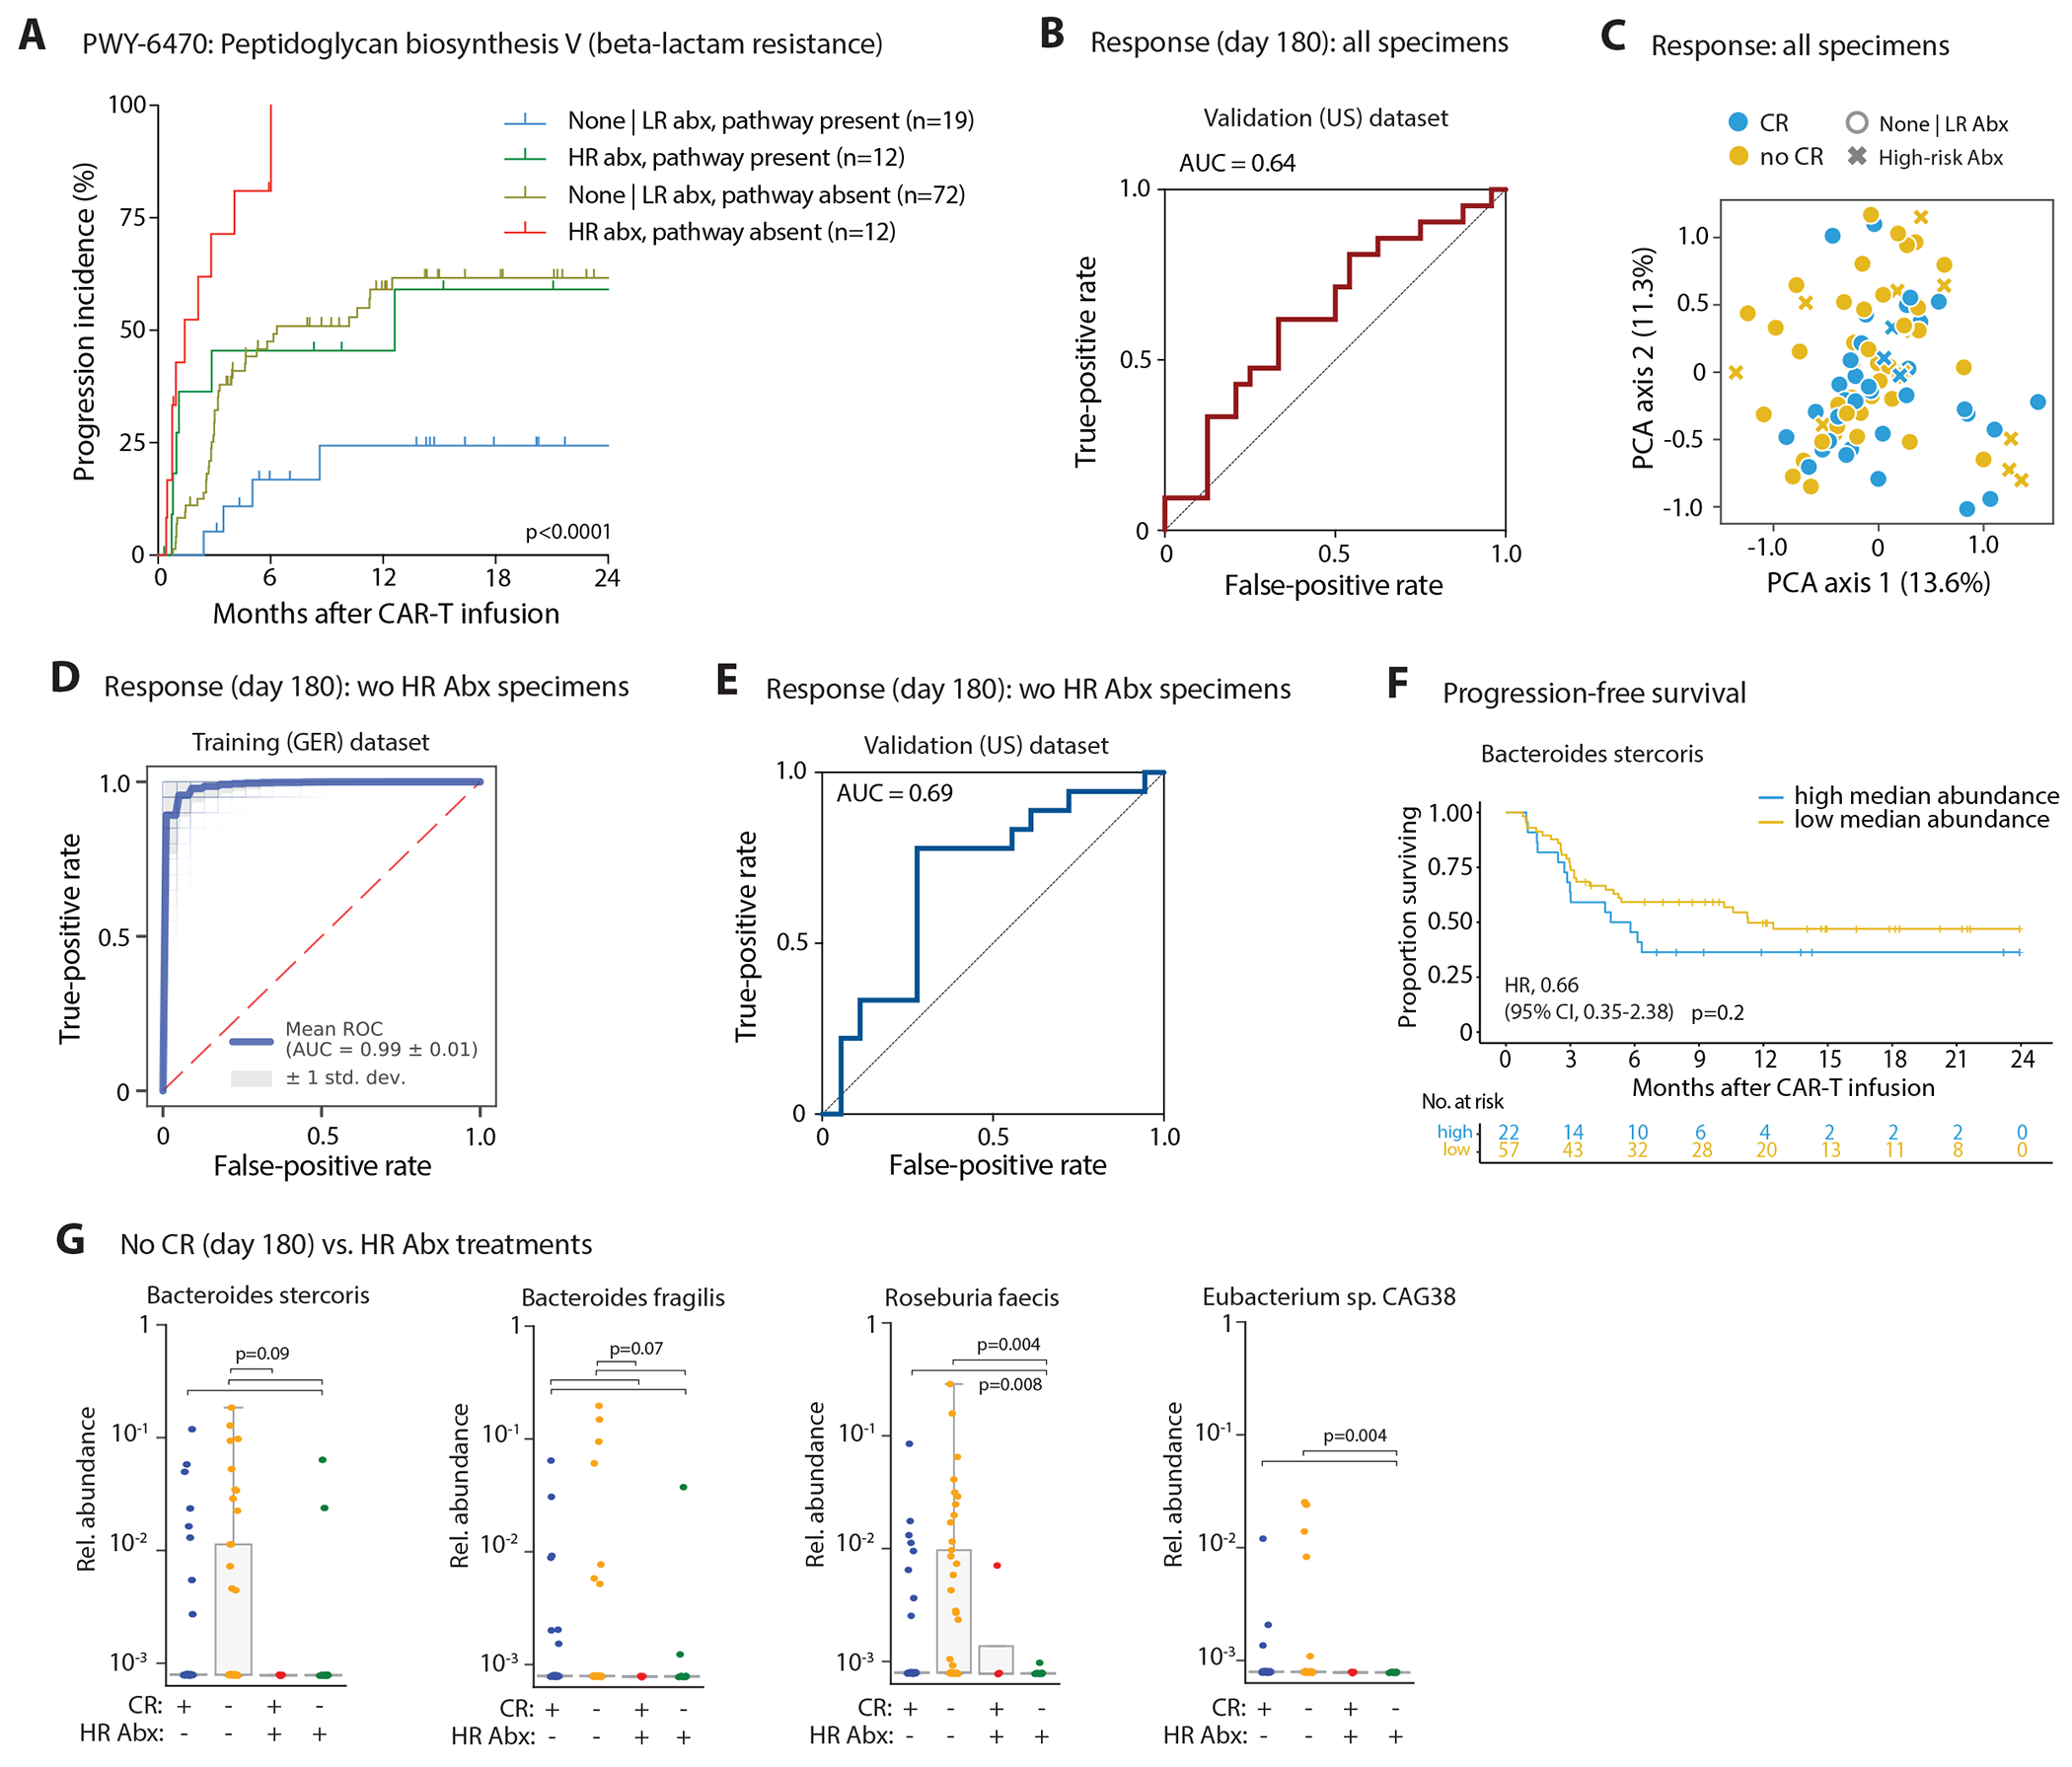
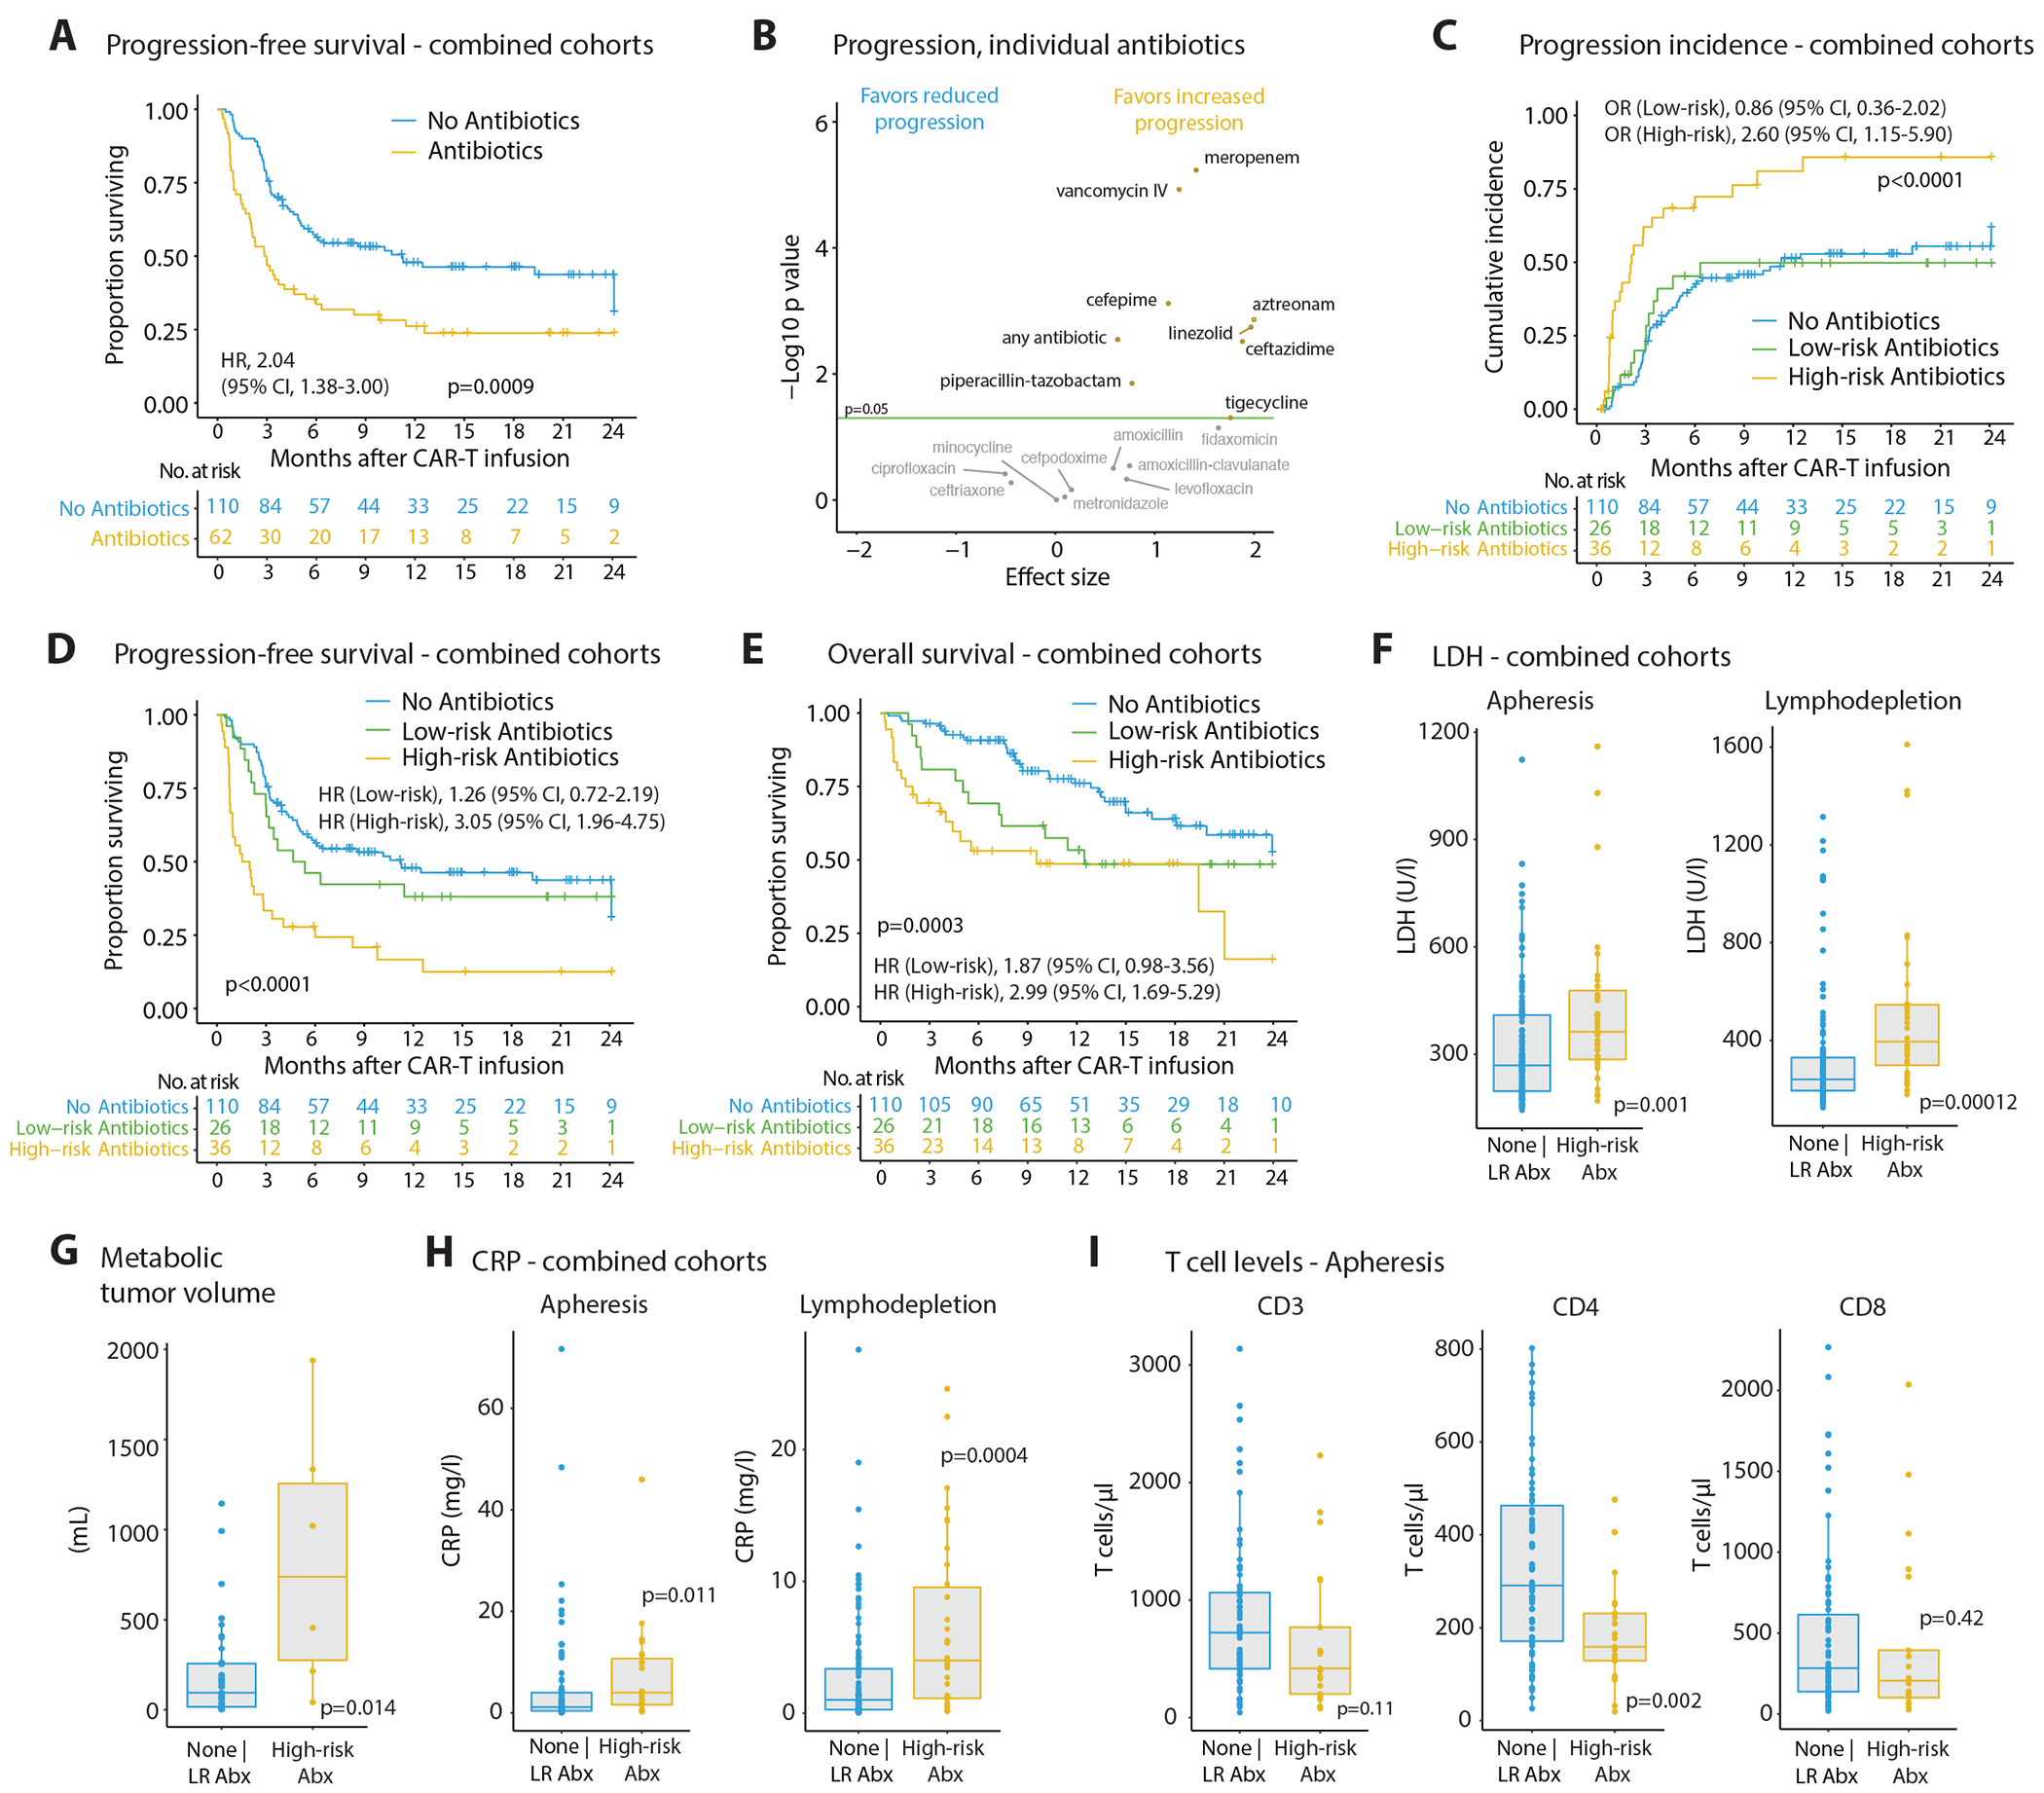
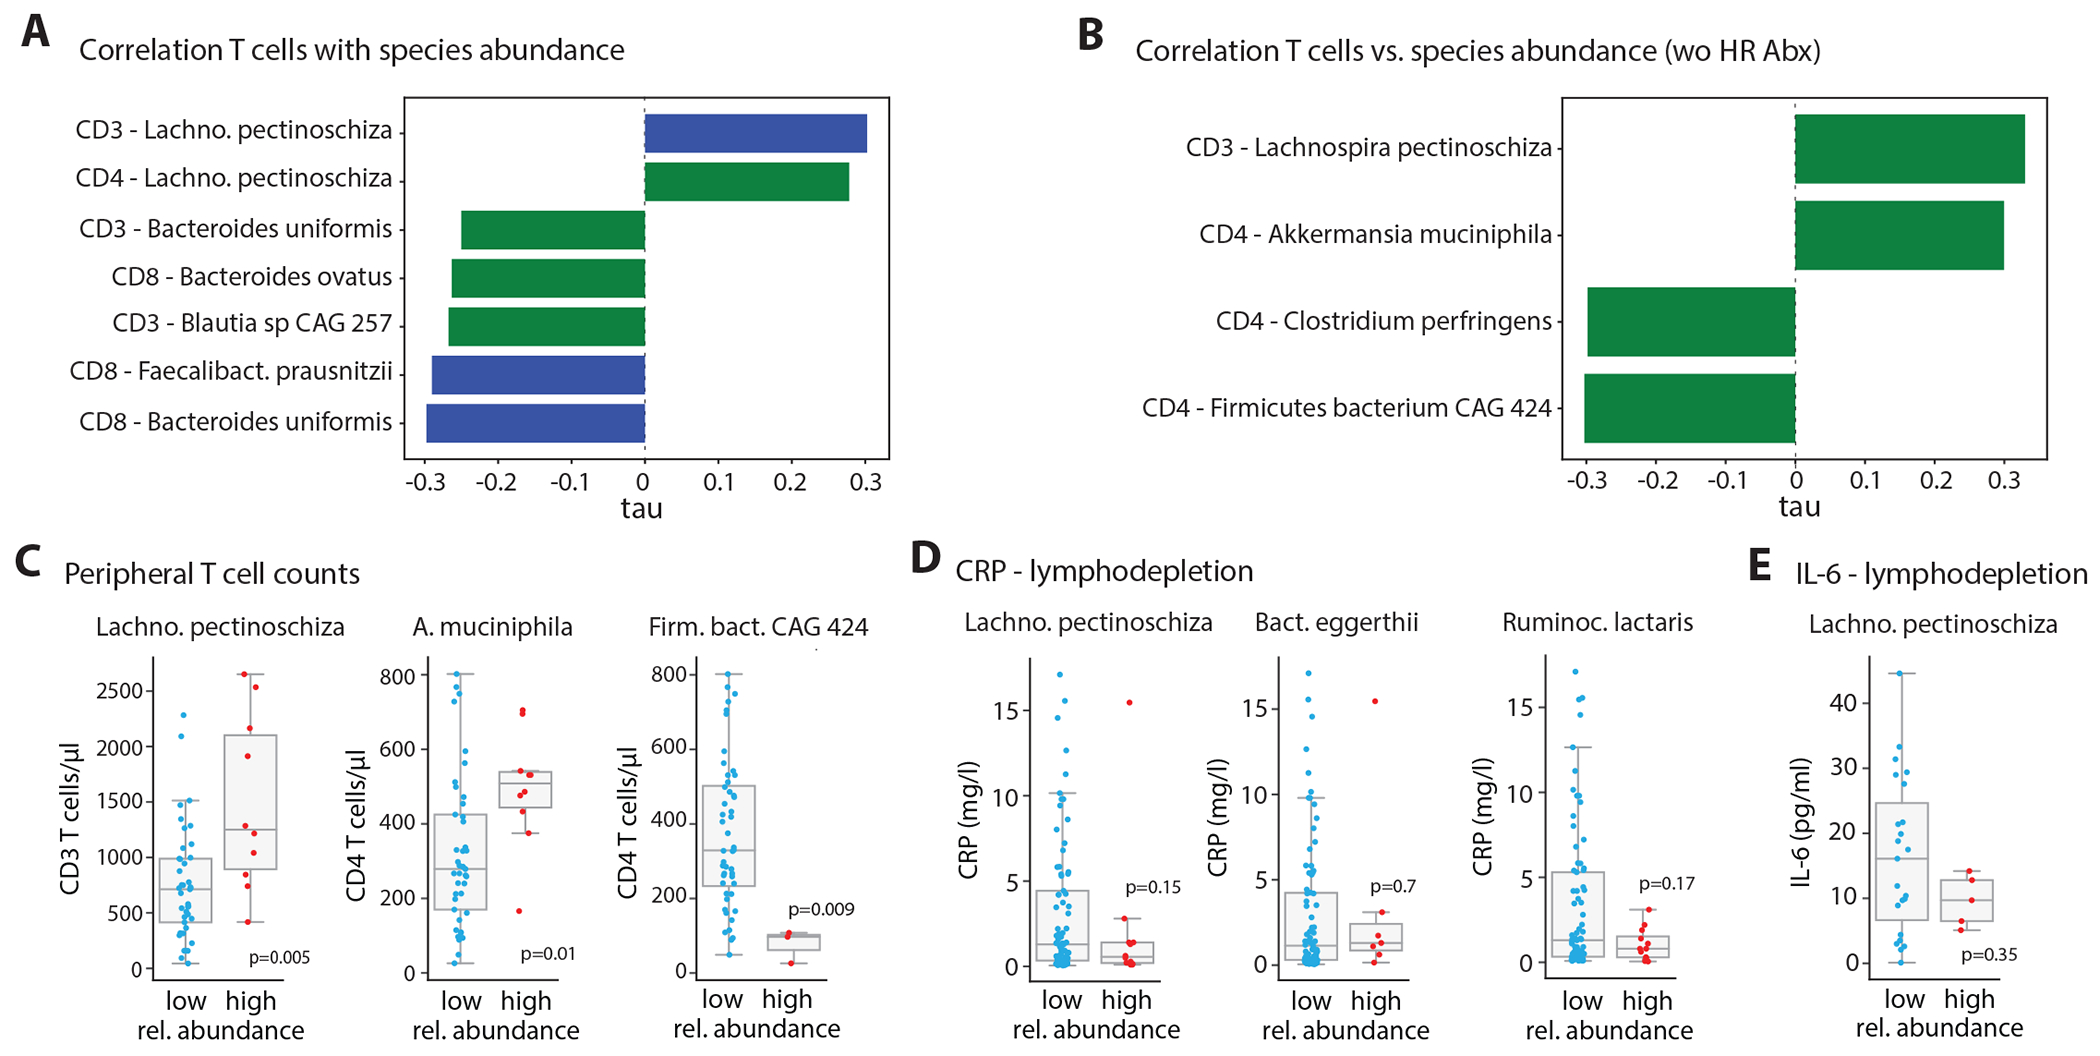
Increasing evidence suggests that the gut microbiome may modulate the efficacy of cancer immunotherapy. In a B cell lymphoma patient cohort from five centers in Germany and the United States (Germany, n = 66; United States, n = 106; total, n = 172), we demonstrate that wide-spectrum antibiotics treatment ('high-risk antibiotics') prior to CD19-targeted chimeric antigen receptor (CAR)-T cell therapy is associated with adverse outcomes, but this effect is likely to be confounded by an increased pretreatment tumor burden and systemic inflammation in patients pretreated with high-risk antibiotics. To resolve this confounding effect and gain insights into antibiotics-masked microbiome signals impacting CAR-T efficacy, we focused on the high-risk antibiotics non-exposed patient population. Indeed, in these patients, significant correlations were noted between pre-CAR-T infusion Bifidobacterium longum and microbiome-encoded peptidoglycan biosynthesis, and CAR-T treatment-associated 6-month survival or lymphoma progression. Furthermore, predictive pre-CAR-T treatment microbiome-based machine learning algorithms trained on the high-risk antibiotics non-exposed German cohort and validated by the respective US cohort robustly segregated long-term responders from non-responders. Bacteroides, Ruminococcus, Eubacterium and Akkermansia were most important in determining CAR-T responsiveness, with Akkermansia also being associated with pre-infusion peripheral T cell levels in these patients. Collectively, we identify conserved microbiome features across clinical and geographical variations, which may enable cross-cohort microbiome-based predictions of outcomes in CAR-T cell immunotherapy.


Conflict of interest statement

V.B. received research funding from Bristol Myers-Sqibb (BMS)/Celgene, Gilead, Janssen, Novartis, Roche and Takeda; V.B. received honoraria from Gilead, Janssen and Novartis. M.-L.S. is a consultant for Novartis, Gilead and Janssen. H.P. is a consultant for Gilead, Abbvie, Pfizer, Novartis, Servier, and BMS. H.P. received research funding from BMS. H.P. received honoraria from Novartis, Gilead, Abbvie, BMS, Servier and Janssen-Cilag. M.L.D. reports consultancy/advisory/honoraria for Kite/Gilead, Novartis, Atara, Precision Biosciences, Celyad, Bellicum, GSK, Adaptive Biotech, and Anixa Biosciences, and research funding from Kite/Gilead, Novartis, and Atara. FLL reports consultancy/advisory for Allogene, Amgen, Bluebird Bio, BMS/Celgene, Calibr, Cellular Biomedicine Group, Cowen, EcoR1, Emerging Therapy Solutions, GammaDelta Therapeutics, Gerson Lehrman Groupt, Iovance, Kite Pharma, Janssen, Legend Biotech, Novartis, Sana, Takeda, Wugen, and Umoja, and research funding from Kite/Gilead, Allogene, Novartis, BlueBird Bio, BMS, NCI, Leukemia and Lymphoma Society, and education or editorial activity for Aptitude Health, ASH, BioPharma Communications CARE Education, Clinical Care Options Oncology, Imedex, Society for Immunotherapy of Cancer. M.D.J. reports consultancy/advisory for Kite/Gilead, Novartis, BMS, MyeloidTx, and research funding from Incyte and Kite/Gilead. The remaining authors declare no competing interests. E.E. is a scientific cofounder of DayTwo and BiomX, and an advisor to Hello Inside, Igen, and Aposense in topics unrelated to this work.

Figures

Extended Data Figure 1.
Extended Data Figure 1.. Effects of antibiotic exposure on survival outcomes and on development of toxicities in CD19-targeted CAR-T cell treated lymphoma patients.
(A) Kaplan-Meier curves for progression-free survival (PFS) in the German and US cohorts displayed separately according to exposure to any antibiotic within 3 weeks before CAR-T cell infusion. (B) Incidence of progression and (C) overall survival in the combined cohort stratified by pre-infusion antibiotic exposure. (D) PFS for the US and the German patient cohorts displayed according to antibiotic risk strata (no antibiotic exposure vs. exposures to low- or to high-risk antibiotics in the three-weeks pre-infusion time window). (E) Histograms of the frequencies of CRS or ICANS grades according to antibiotic risk stratification; statistics by logrank tests (for survival analyses) and Fisher’s exact tests.
Extended Data Figure 2.
Extended Data Figure 2.. Antibiotic classes administered to CAR-T cell treated lymphoma patients.
Frequency of individual antibiotic drugs administered to patients within three weeks before (A) and four weeks after (B) CAR-T cell infusion. Histogram of patients receiving individual antibiotics over the course of CAR-T cell therapy for the 8 most frequently prescribed antibiotics in the combined cohort (C) and stratified by country (D). Note that cefepime was only administered to US patients and is therefore not shown in D.
Extended Data Figure 3.
Extended Data Figure 3.. Associations of pre-CAR-T cell infusion antibiotic exposure, tumor burden, performance status, CAR-T cell product and peripheral blood phenotypes.
Serum levels of LDH (A) in German and US patients during the time point of lymphodepletion chemotherapy stratified by whether patients received none or low-risk antibiotics (US: n = 83, Germany: n= 20) versus high-risk antibiotics (US: n = 20: Germany: n= 16). (B) Serum levels of CRP in German and US patients during the time point of lymphodepletion chemotherapy stratified by whether patients received none or low-risk antibiotics versus high-risk antibiotics. (C) IL-6 serum levels in patients at the day of CAR-T cell infusion (none | LR antibiotics: n = 67; HR antibiotics: n = 18). (D) Histograms of the frequencies of bulky lymphomas (>10cm by radiological measurement), or (E) ECOG performance status according to antibiotic risk stratification. (F) Histograms of the frequencies of antibiotic exposures, or (G) ECOG performance status (left), or ICANS grades (right) according to type of CAR-T cell product administered to the patients. (H) Peripheral blood CD3, CD4 and CD8 T cell counts at the time point of leukapheresis displayed separately for US and German patients. (I) Blood T cell counts stratified by the number of treatment lines prior to CD19-directed CAR-T cell therapy (≤ 3: n = 32; ≥ 4: n = 19). (J and K) FACS analyses of peripheral blood T cell subsets of CAR-T cell treated patients from Moffitt Cancer Center at the time of leukocyte apheresis and stratified by antibiotic exposure (none | LR antibiotics: n = 39; HR antibiotics: n = 12). CD4 and CD8 stem central memory (SCM; CCR7+, CD45RO−), central memory (CM; CCR7+, CD45RO+), effector memory (EM; CCR7−, CD45RO+), and effector (E; CCR7−CD45RO−) subsets are shown. Statistics for A-C, H, I, K by Mann-Whitney tests, for E-G by Fisher’s exact tests.
Extended Data Figure 4.
Extended Data Figure 4.. Multivariate analysis of antibiotic exposure prior to CD19-targeted CAR-T cell infusion and PFS or OS.
(A) The multivariate Cox model was adjusted for age (stratified by 65 years of age), ECOG (grade 0 and 1 vs. higher), country (Germany vs. US), LDH (normal vs. higher than ULN), CRP (normal vs. higher than 5mg/dl), bulky disease (> 10cm) and number of prior therapies (1-3 vs. 4-9). (B) The multivariate Cox model was adjusted for age (stratified by 65 years of age), ECOG (grade 0 and 1 vs. higher), country (Germany vs. US), LDH (normal vs. higher than ULN), CRP (normal vs. higher than 5mg/dl), bulky disease (> 10cm) and number of prior therapies (1-3 vs. 4-9). Error bars represent the low and high 95% confidence intervals (CI) of HR; *p<0.05; **p<0.01
Extended Data Figure 5.
Extended Data Figure 5.. Gut microbiome diversity metrics grouped by clinical variables and outcomes.
(A) Number of stool samples collected over the course of CAR-T cell therapy by center and country (n = 351 in total). (B) Shannon indices for alpha diversity of the basal gut microbiome (i.e., samples collected between days −21 and 0 relative to CAR-T cell infusion and species composition averaged by mean in case of multiple samples per patient) and grouped for CR vs. no CR at day 180 (left; CR: n = 38, no CR: n = 41 patients), or early progression at day 180 (right; ≤ 180 days: progression within 6 months after infusion (n = 37); no | > 180 days: no progression within follow-up or progression after 6 months after infusion (n = 42 patients) after excluding specimens collected while or less than two weeks after high-risk antibiotics exposure. (C and D) Shannon’s diversity of the basal gut microbiome, after the same exclusion of HR antibiotic samples, grouped for CRS (n = 7, 40, 28, 4 patients [grade 0, 1, 2, 3+4]) and ICANS grades (n = 45, 12, 11, 11 patients [grade 0, 1, 2, 3+4]). (E) PCoA plots based on Bray-Curtis dissimilarity metrics of the microbiome species and metabolic pathways beta-diversity in all samples color-coded for German vs. US patients. (FH) PCoA plots as in (E) for species composition color-coded for ECOG levels (F), number of prior therapy lines (PT; prior to CAR-T cell therapy) (G), and day of specimen collection relative to the day of CAR-T cell infusion (i.e., day 0) (H). Group comparisons carried out by Mann-Whitney tests or Kruskal-Wallis rank tests.
Extended Data Figure 6.
Extended Data Figure 6.. Analyzing microbiome features associated with major cohort characteristics.
(A) Differential relative abundance analyses by log-fold changes and statistical testing by Mann-Whitney tests illustrated with volcano plots for species and metabolic pathways encoded in the fecal metagenomes: the log2 abundance in none | LR antibiotic samples (n = 79) / abundance in HR antibiotic samples (n = 16), versus the significance of the abundance difference. Metabolic pathways that have both p-value < 0.05 and absolute log2 fold change > 1 are shown in red. (B) Bar-plots indicating the fold-change of the top features revealed by the differential abundance analyses described in (A). (C and D) Differential abundance analyses for species and metabolic pathway composition comparing the German (n = 50 patients) and the US (n = 45 patients) cohort. Here, comparisons of fecal metagenomes for samples collected in the 3-weeks pre-CAR-T cell infusion window are shown. Group comparisons carried out by Mann-Whitney tests.
Extended Data Figure 7.
Extended Data Figure 7.. Analyzing microbiome features associated with major outcomes of CAR-T cell therapy.
Differential abundance analyses were done as described in Extended Data Figure 7 with different grouping variables. (A) Left, volcano plots showing species and metabolic pathway compositions of the abundance in patients with survival > 180 day (n = 77) / abundance in patients with survival ≤ 180 day (n= 18) versus the significance of the abundance difference by Mann–Whitney tests. All samples collected in the pre-infusion period were included here. Features with a p-value < 0.05 and absolute log2 change > 1 are shown in red. Middle, bar-plots indicating the fold-change of the top species found in (A). Right, comparison of the relative abundances of the indicated species between patients with survival shorter or longer than 180 days. (B) As in (A), but samples collected during and less than two weeks after exposure to high-risk antibiotics were excluded (alive: n = 66; dead: n = 13). (C and D) As in (B), for metabolic pathways encoded in fecal metagenomes comparing 6-months survival (alive vs. dead at day 180) and early progression (≤ 180 days: progression within 6 months after infusion vs. no progression within follow-up or progression after day 180; n = 37 vs. n = 42). Group comparisons were computed by Mann-Whitney tests.
Extended Data Figure 8.
Extended Data Figure 8.. Summary of differentially abundant microbiome features by clinical variables and outcomes including all specimens collected in the 3-weeks pre-infusion period.
Heatmaps showing the associations between the species (A) and metabolic pathways (B) of the baseline gut microbiome and clinical parameters and major outcomes (Mann–Whitney tests, p-value < 0.05). Color indicates the Log10 of the following ratios: age (>= 65 / < 65 years), country (Germany / US), ECOG (grades 0-1 / 2-3), LDH (LDH at lymphodepletion chemotherapy: >= 280 / < 280 U/ml), HR antibiotic exposures (no / yes), response (CR / no CR at day 180), survival (alive / dead at day 180), early progression (lymphoma progression until day 180 / progression > 180 days or no progression during follow-up) and CRS (grades <=1 / >1). Associations with p-value > 0.05 or with absolute log2 fold change < 1 were set on the heatmap to have a log10 fold change of zero.
Extended Data Figure 9.
Extended Data Figure 9.. Summary of differentially abundant microbiome features by clinical variables and outcomes excluding baseline specimens collected while or within 2 weeks after exposure to high-risk antibiotics.
Heatmaps showing the associations between the species (A) and metabolic pathways (B) of the baseline gut microbiome and clinical parameters and major outcomes (Mann–Whitney tests, p-value < 0.05). Color indicates the Log10 of the following ratios: age (>= 65 / < 65 years), country (Germany / US), ECOG (grades 0-1 / 2-3), LDH (LDH at lymphodepletion chemotherapy: >= 280 / < 280 U/ml), response (CR / no CR at day 180), survival (alive / dead at day 180), early progression (lymphoma progression until day 180 / progression > 180 days or no progression during follow-up) and CRS (grades <=1 / >1). Associations with p-value > 0.05 or with absolute log2 fold change < 1 were set on the heatmap to have a log10 fold change of zero.
Extended Data Figure 10.
Extended Data Figure 10.. Interaction of antibiotic exposures, survival outcomes and response prediction modeling.
(A) Incidence curves for disease progression in patients were stratified according to high-risk antibiotics exposure in the 3-weeks pre-CAR-T cell infusion time window and according to presence of the peptidoglycan biosynthesis V - pathway in the patients’ stool metagenomes. (B) Deterministic logistic regression models were trained on clinical variables and pre-CAR-T cell infusion gut microbial species composition (mean per patient) of the German cohort and their performance was assessed on the US cohort (with all baseline samples: n = 45 patients; after excluding high-risk antibiotic samples: n = 36 patients). Area under the curve (AUC) receiver operating characteristic (ROC) curves indicating the false-positive and true-positive rates for predicting complete remission (CR) vs. non-CR at day 180 based on an analysis including all patient samples. (C) PCA computed for the whole dataset (i.e., training and validation data including high-risk antibiotic samples) based on the features selected during the training process of response at day 180 after CAR-T cell infusion. (D) AUROC curves indicating the false-positive and true-positive rates for predicting complete remission (CR) vs. non-CR at day 180 after training the probabilistic model on the German dataset that excluded high-risk antibiotics exposed samples. (E) AUROC curves indicating the false-positive and true-positive rates for predicting complete remission (CR) vs. non-CR at day 180 based on a deterministic model analysis that excluded samples collected on or less than two weeks after exposure to high-risk antibiotics; data displayed for the US validation cohort. (F) PFS curve of patients after CAR-T cell infusion stratified by the median baseline relative abundance of Bacteroides stercoris as top feature for non-CR as revealed in the machine learning model for CR; only pre-infusion samples without HR antibiotic exposure were included. (G) Differences in relative abundances for the four most important species predicting non-response (no CR) grouped by response and high-risk antibiotic exposures; group comparisons carried out by pairwise Mann-Whitney tests with FDR correction of p-values (n = 38 / 41 / 4 / 12 patients [from left to right]); FDR corrected p-values for B. stercoris are 0.089 (for all three comparisons), for B. fragilis are 0.0725 (for all four comparisons), and for E. sp. CAG38 are 0.0037 (for both comparisons). Statistics in (A) and (F) performed by logrank tests.
Figure 1.
Figure 1.. Associations of antibiotic drug exposure prior to CD19-directed CAR-T cell therapy with survival outcomes, tumor burden and inflammation.
(A) The international cohort of non-Hodgkin’s lymphoma (NHL) patients consisted of German (n = 66) and US (n = 106) participants prospectively recruited between 2018 and 2021 and assessed for antibiotic exposures within 3 weeks prior to CAR-T cell infusion and survival outcomes up to 24 months following CAR-T cell treatment; progression-free survival (PFS) was significantly reduced in patients receiving any antibiotic treatment within the baseline time period. (B) Effects of individual antibiotic classes administered in the 3-weeks pre-CAR-T period on progression incidence in our international patient cohort. (C) Incidence of lymphoma progression, (D) Kaplan-Meier curves on PFS and (E) overall survival (OS) in our international patient cohort after CAR-T cell therapy stratified by high-risk (i.e., broad-spectrum carbapenem, cephalosporin or piperacillin/tazobactam antibiotics) vs. low-risk (any other antibiotic) or no antibiotic exposure in the 3-weeks period prior to CAR-T cell infusion (logrank test: for (C) p = 2.26e-05, for (D) p = 3.8e-5). (F) Serum levels of LDH as a marker for tumor burden at the time point of leukocyte apheresis (left) or during lymphodepleting chemotherapy (right) stratified into patients receiving no or low-risk (LR) antibiotics (LDH: n = 132, CRP: n = 127) vs. high-risk (HR) antibiotics (LDH: n = 36, CRP: n = 32) during the pre-CAR-T cell therapy time window. (G) Assessment of metabolic tumor volume by FDG-PET-CT scans in a subset of German and US patients combined and stratified by the type of baseline antibiotic exposure (none | LR Abx: n = 33; HR Abx: n = 8). (H) Serum levels of CRP as a marker for systemic inflammation measured at the time point of leukocyte apheresis (left) or during lymphodepleting chemotherapy (right) stratified into patients receiving no or low-risk (LR) antibiotics (LDH: n = 132, CRP: n = 127) vs. high-risk (HR) antibiotics (LDH: n = 36, CRP: n = 32) during the pre-CAR-T cell therapy time window. (I) Peripheral blood counts of CD3, CD4 and CD8 T cells in a subset of German and US patients combined and stratified by the type of antibiotic exposure in the 3-weeks pre-CAR-T cell period (none | LR Abx: n = 36; HR Abx: n = 15). Statistics by logrank and Mann-Whitney tests.
Figure 2.
Figure 2.. Gut microbiome characteristics and associations with clinical variables in CAR-T cell treated patients.
(A) Variation of microbial alpha diversity assessed by Shannon index over the course of CAR-T cell therapy in the subset of German and US patients; microbiome sequencing performed by shotgun metagenome sequencing (n = 116 patients, n = 351 fecal samples); diversity metrics shown between day −20 and 70 relative to CAR-T cell therapy. The red line displays the 7-days-window moving median of the Shannon indices with spline interpolation smoothing. (B) Left, Shannon’s alpha diversity as in (A), but stratified by the type of antibiotic exposure during specimen collection over the course of CAR-T cell therapy; right, analysis of Shannon’s diversity of paired patient samples before (i.e., during none or LR Abx administration) and during HR Abx exposures (n = 39 patients); in case of repeated samples per patient before or during HR Abx exposures sample means were used for plotting and statistics. (C) Mean-per-patient alpha diversity for patient samples collected between day 0 (day of CAR-T cell infusion) and day −21 grouped by response at day 180 (CR, complete remission [n = 42] vs. no CR [n = 53 patients]) or early progression (≤ 180 days: progression within 180 days after infusion [n = 47] vs. no progression within follow-up or progression after day 180 [n = 48 patients)]; HR antibiotic samples were included. (D) PERMANOVA analyses of the variance in microbiome features by analyzing the composition of species, metabolic pathways and microbial genes in samples collected within the 3-weeks period before CAR-T cell infusion and calculated as mean per patient (in case of multiple samples per patient; n = 95 patients, n = 124 samples included) and related to the following clinical variables: age (< 65 vs. >= 65 years), ECOG (grade 0-1 vs. 2-3), LDH (< 280 vs. >=280 U/ml assessed during lymphodepletion chemotherapy), presence of bulky disease (>10 cm: present vs. absent), number of lymphoma therapies prior to CAR-T cell infusion (0-3/4-6/7-10), antibiotic administration during baseline time period (none or only low-risk antibiotic exposure vs. high-risk antibiotic treatment given on or within the last two-week before the sampling day). (E) Principal coordinate analysis (PCoA) based on Bray Curtis dissimilarity metrics of the microbiome taxa and pathways beta-diversity in all longitudinally collected samples, color-coded for the antibiotic risk exposure at the sampling day. (F) Left, volcano plot showing the log2 fold-change in the relative abundance of microbial species in none and/or low-risk samples vs. those in high-risk antibiotic exposed samples against the significance of the abundance differences by Mann–Whitney tests. Samples with both p-value < 0.05 and an absolute log2 fold change > 1 are highlighted in red. Right, bar-plot showing the fold-change of the species found to be significantly different between antibiotic risk groups; here only stool microbiomes collected prior to CAR-T cell infusion were analyzed (n = 96 patients). (G) PERMANOVA analyses of the variance in microbiome features of baseline samples (mean-per-patient) by species, pathways and genes composition explained by the following therapy outcomes: response (see C), survival (alive vs. dead at day 180), early progression (see C), CRS (grade 0-1 vs. >= 2), ICANS (grade 0 vs. >= 1). (H) Heatmap of the PERMANOVA results as in (G), but excluding samples collected while or less than 14 days after exposure to high-risk antibiotics. Number of patients included in PERMANOVA tests: n = 95 in (G), n = 79 in (H). P-values (PERMANOVA): * p < 0.05, ** p < 0.01. For (B) and (C) Wilcoxon signed-rank test and Mann-Whitney test were used, respectively.
Figure 3.
Figure 3.. Prediction of response to CAR-T cell therapy by specific gut commensals.
Bayesian logistic regression models were trained on clinical variables and pre-CAR-T cell infusion gut microbial species composition (mean per patient) of the German cohort (with all baseline samples: n = 50 patients; after excluding high-risk antibiotic samples: n = 43 patients) and their performance was assessed on the US cohort (with all baseline samples: n = 45 patients; after excluding high-risk antibiotic samples: n = 36 patients). (A) Area under the curve (AUC) receiver operating characteristic (ROC) curves indicating the false-positive and true-positive rates for predicting complete remission (CR) vs. non-CR at day 180 based on an analysis including all patient samples; data for the US cohort as validation dataset are presented. (B) Bar plots summarizing individual predictions of patients in the training dataset based on 500 random draws from the guide function; the y-axis shows the predicted probability of the day 180 - response (CR vs. no CR; n = 16 HR abx; 79 none | LR abx patients). (C) AUROC curves indicating the false-positive and true-positive rates for predicting complete remission (CR) vs. non-CR at day 180 based on an analysis that excluded samples collected on or less than two weeks after exposure to high-risk antibiotics (data for the US cohort as validation dataset are presented). (D) The regression coefficients of the gut microbiome species that were found to be important for the prediction of CR vs. non-CR on day 180; species with the top 25% absolute coefficient values are presented. (E) Kaplan-Meier curve for PFS of patients after CAR-T cell infusion und stratified by the median baseline relative abundance [low (<= median) or high (> median)] of Akkermansia muciniphila as one of the top features for CR in 3C; only pre-infusion samples without HR antibiotic exposure were included (n = 79). (F) Differences in relative abundances for five among the most contributing species with highest coefficients for predicting response are shown with grouping by response and high-risk antibiotic exposures (n = 38 / 41 / 4 / 12 patients [from left to right]); FDR corrected p-values for B. eggerthii are 0.0066 (for both comparisons) and for E. ramosum are 0.0476 (for all three comparisons). Group comparisons by pair-wise Mann-Whitney tests with FDR correction of p-values.
Figure 4.
Figure 4.. Associations of gut microbes with patient T cells before CAR-T cell infusion.
(A) Kendall’s tau coefficient of significant correlations (green bar: p-value < 0.01; blue bar: p-value < 0.01 and FDR-corrected p-value < 0.05) between species in the microbiome of patients in the 3-weeks pre-infusion period and blood T cells counts at apheresis with HR antibiotic exposed samples included. (B) As in (A), but excluding samples collected while or less than two weeks after exposure to high-risk antibiotics. (C) Blood T cells counts at apheresis compared between patients with low (<= median) or high (> median) abundance of the indicated species; samples collected while or less than two weeks after exposure to high-risk antibiotics were excluded (number of patients L. p.: low / high abundance = 41 / 10; A.m.: low / high abundance = 41 / 10; F.b.: low / high abundance = 48 / 3). (D) Serum CRP (number of patients: L. p.: low / high abundance = 77 / 12; B.e.: low / high abundance = 82 / 7; F.b.: low / high abundance = 77 / 12) and (E) interleukin (IL)-6 levels (number of patients: L. p.: low / high abundance = 23 / 5) at the time point of lymphodepletion chemotherapy compared between patients with low (<= median) or high (> median) abundance of the indicated species using all baseline samples. Group comparisons carried out by Mann-Whitney tests; for (C)-(E) no abundance filtration was applied.

Comment in

References

    1. Gopalakrishnan V et al. Gut microbiome modulates response to anti-PD-1 immunotherapy in melanoma patients. Science 359, 97–103, doi:10.1126/science.aan4236 (2018). - DOI - PMC - PubMed
    1. Routy B et al. Gut microbiome influences efficacy of PD-1-based immunotherapy against epithelial tumors. Science 359, 91–97, doi:10.1126/science.aan3706 (2018). - DOI - PubMed
    1. Matson V et al. The commensal microbiome is associated with anti-PD-1 efficacy in metastatic melanoma patients. Science 359, 104–108, doi:10.1126/science.aao3290 (2018). - DOI - PMC - PubMed
    1. Peled JU et al. Intestinal Microbiota and Relapse After Hematopoietic-Cell Transplantation. J Clin Oncol 35, 1650–1659, doi:10.1200/JCO.2016.70.3348 (2017). - DOI - PMC - PubMed
    1. Stein-Thoeringer CK et al. Lactose drives Enterococcus expansion to promote graft-versus-host disease. Science 366, 1143–1149, doi:10.1126/science.aax3760 (2019). - DOI - PMC - PubMed

METHODS-ONLY REFERENCES:

    1. Lee DW et al. ASTCT Consensus Grading for Cytokine Release Syndrome and Neurologic Toxicity Associated with Immune Effector Cells. Biol Blood Marrow Transplant 25, 625–638, doi:10.1016/j.bbmt.2018.12.758 (2019). - DOI - PubMed
    1. Hogue SR, Gomez MF, da Silva WV & Pierce CM A Customized At-Home Stool Collection Protocol for Use in Microbiome Studies Conducted in Cancer Patient Populations. Microb Ecol 78, 1030–1034, doi:10.1007/s00248-019-01346-2 (2019). - DOI - PMC - PubMed
    1. Beghini F et al. Integrating taxonomic, functional, and strain-level profiling of diverse microbial communities with bioBakery 3. Elife 10, doi:10.7554/eLife.65088 (2021). - DOI - PMC - PubMed
    1. Hastie T TR, Friedman J The Elements of Statistical Learning: Data Mining, Inference, and Prediction. Second edn, 767 (Springer, 2009).
    1. McElreath R A Bayesian Course with Examples in R and STAN. 2nd edn, 612 (Chapman & Hall, 2020).

Publication types