. 2023 Mar;5(3):414-430.
doi: 10.1038/s42255-023-00761-7. Epub 2023 Mar 13.

NAD+ precursor supplementation prevents mtRNA/RIG-I-dependent inflammation during kidney injury

Affiliations

NAD+ precursor supplementation prevents mtRNA/RIG-I-dependent inflammation during kidney injury

Tomohito Doke et al. Nat Metab. 2023 Mar.

Abstract

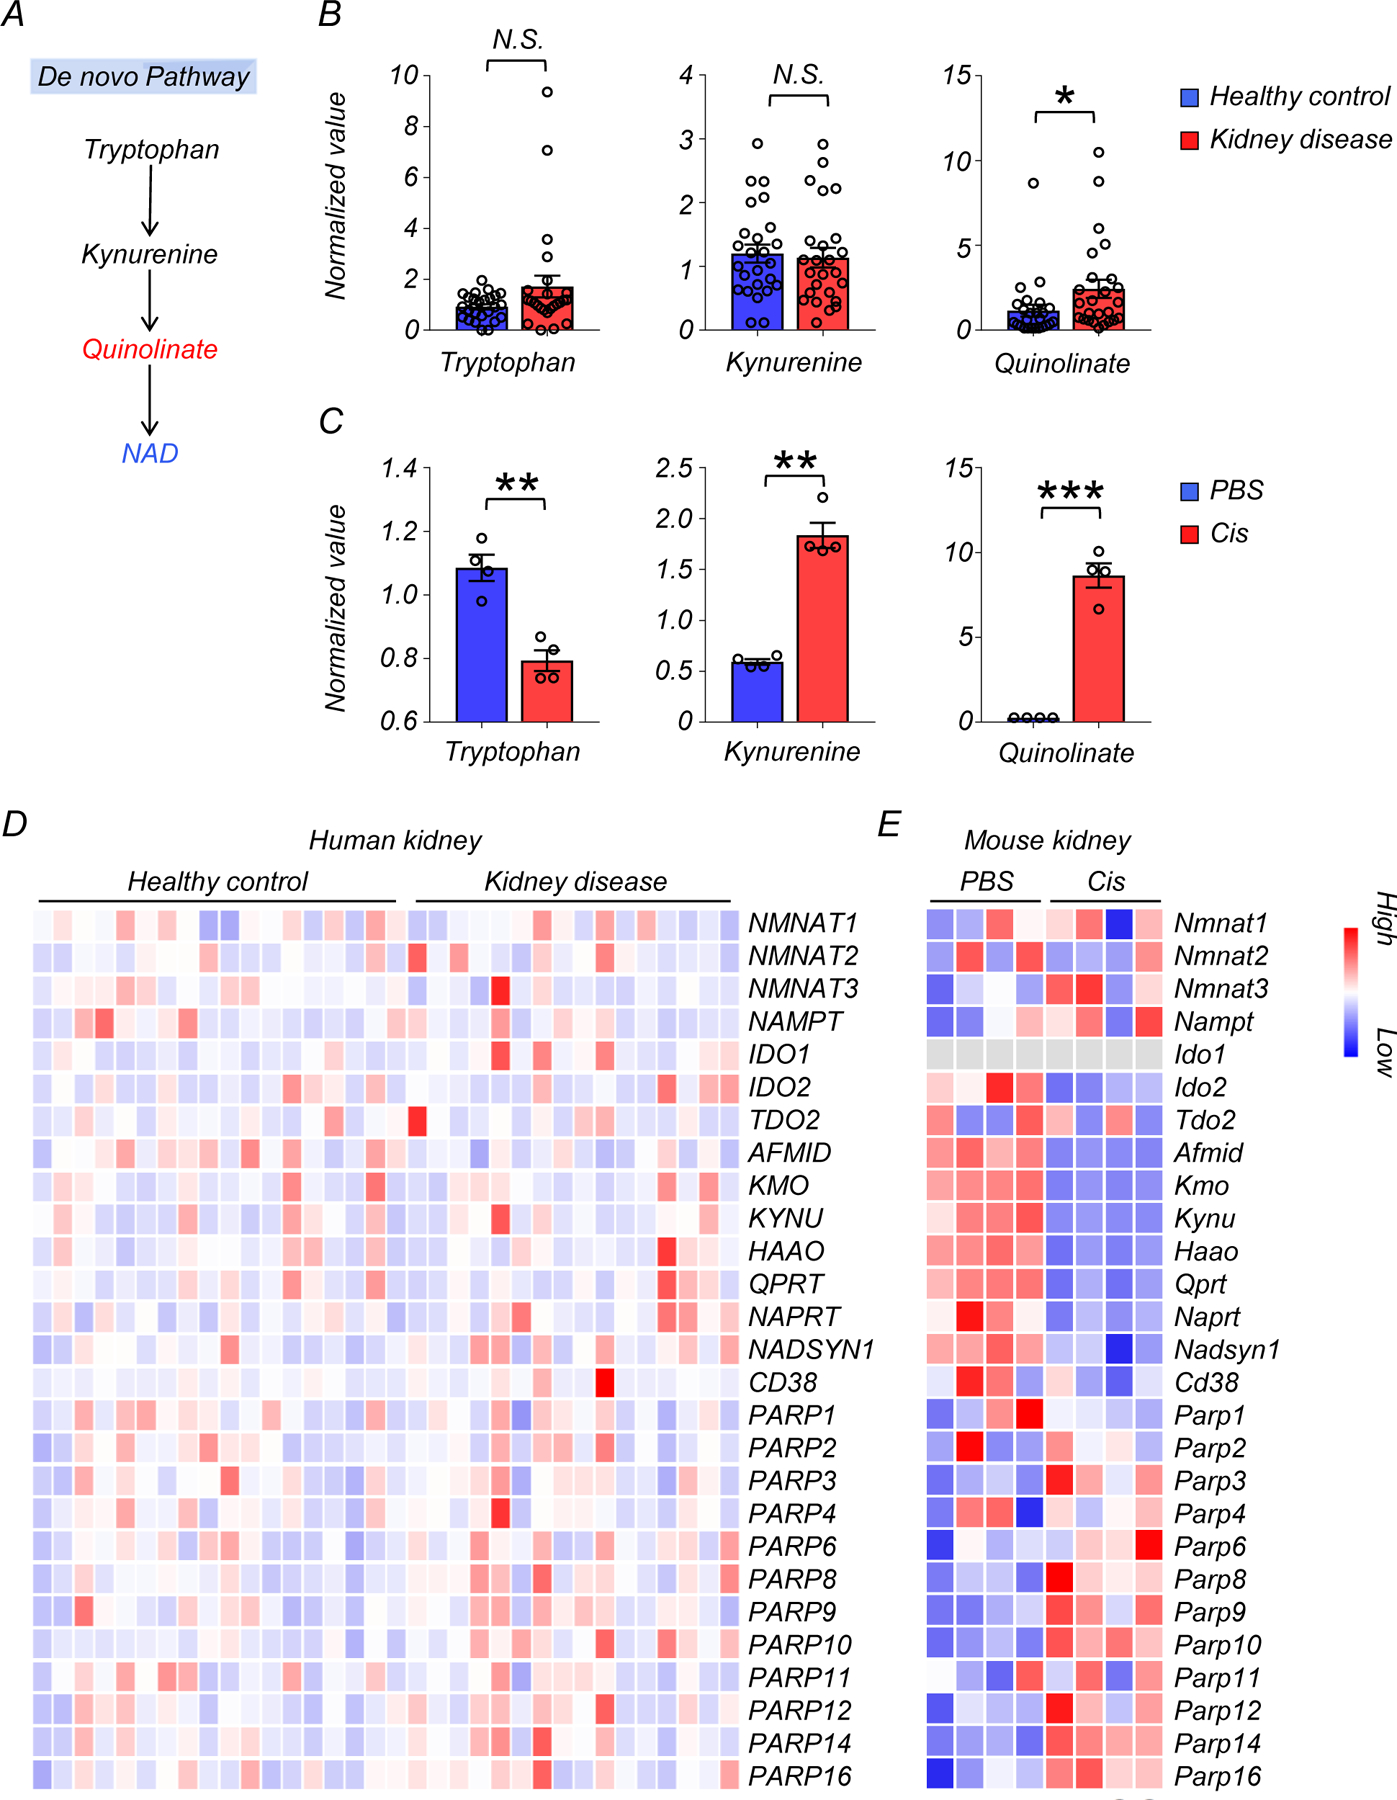
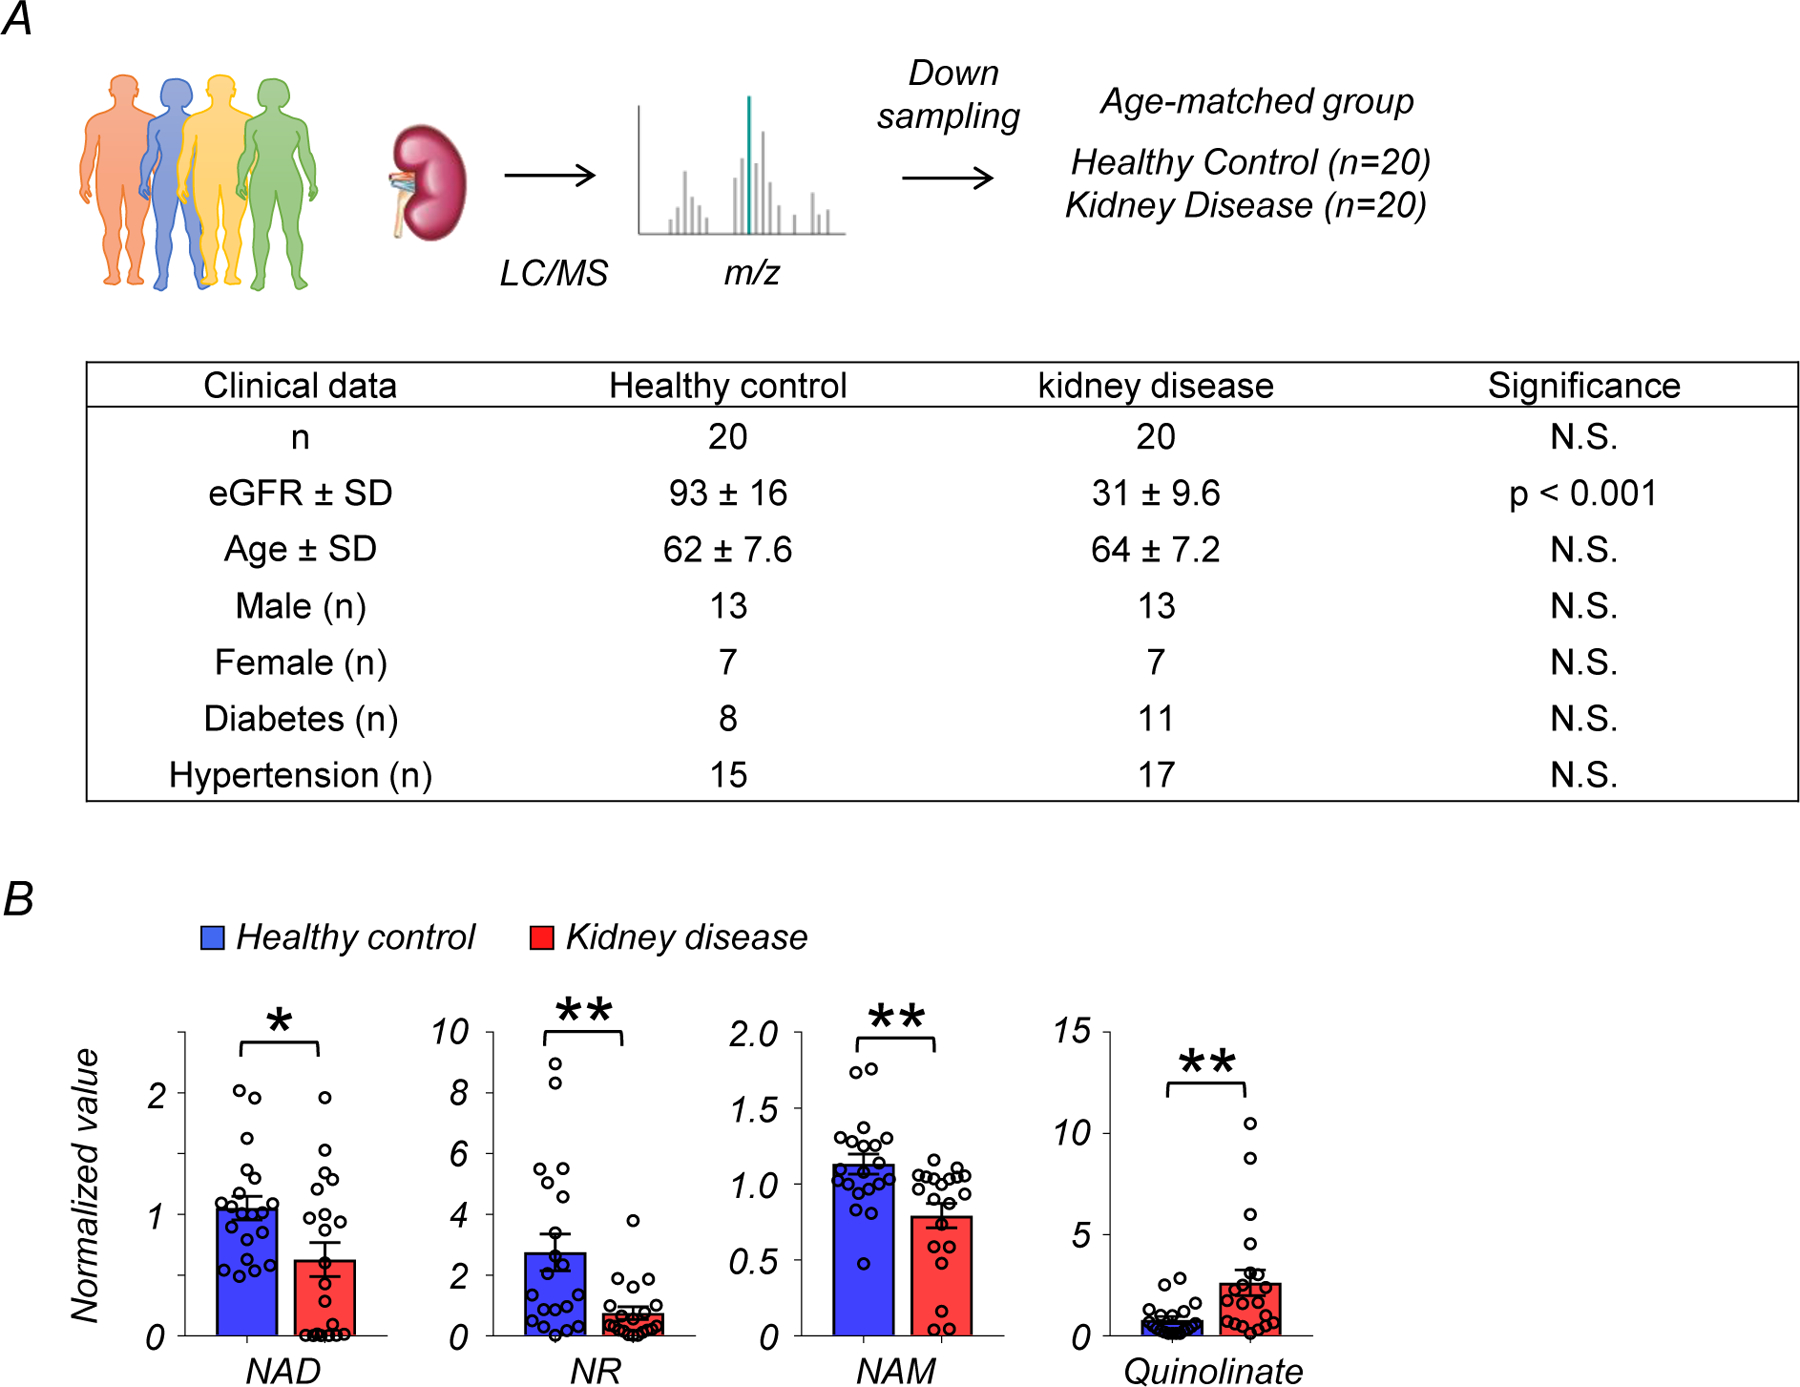
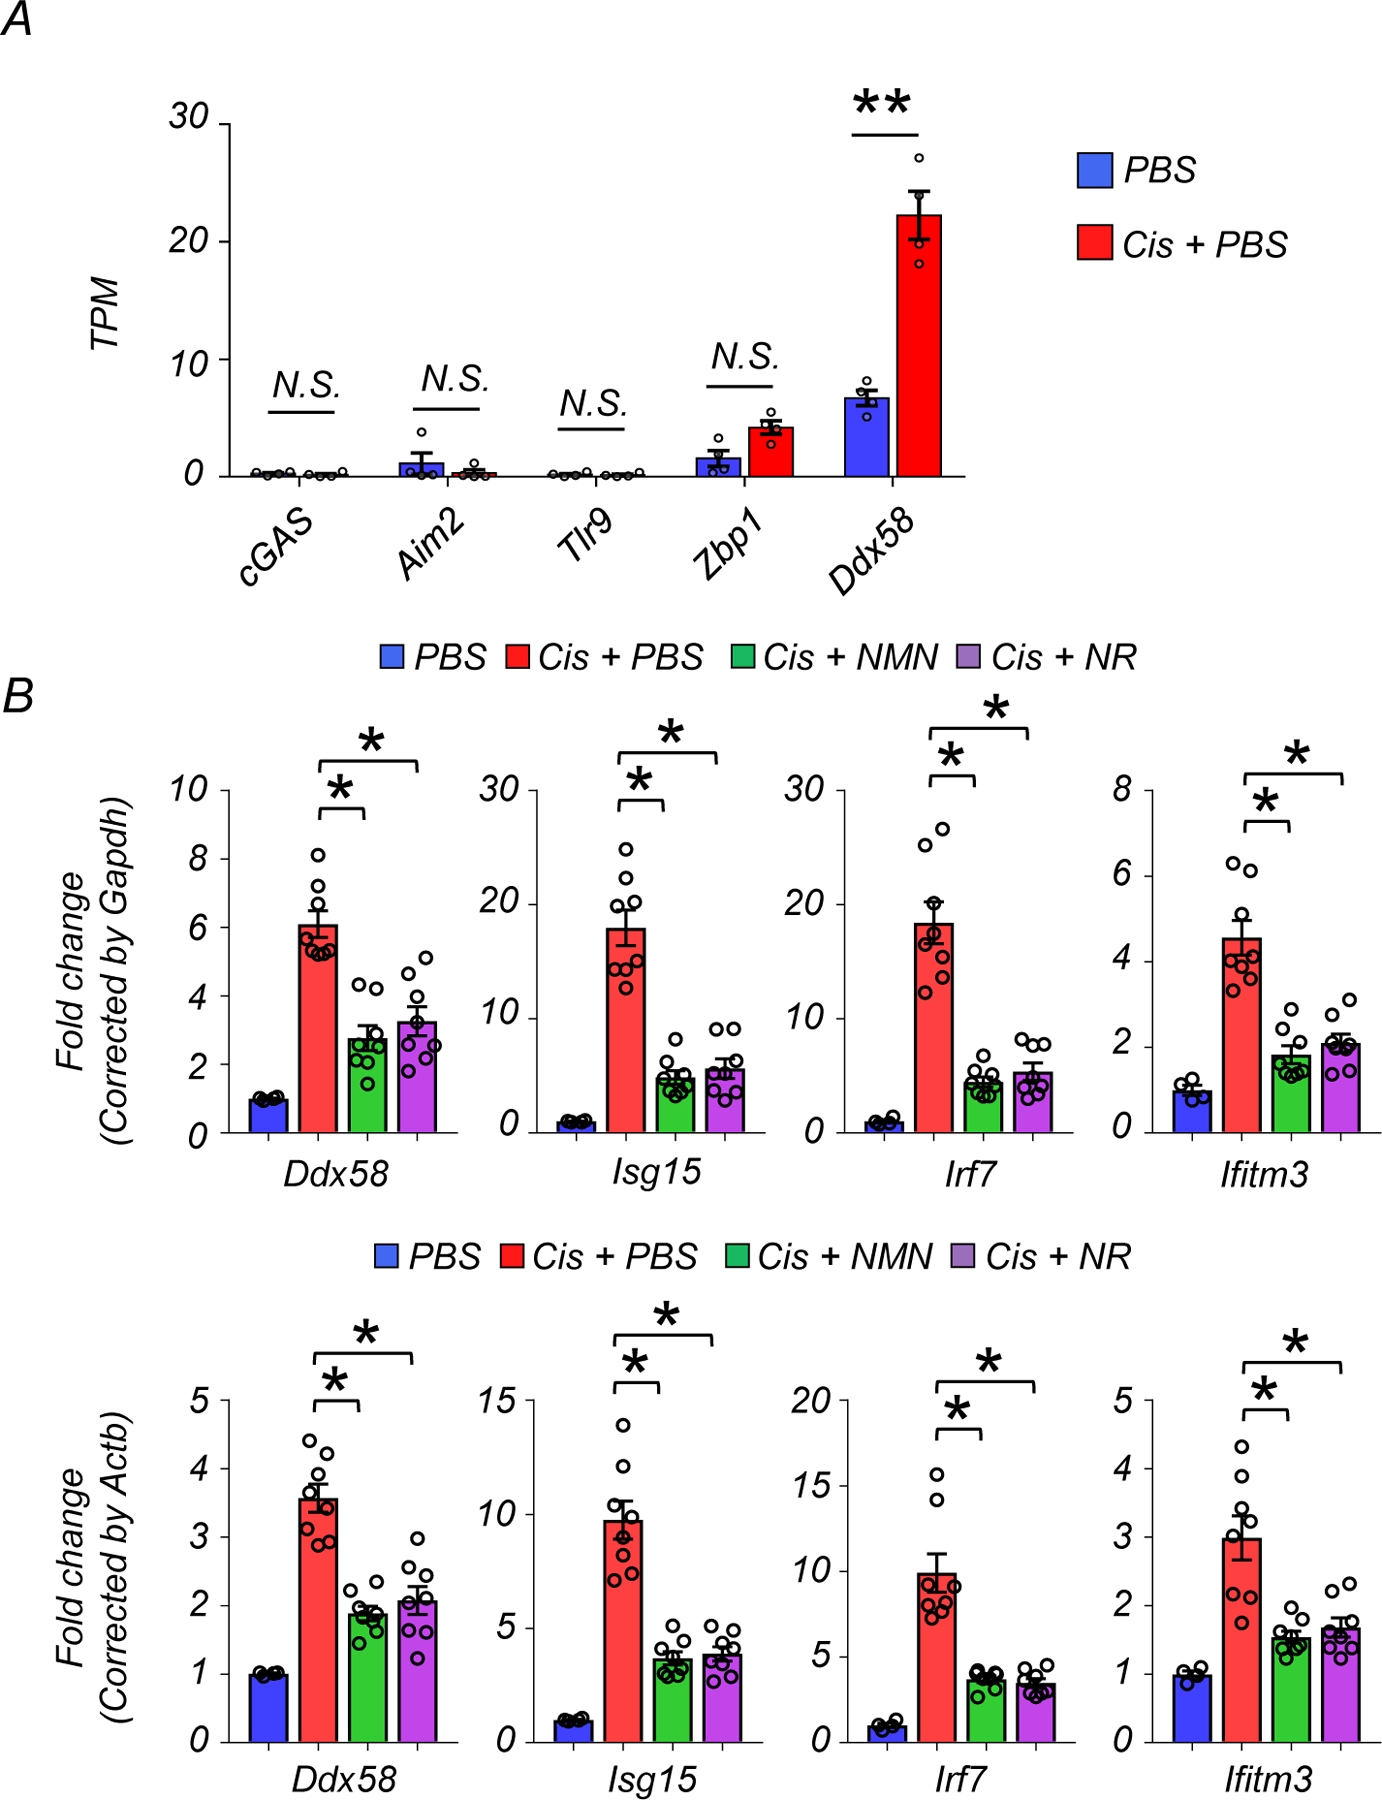
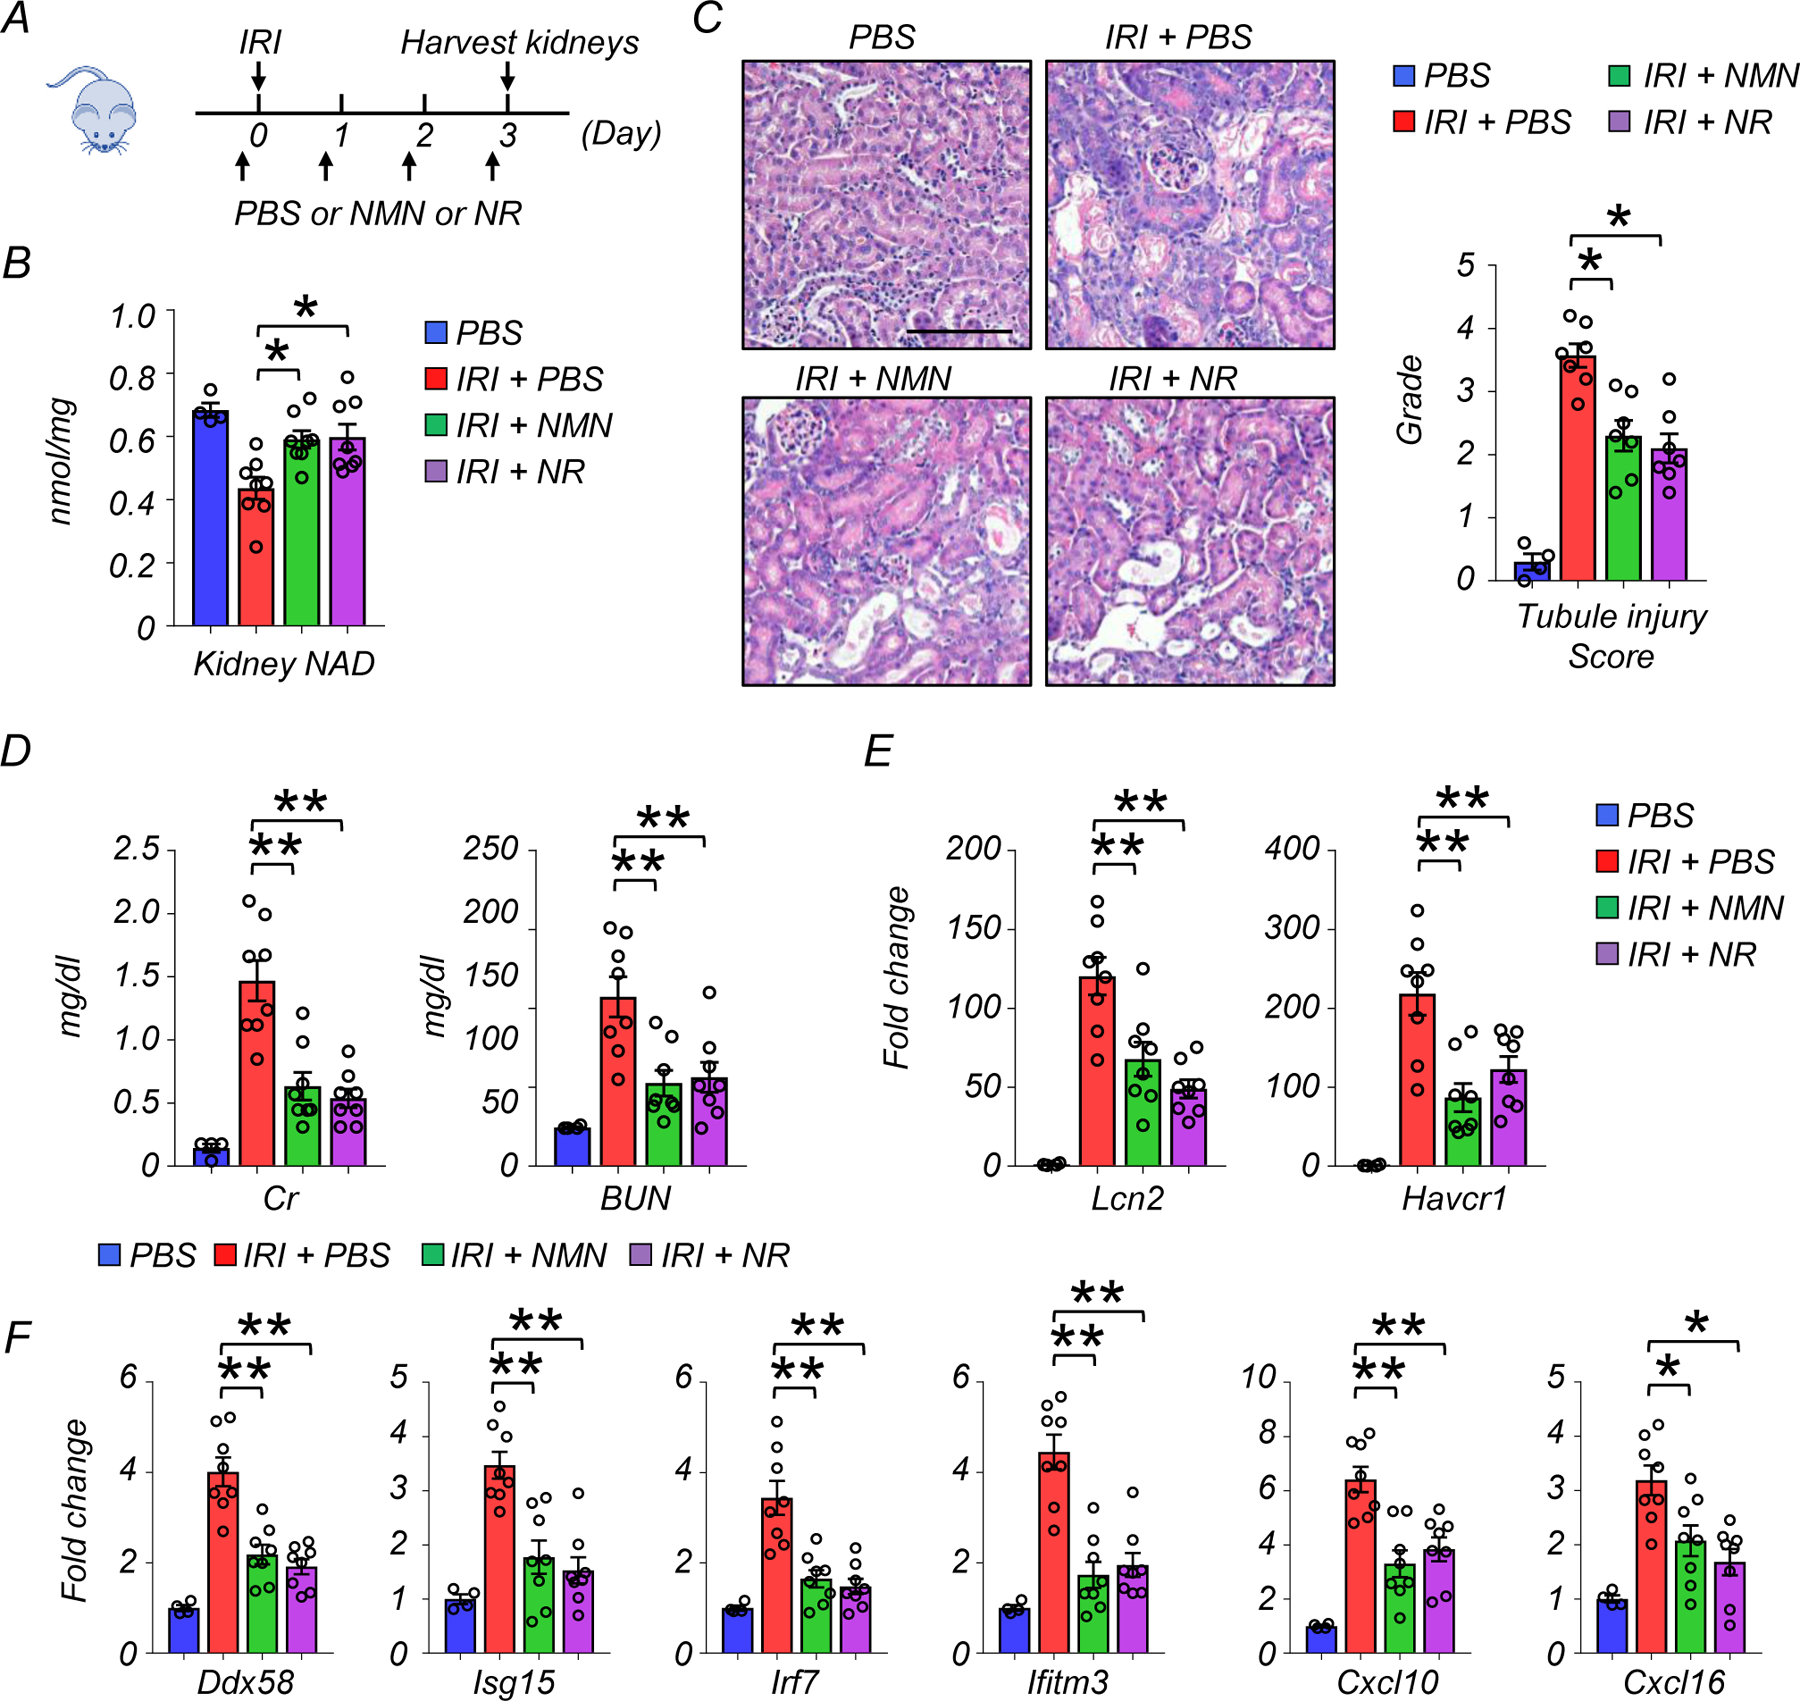
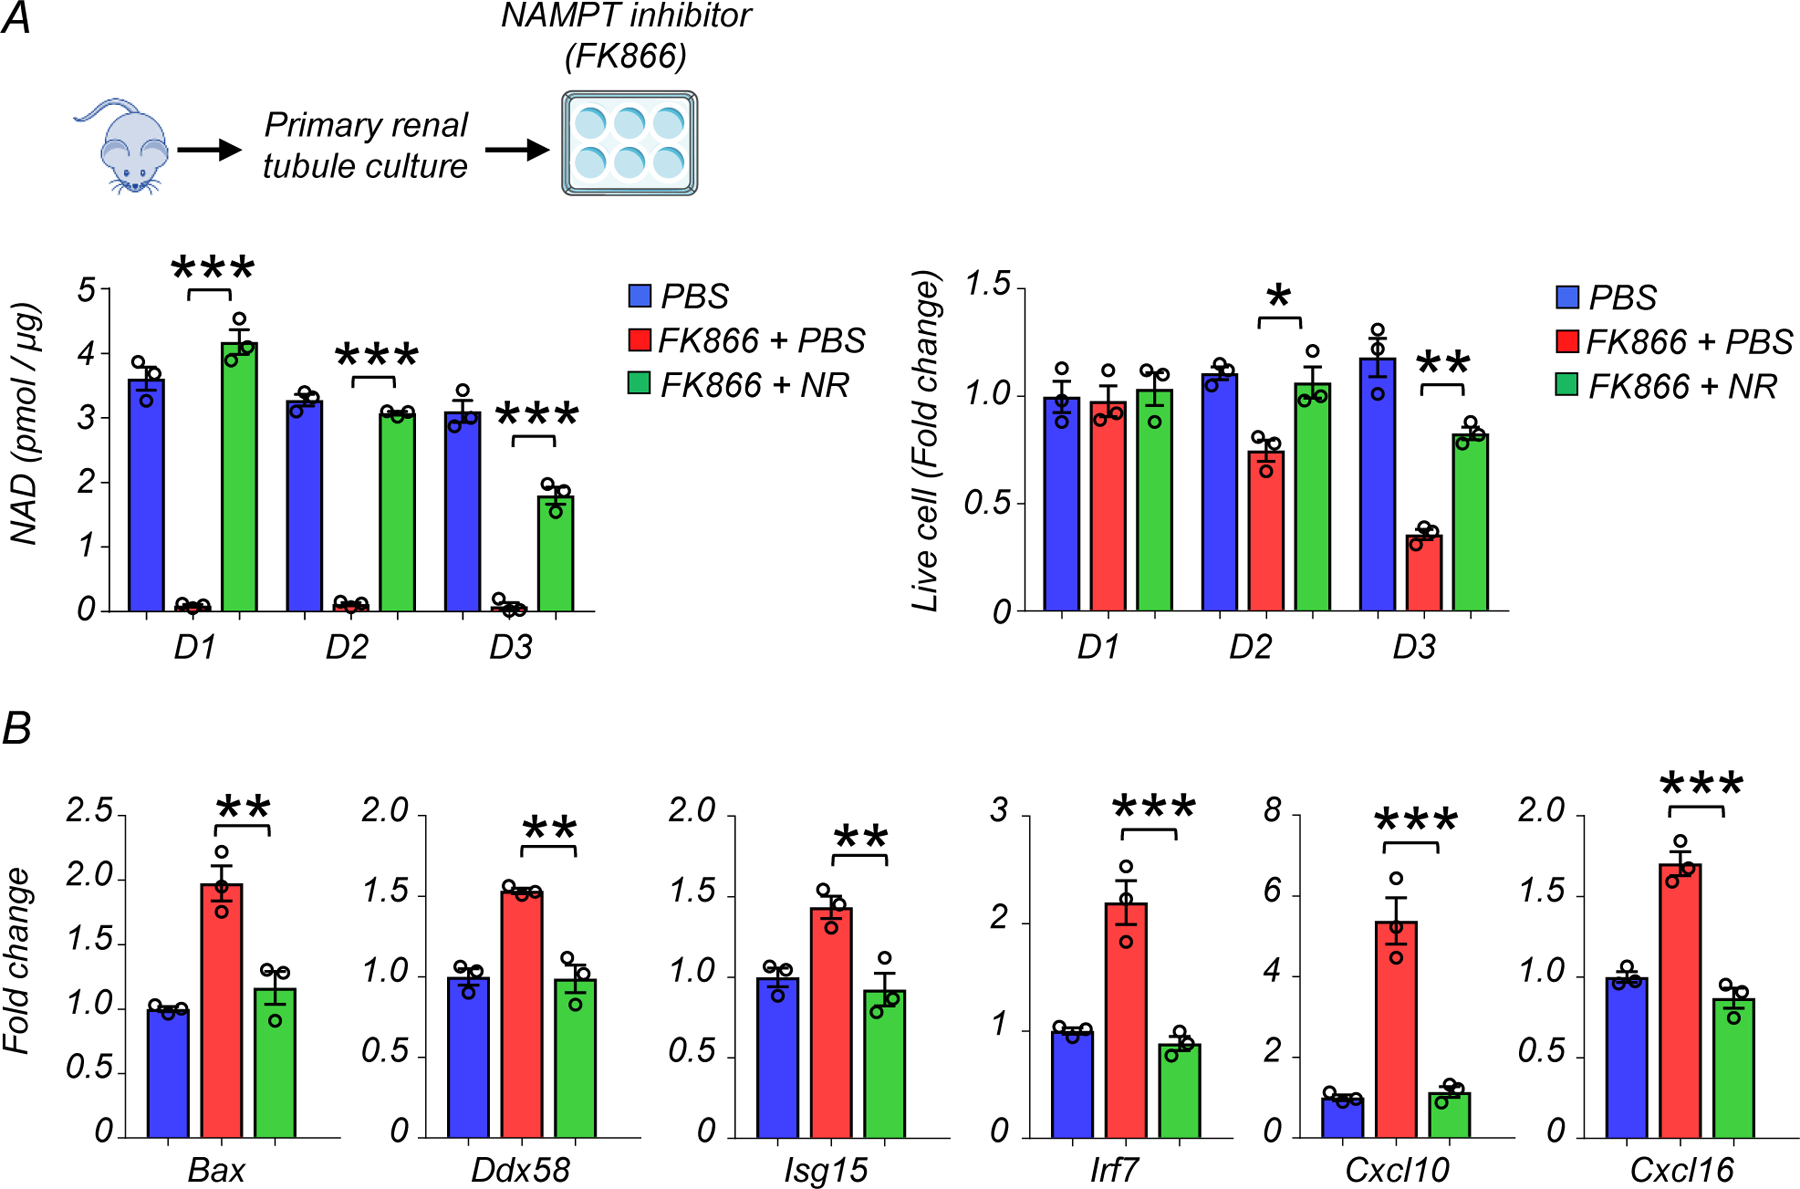
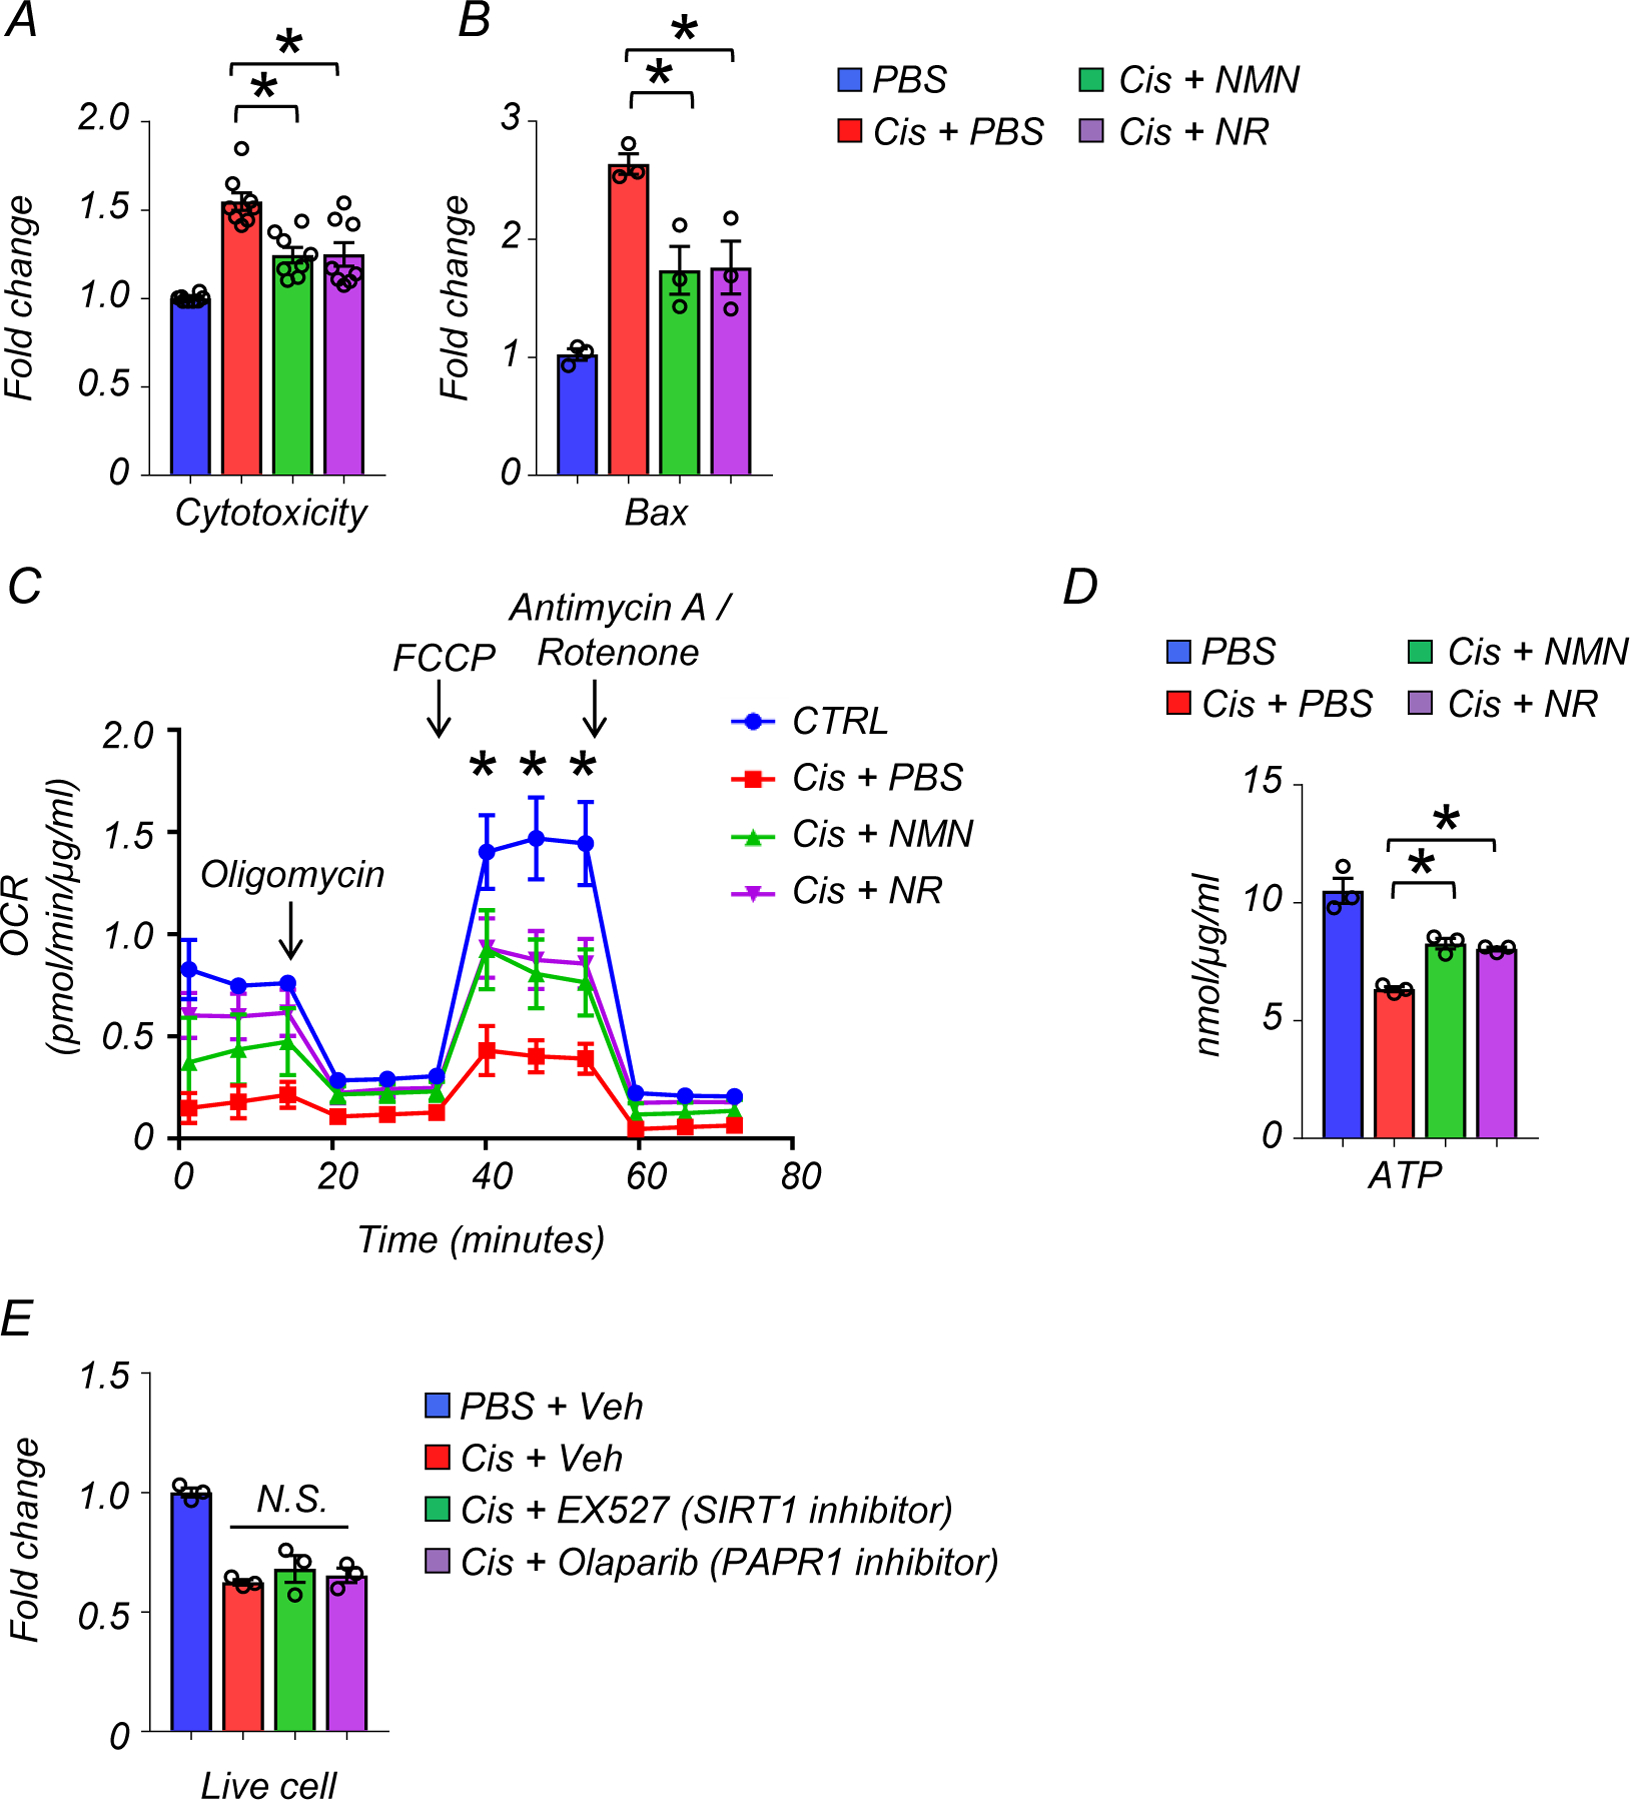
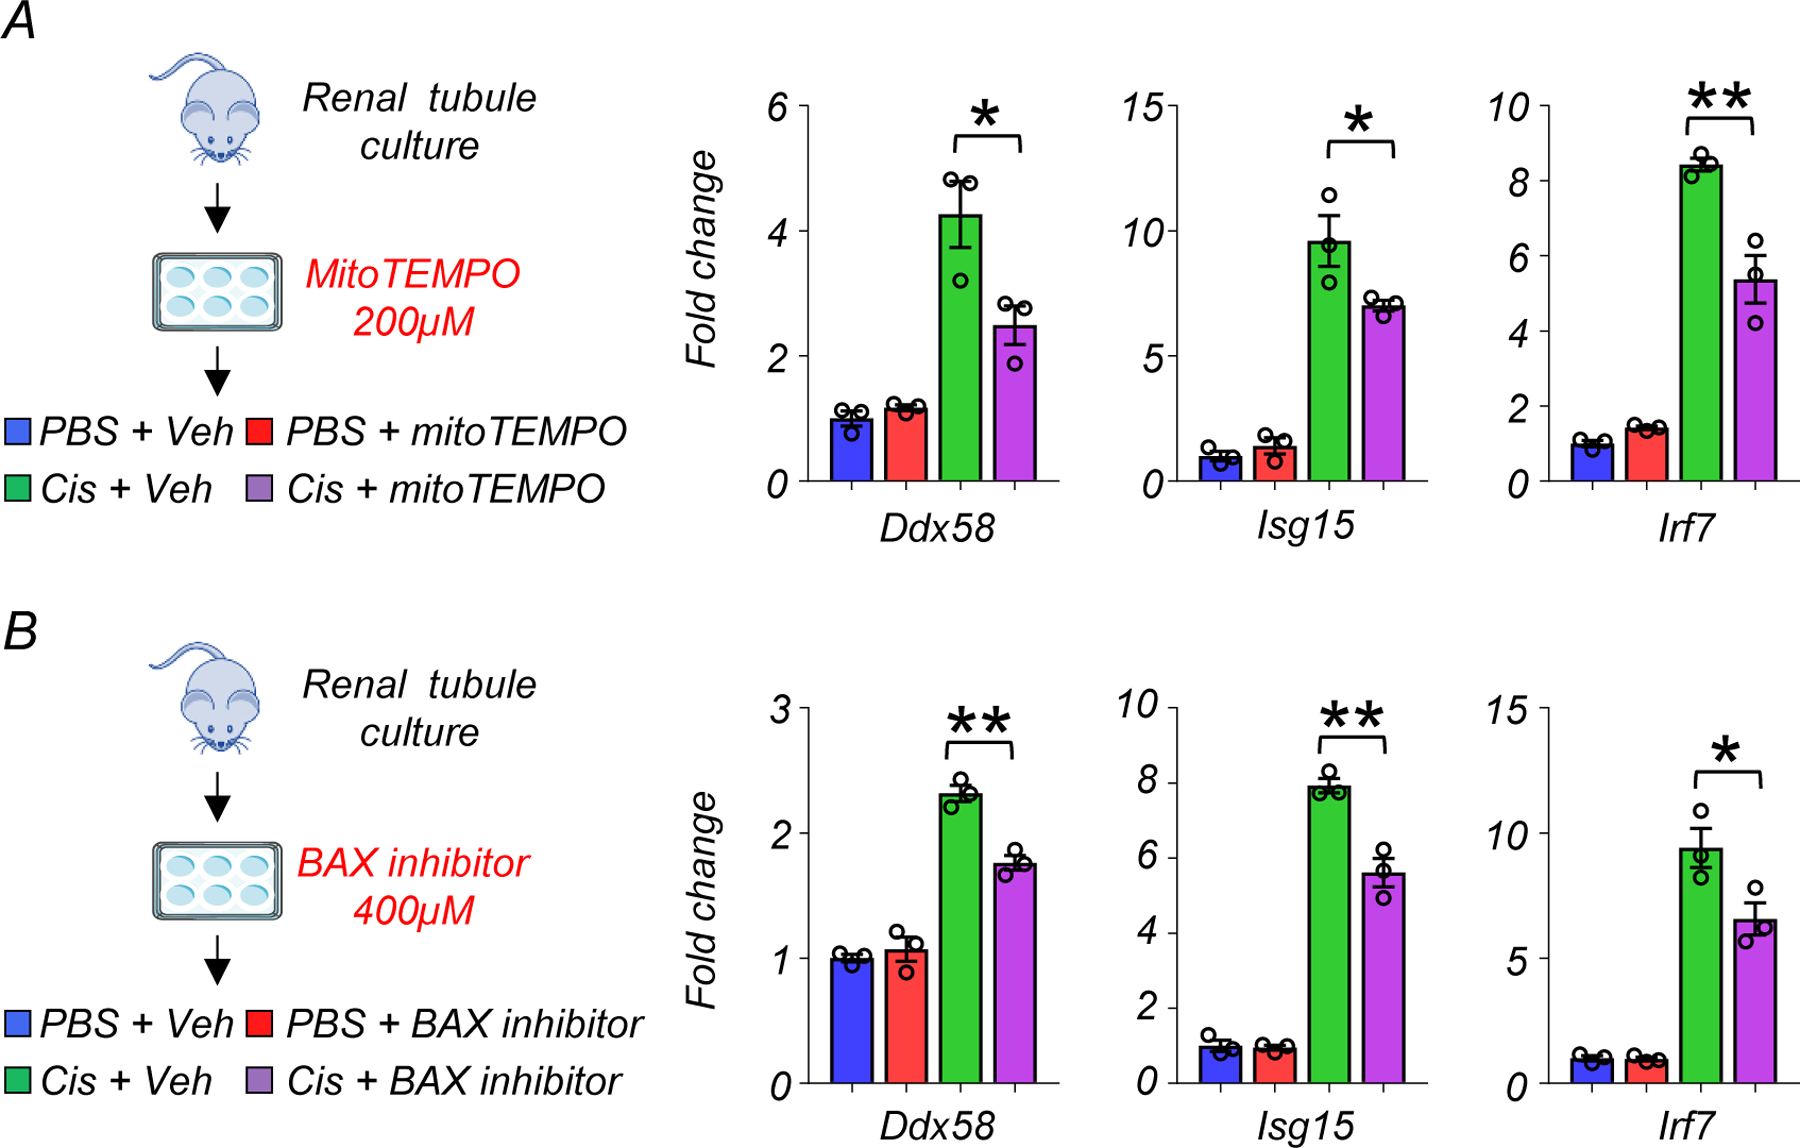
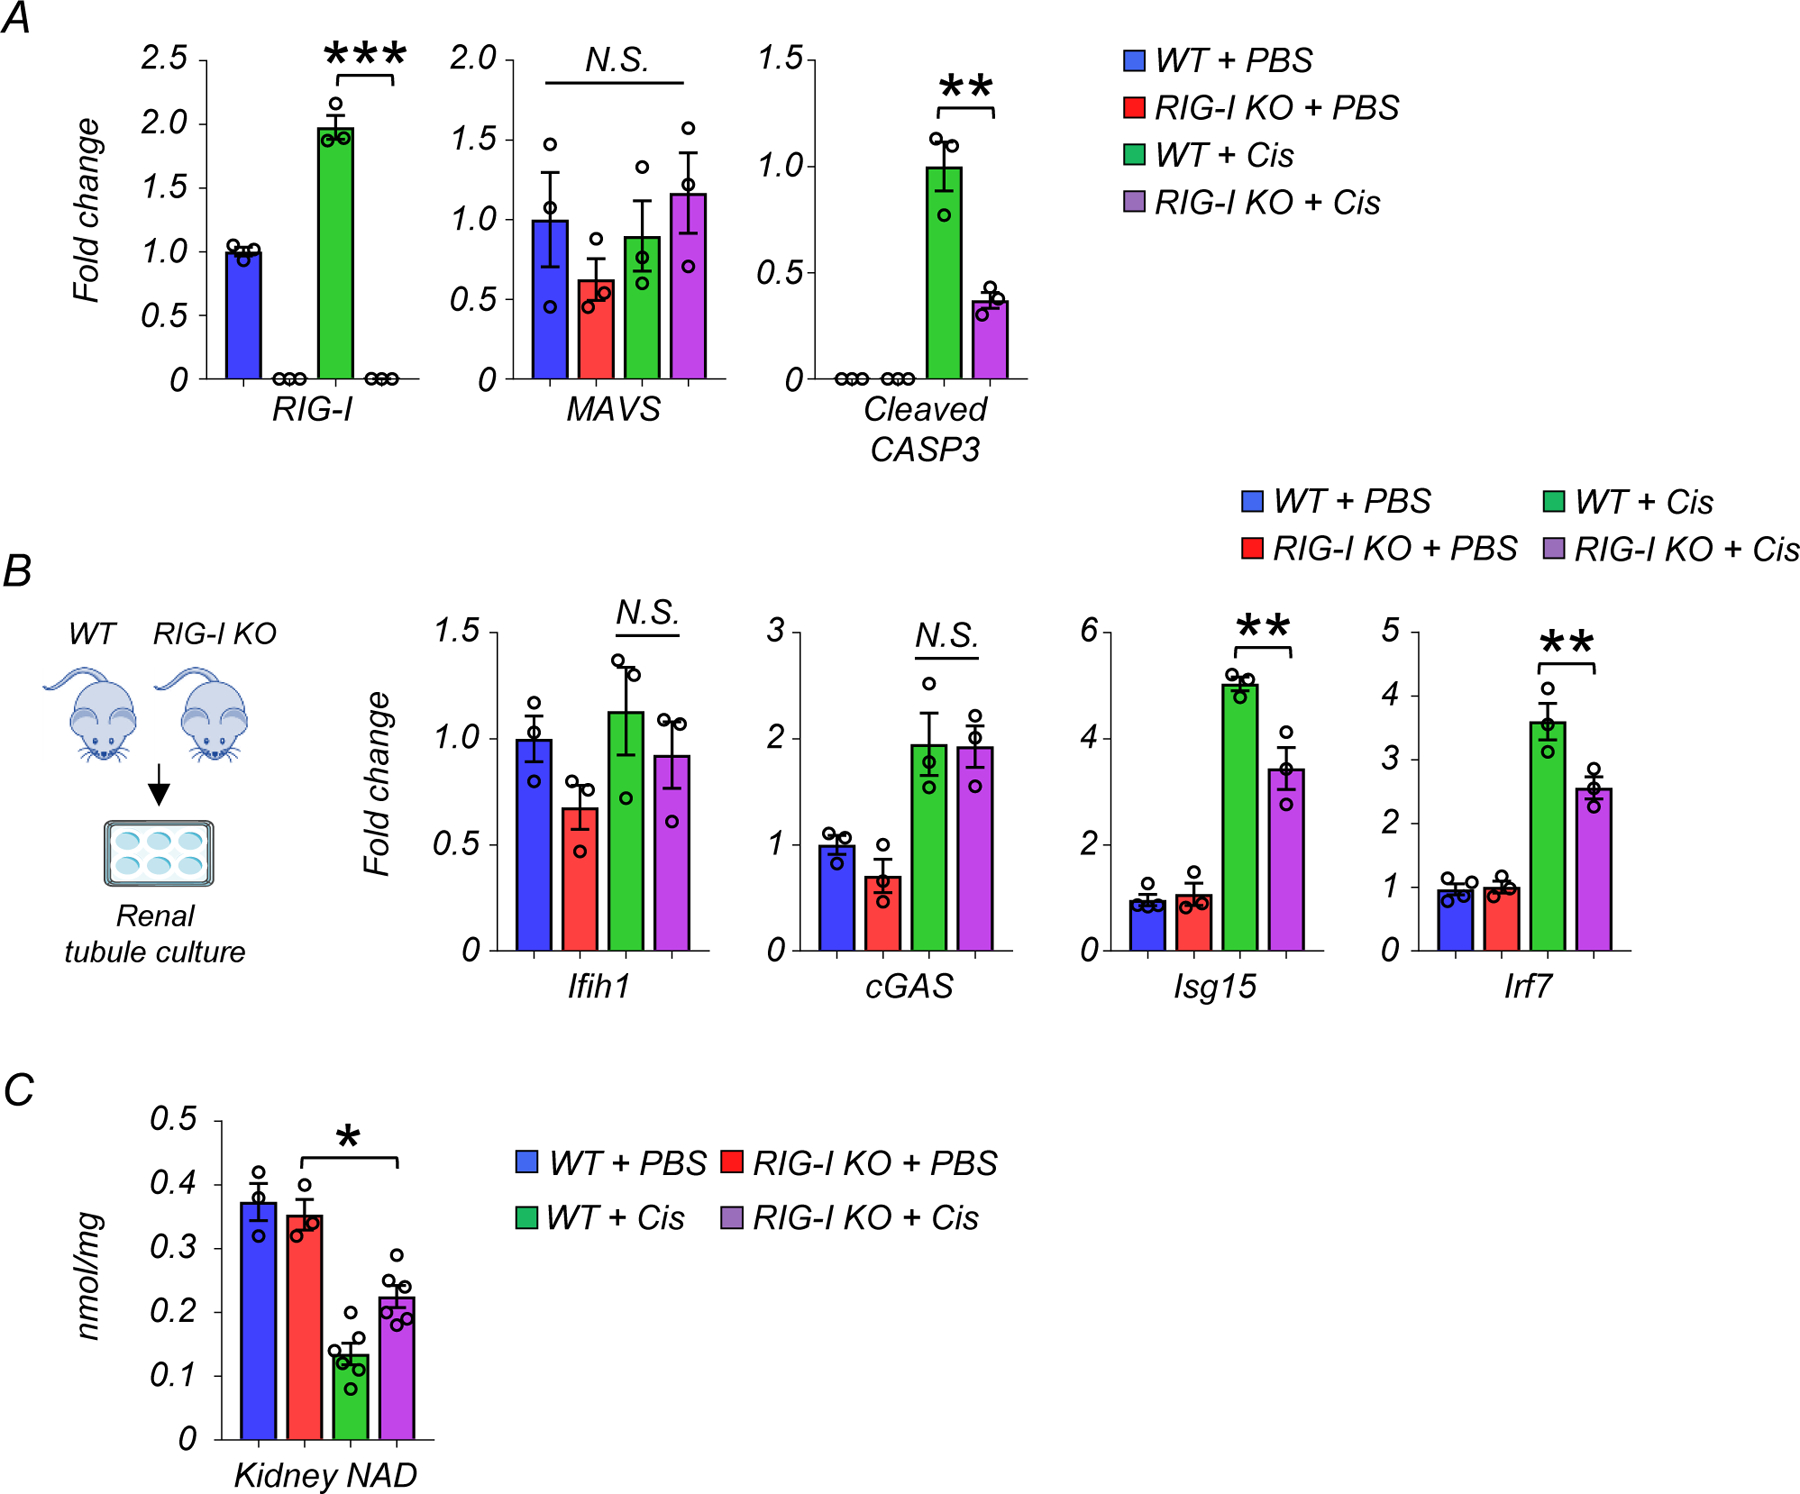
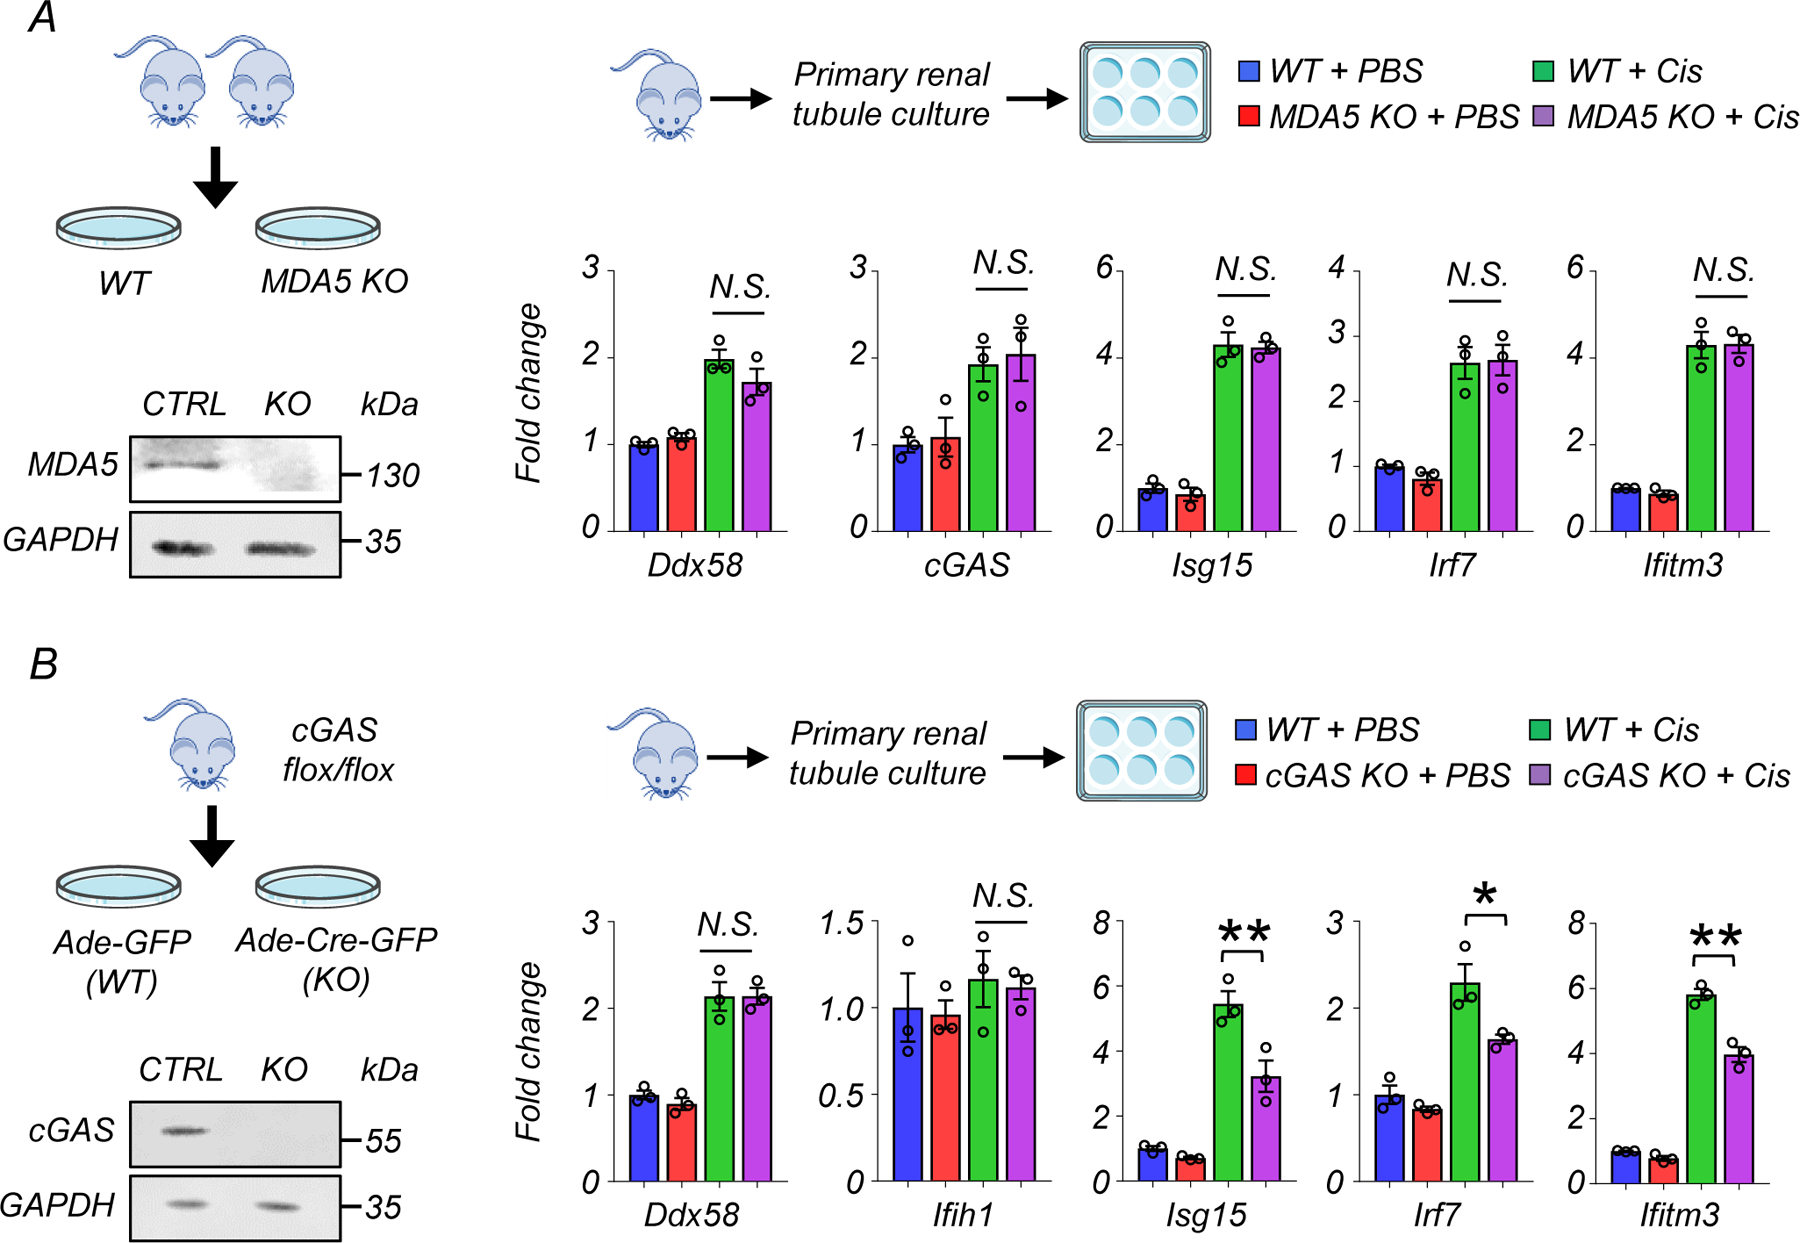
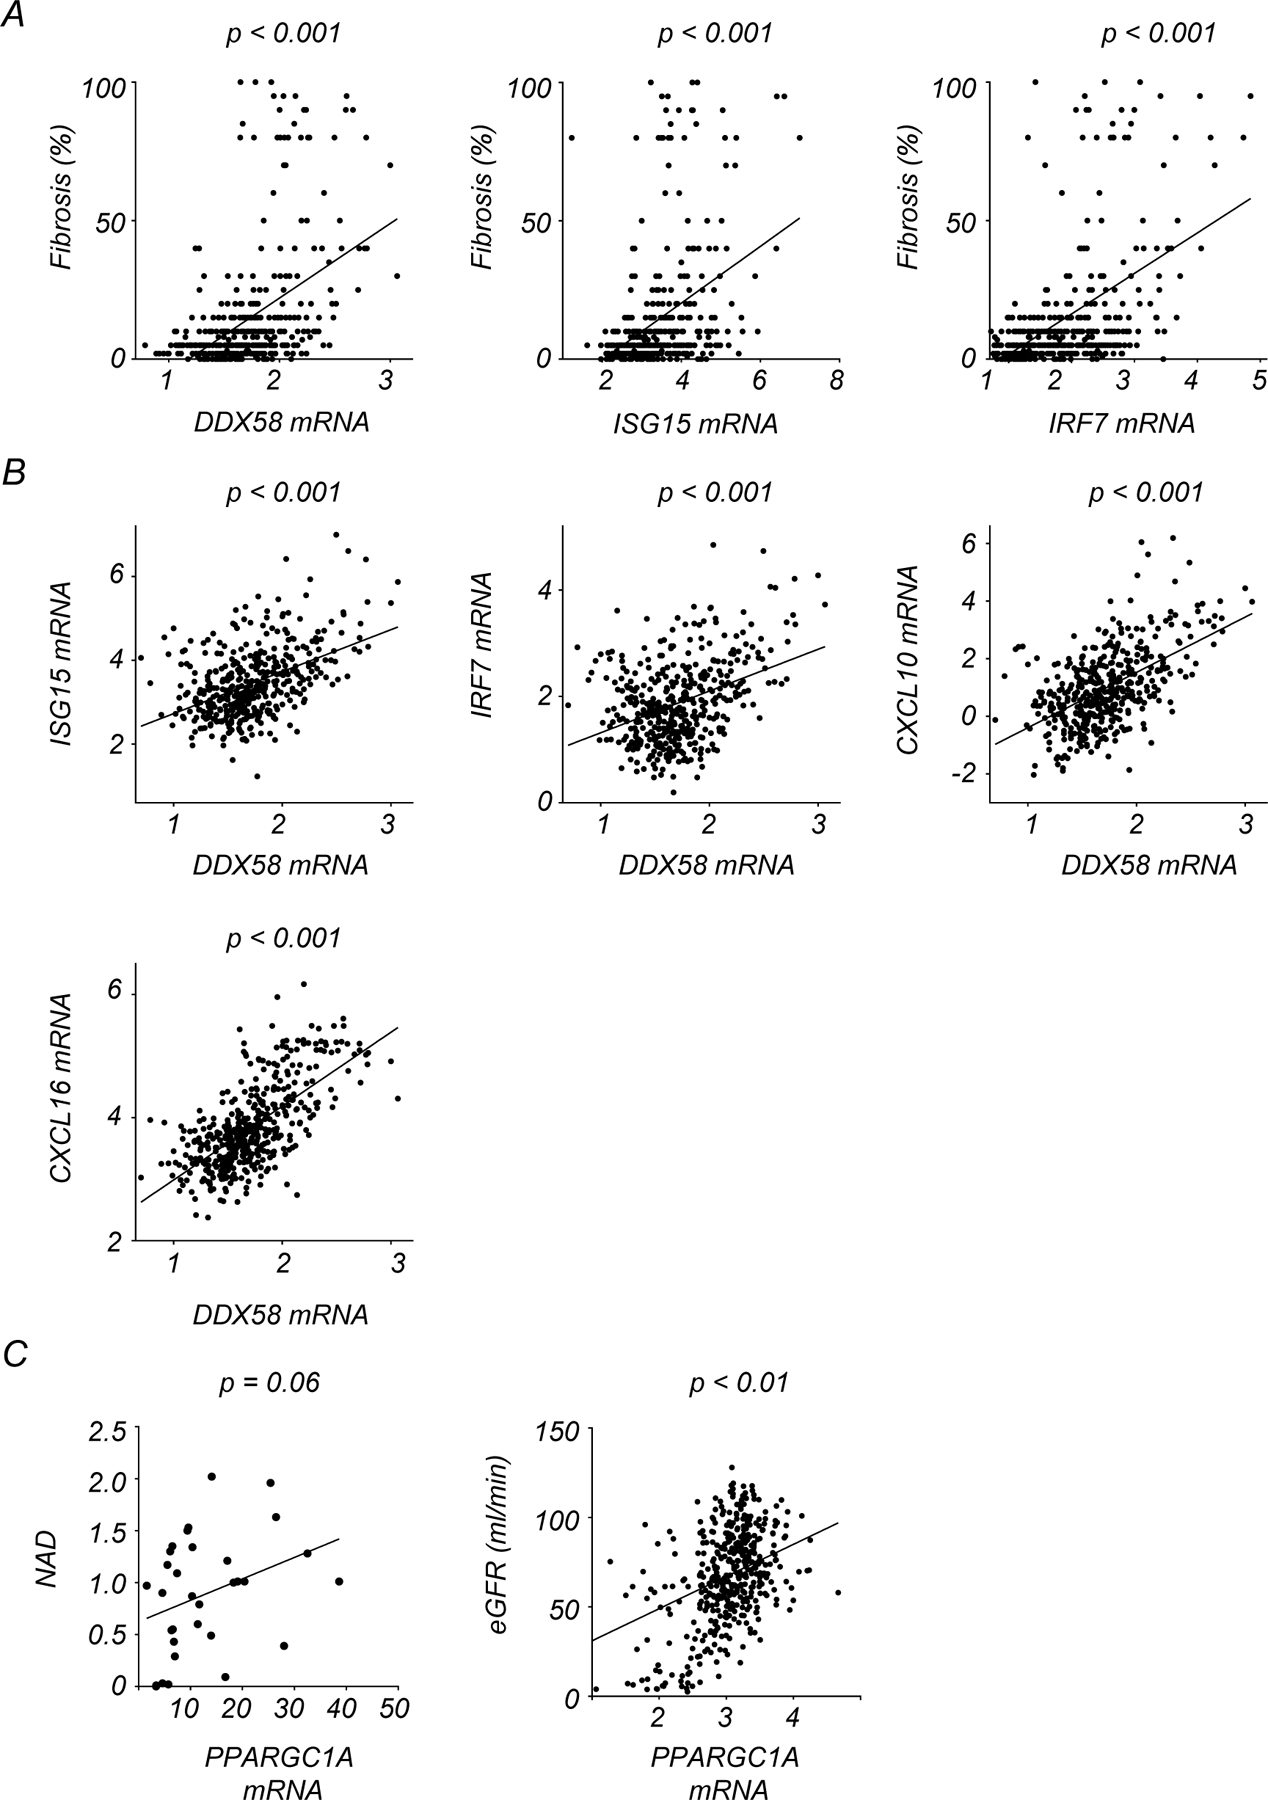
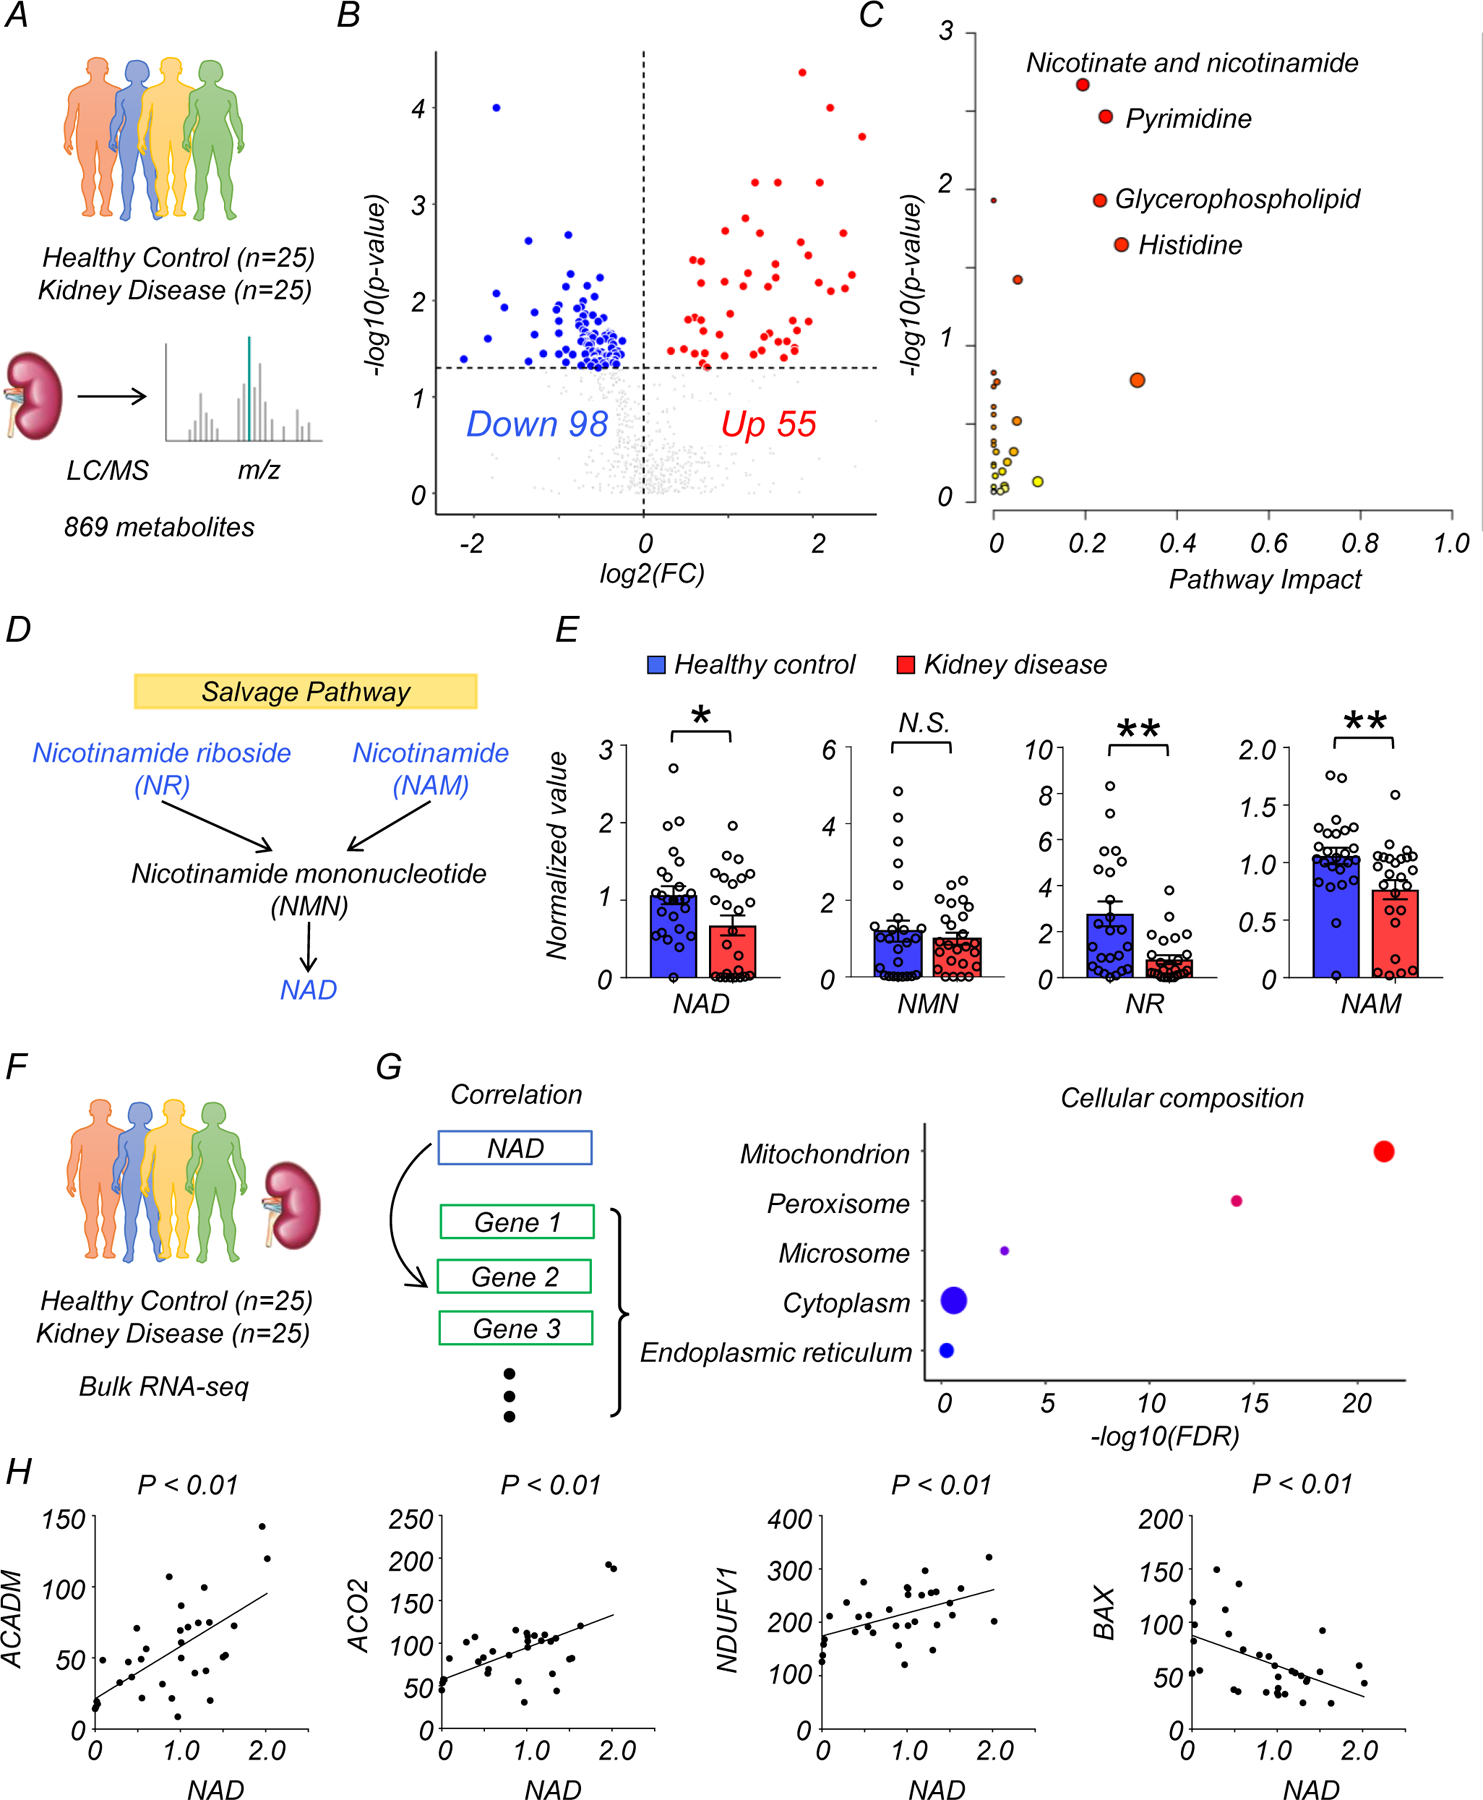
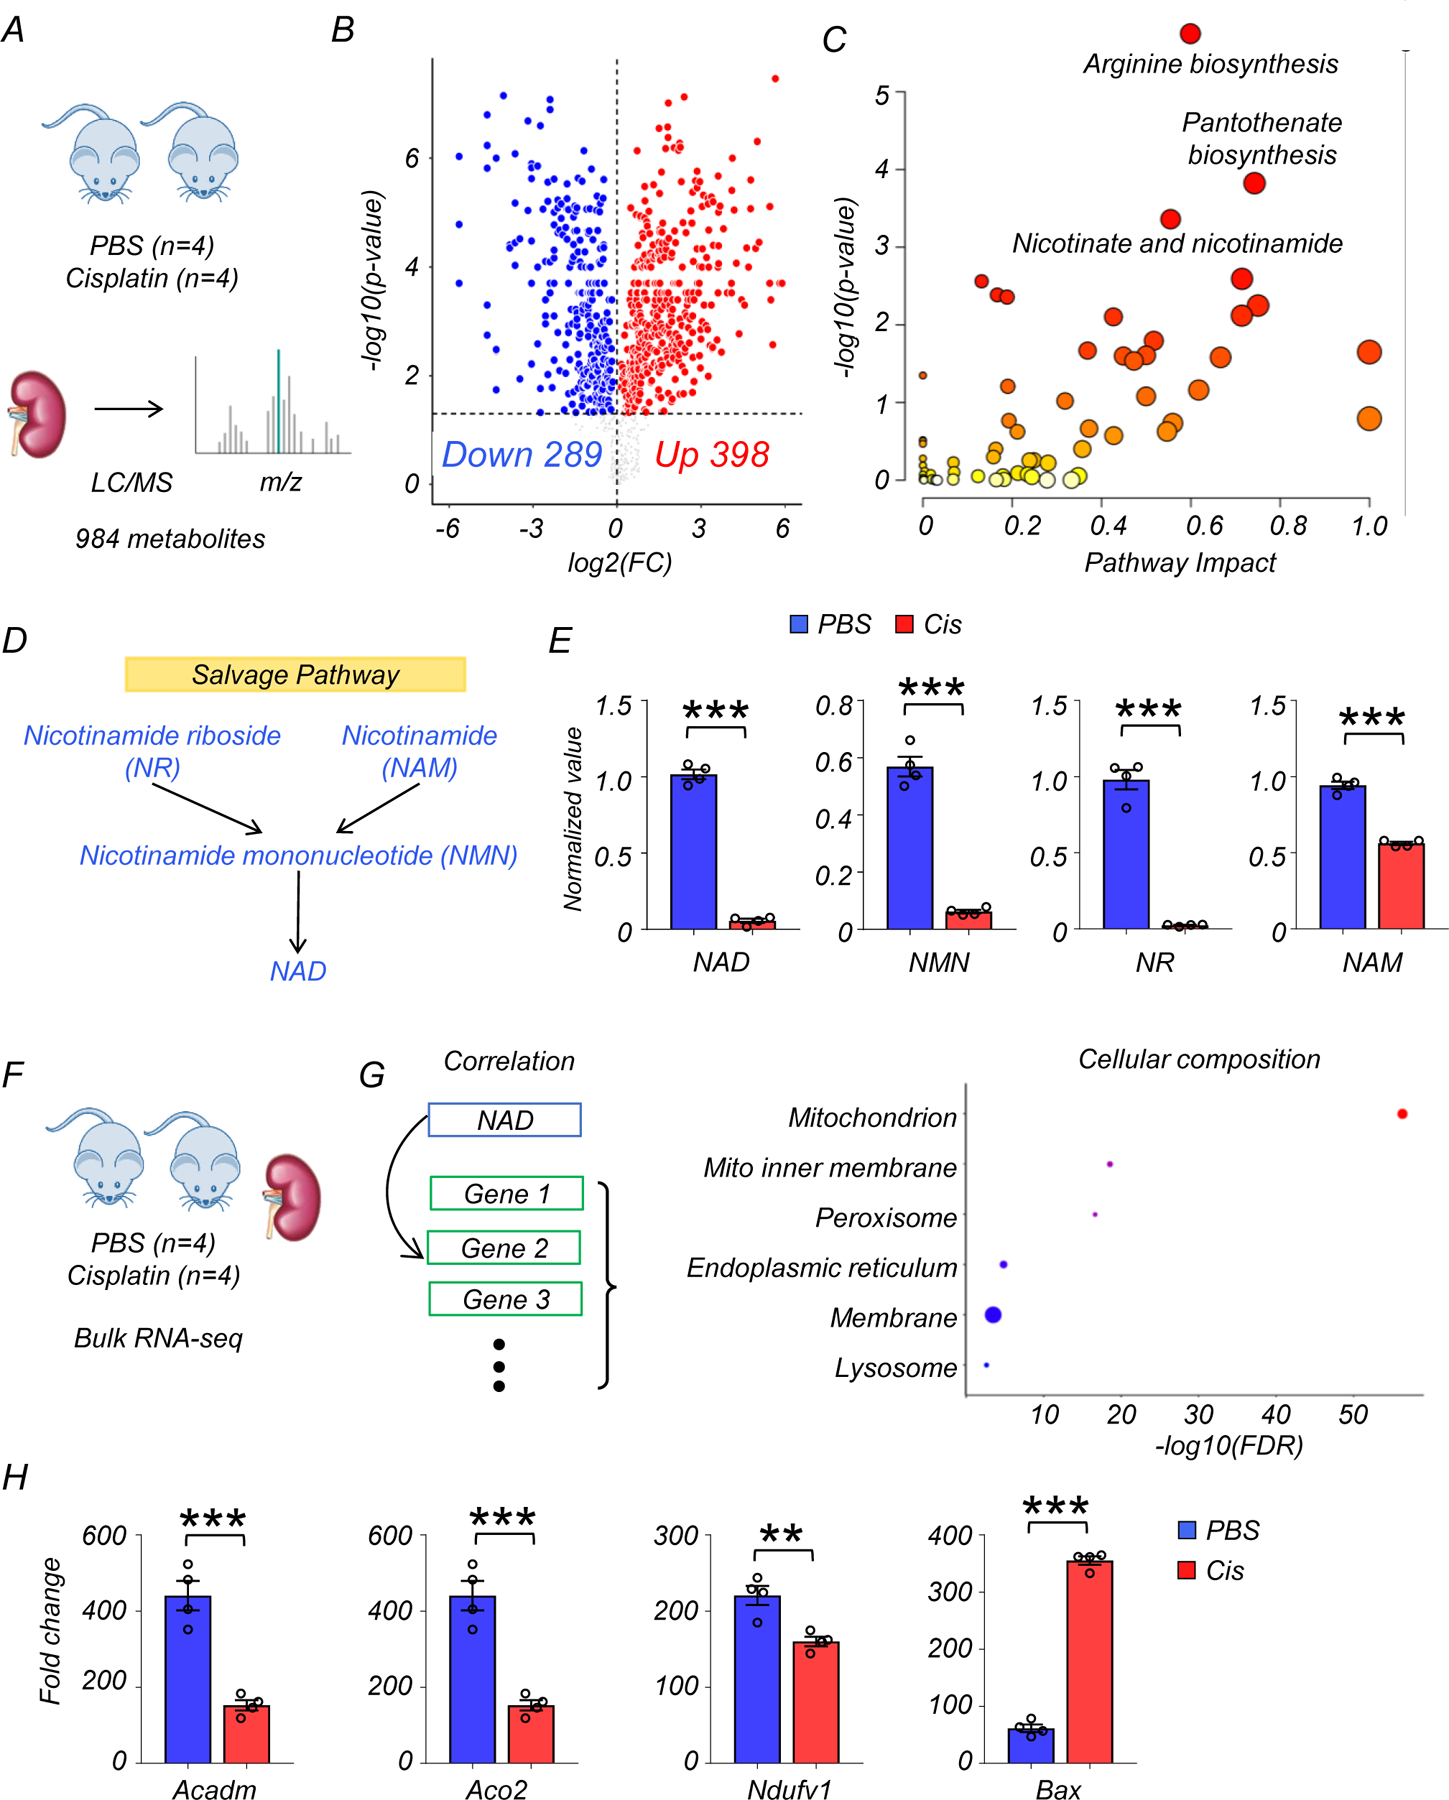
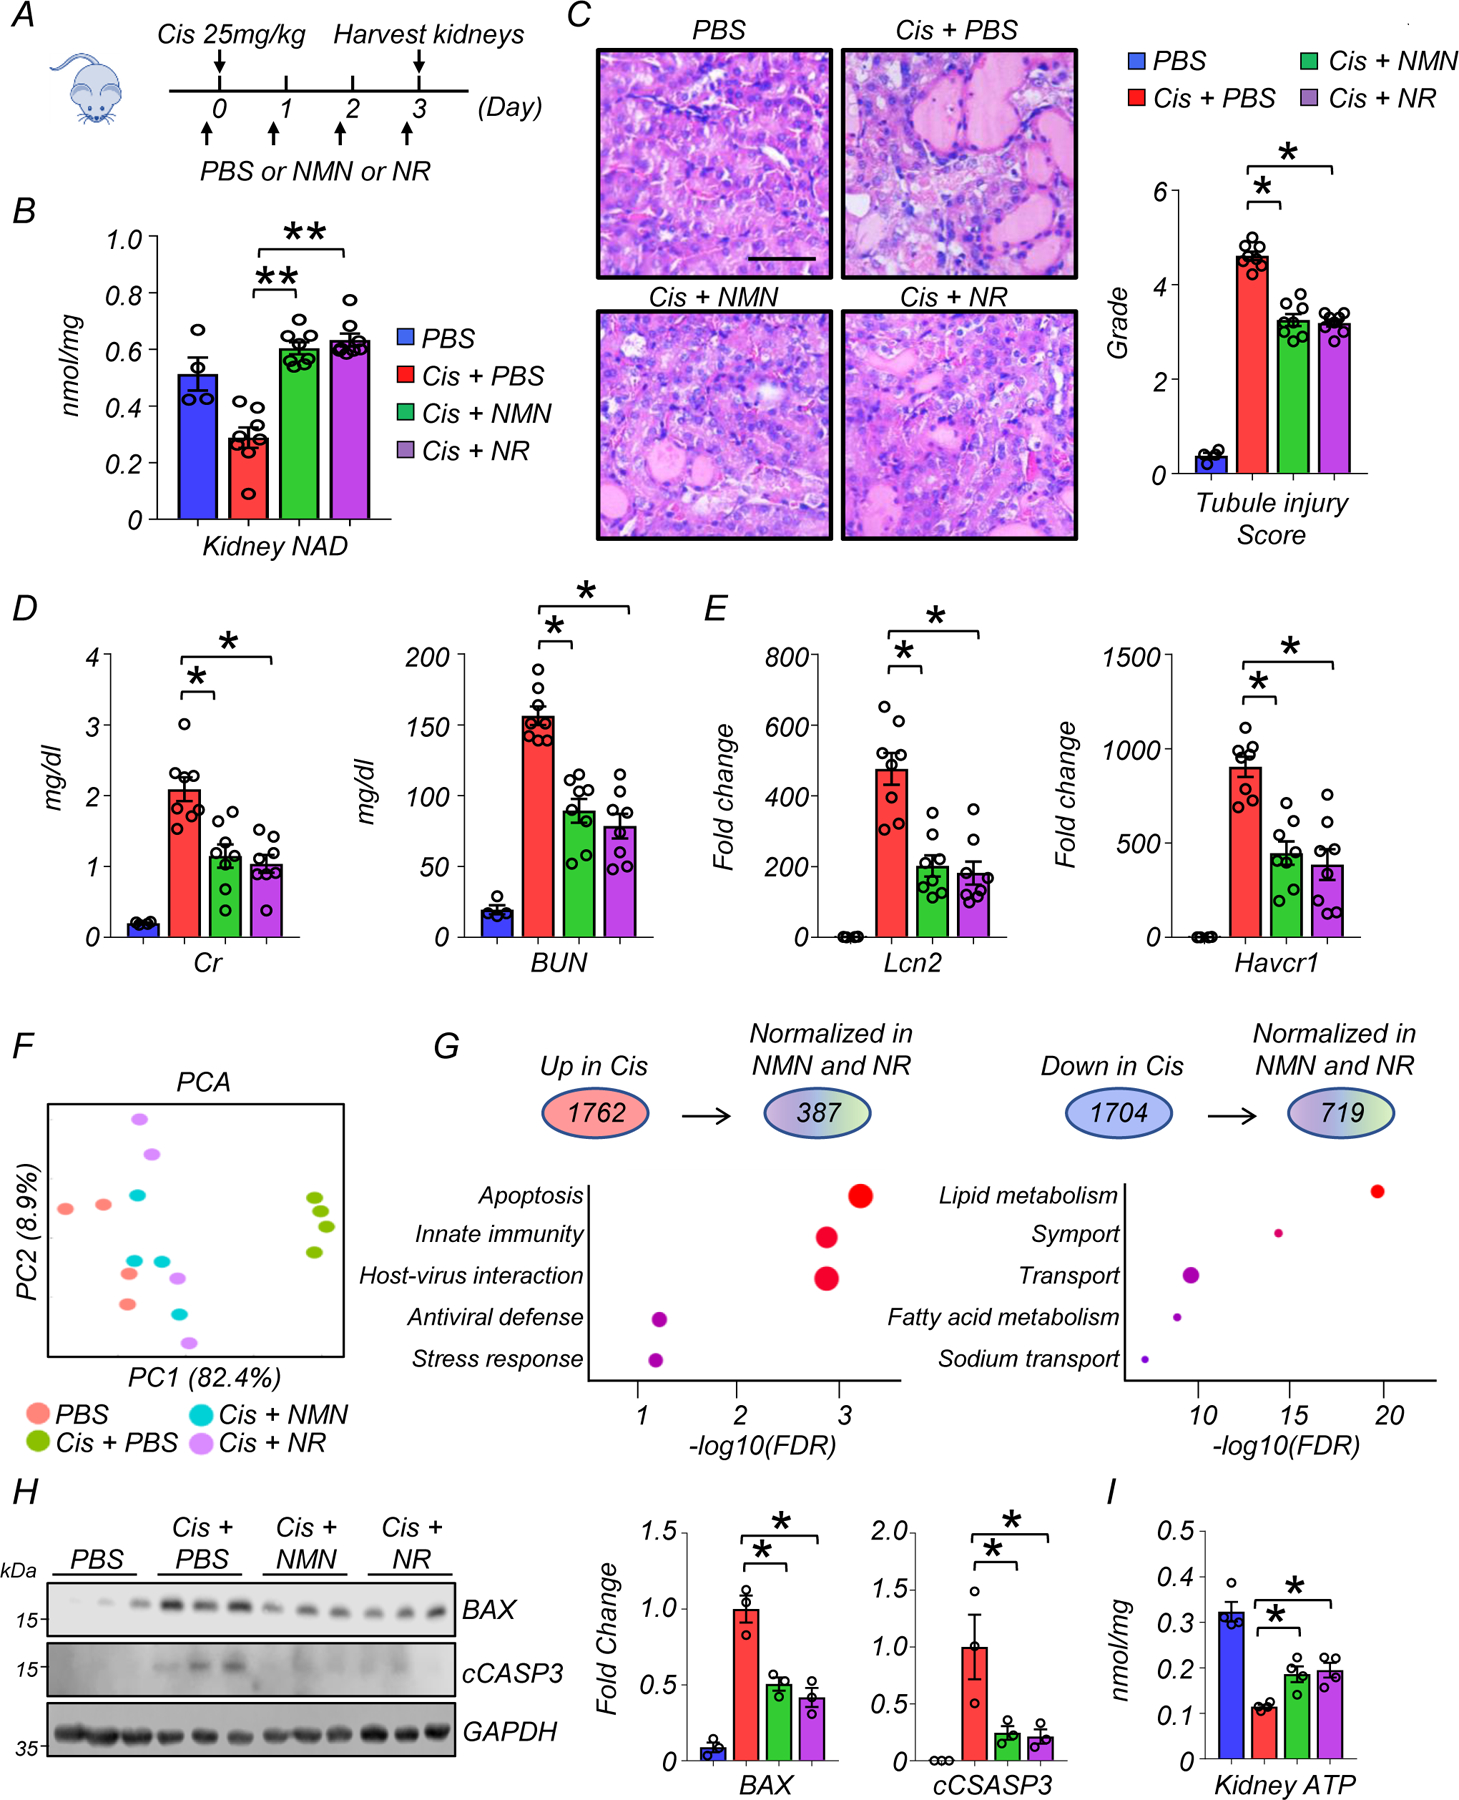
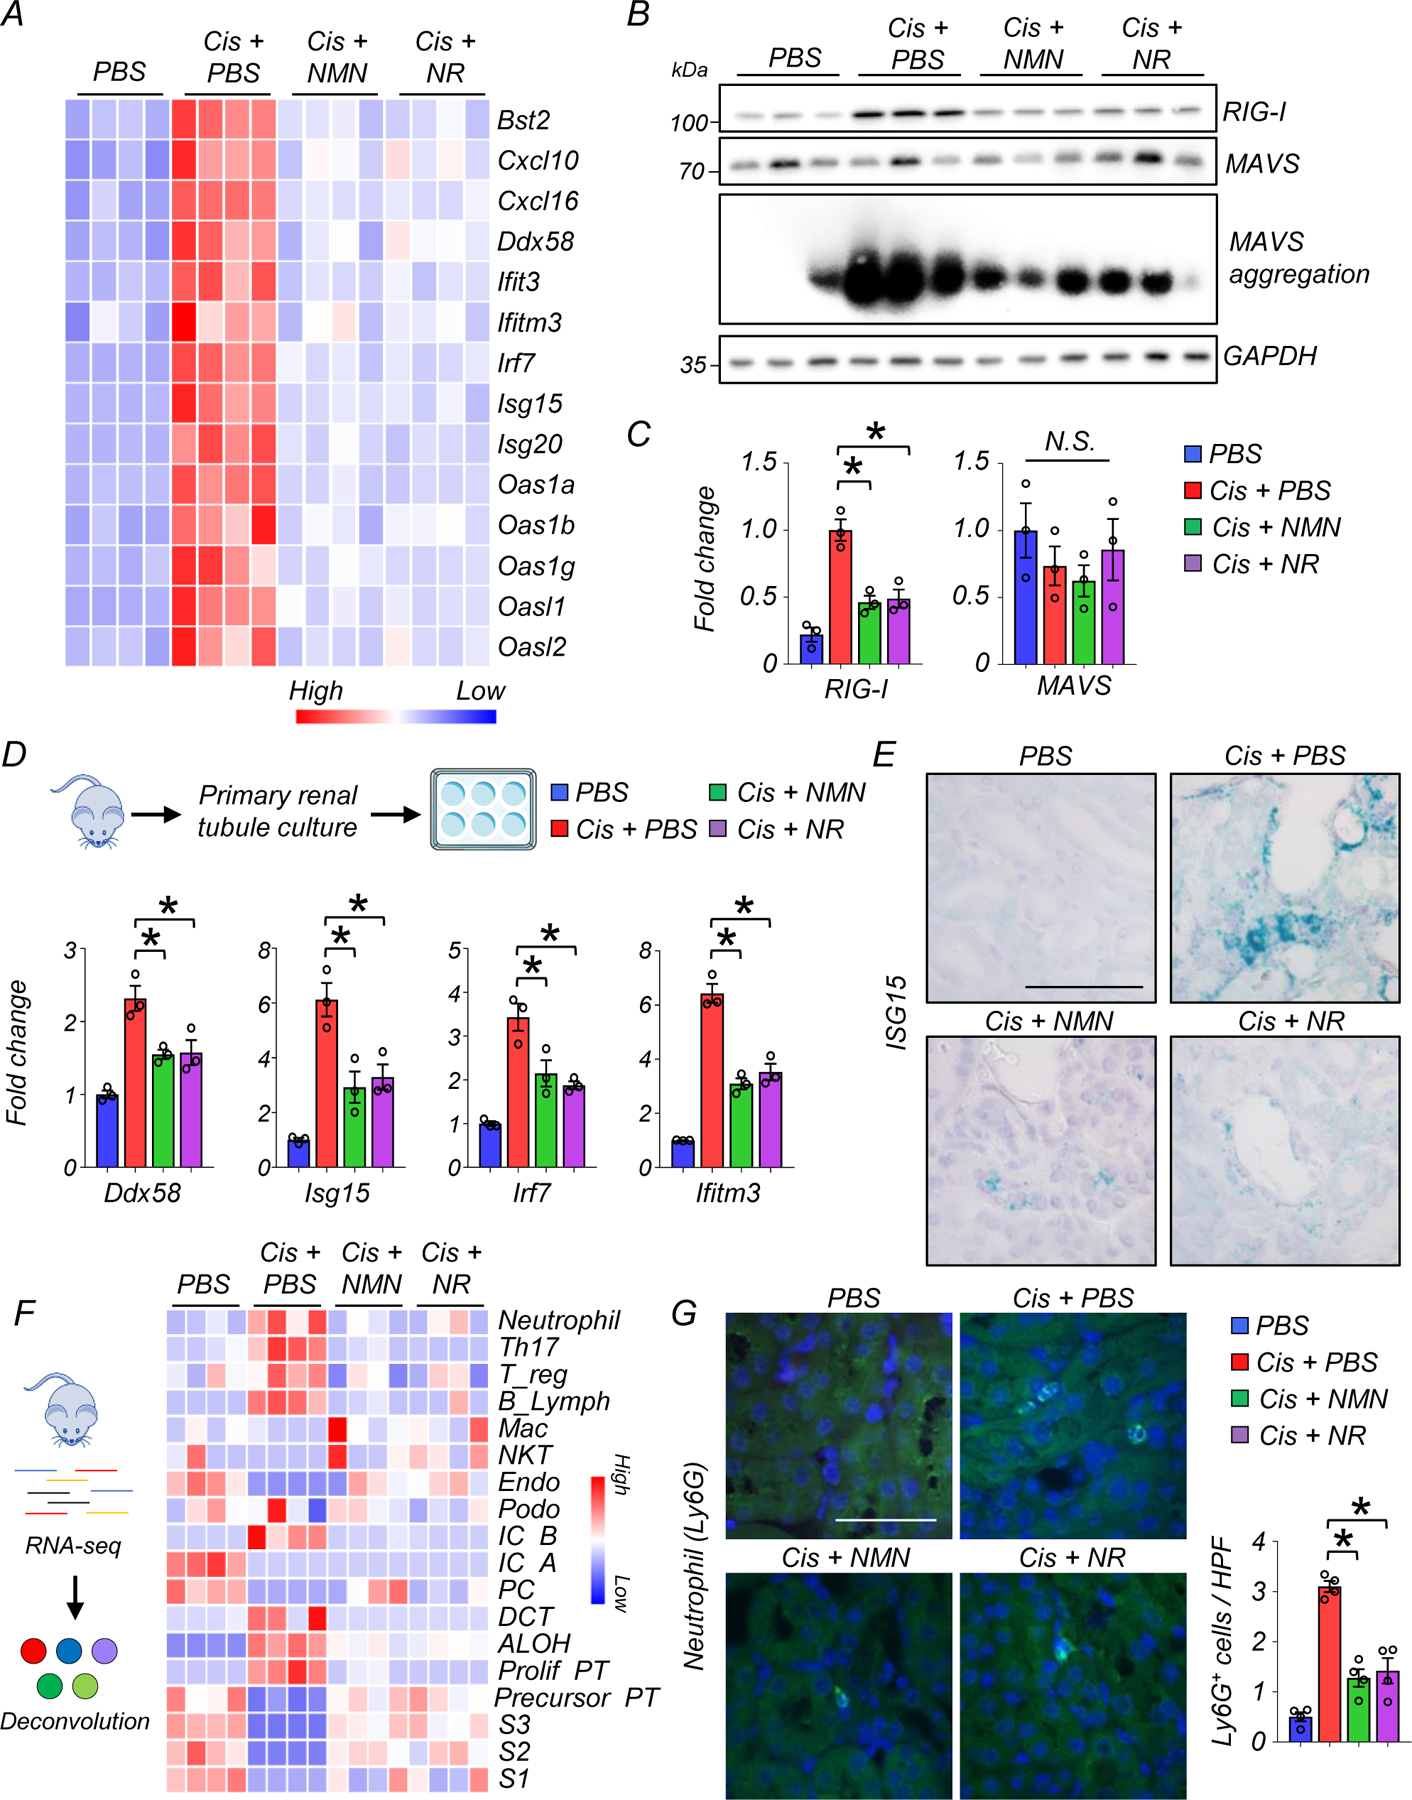
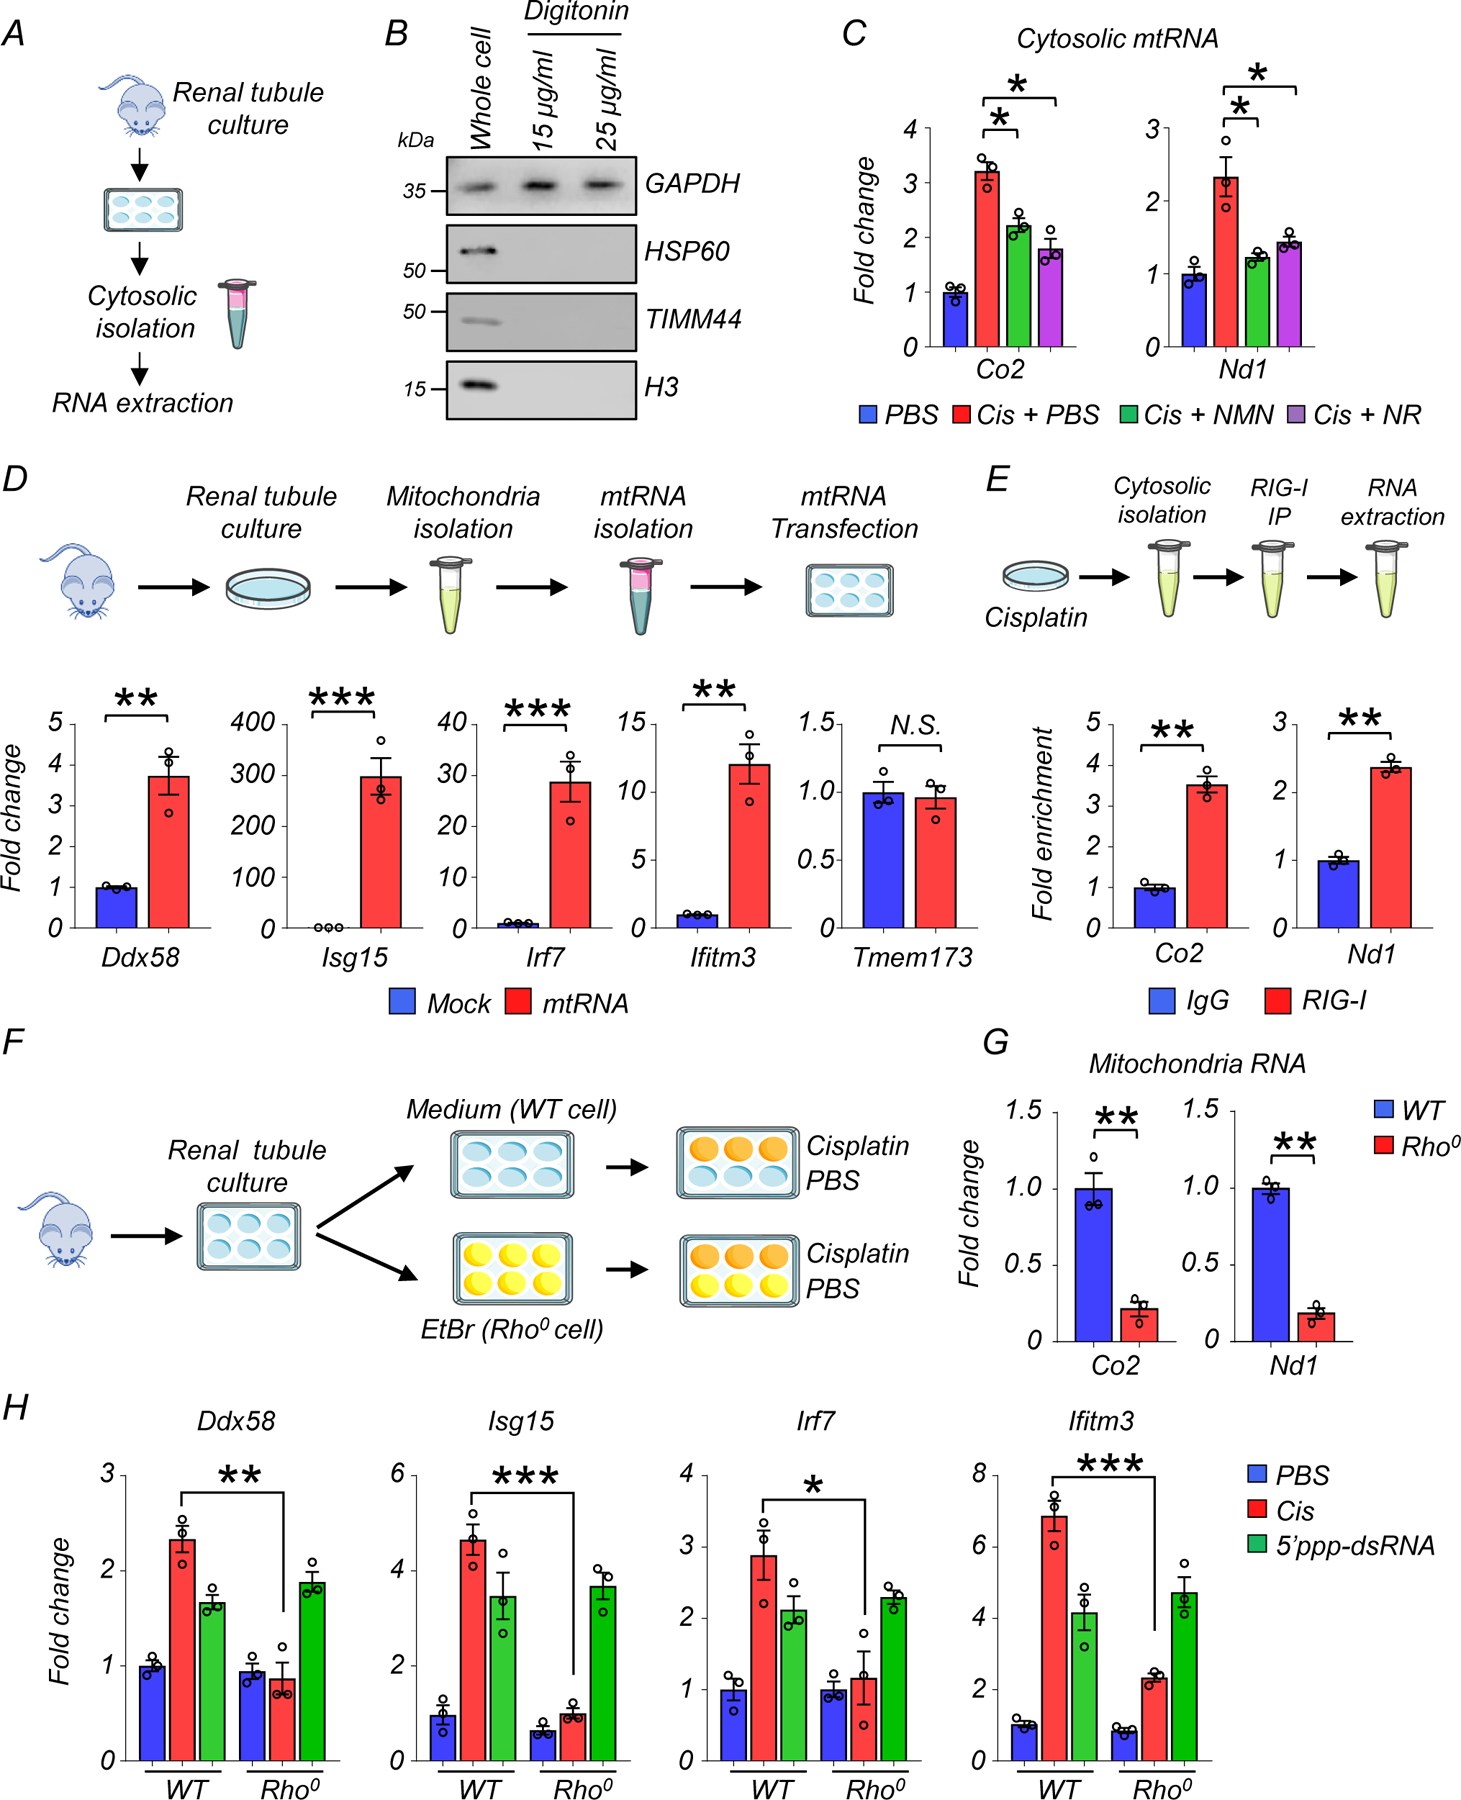
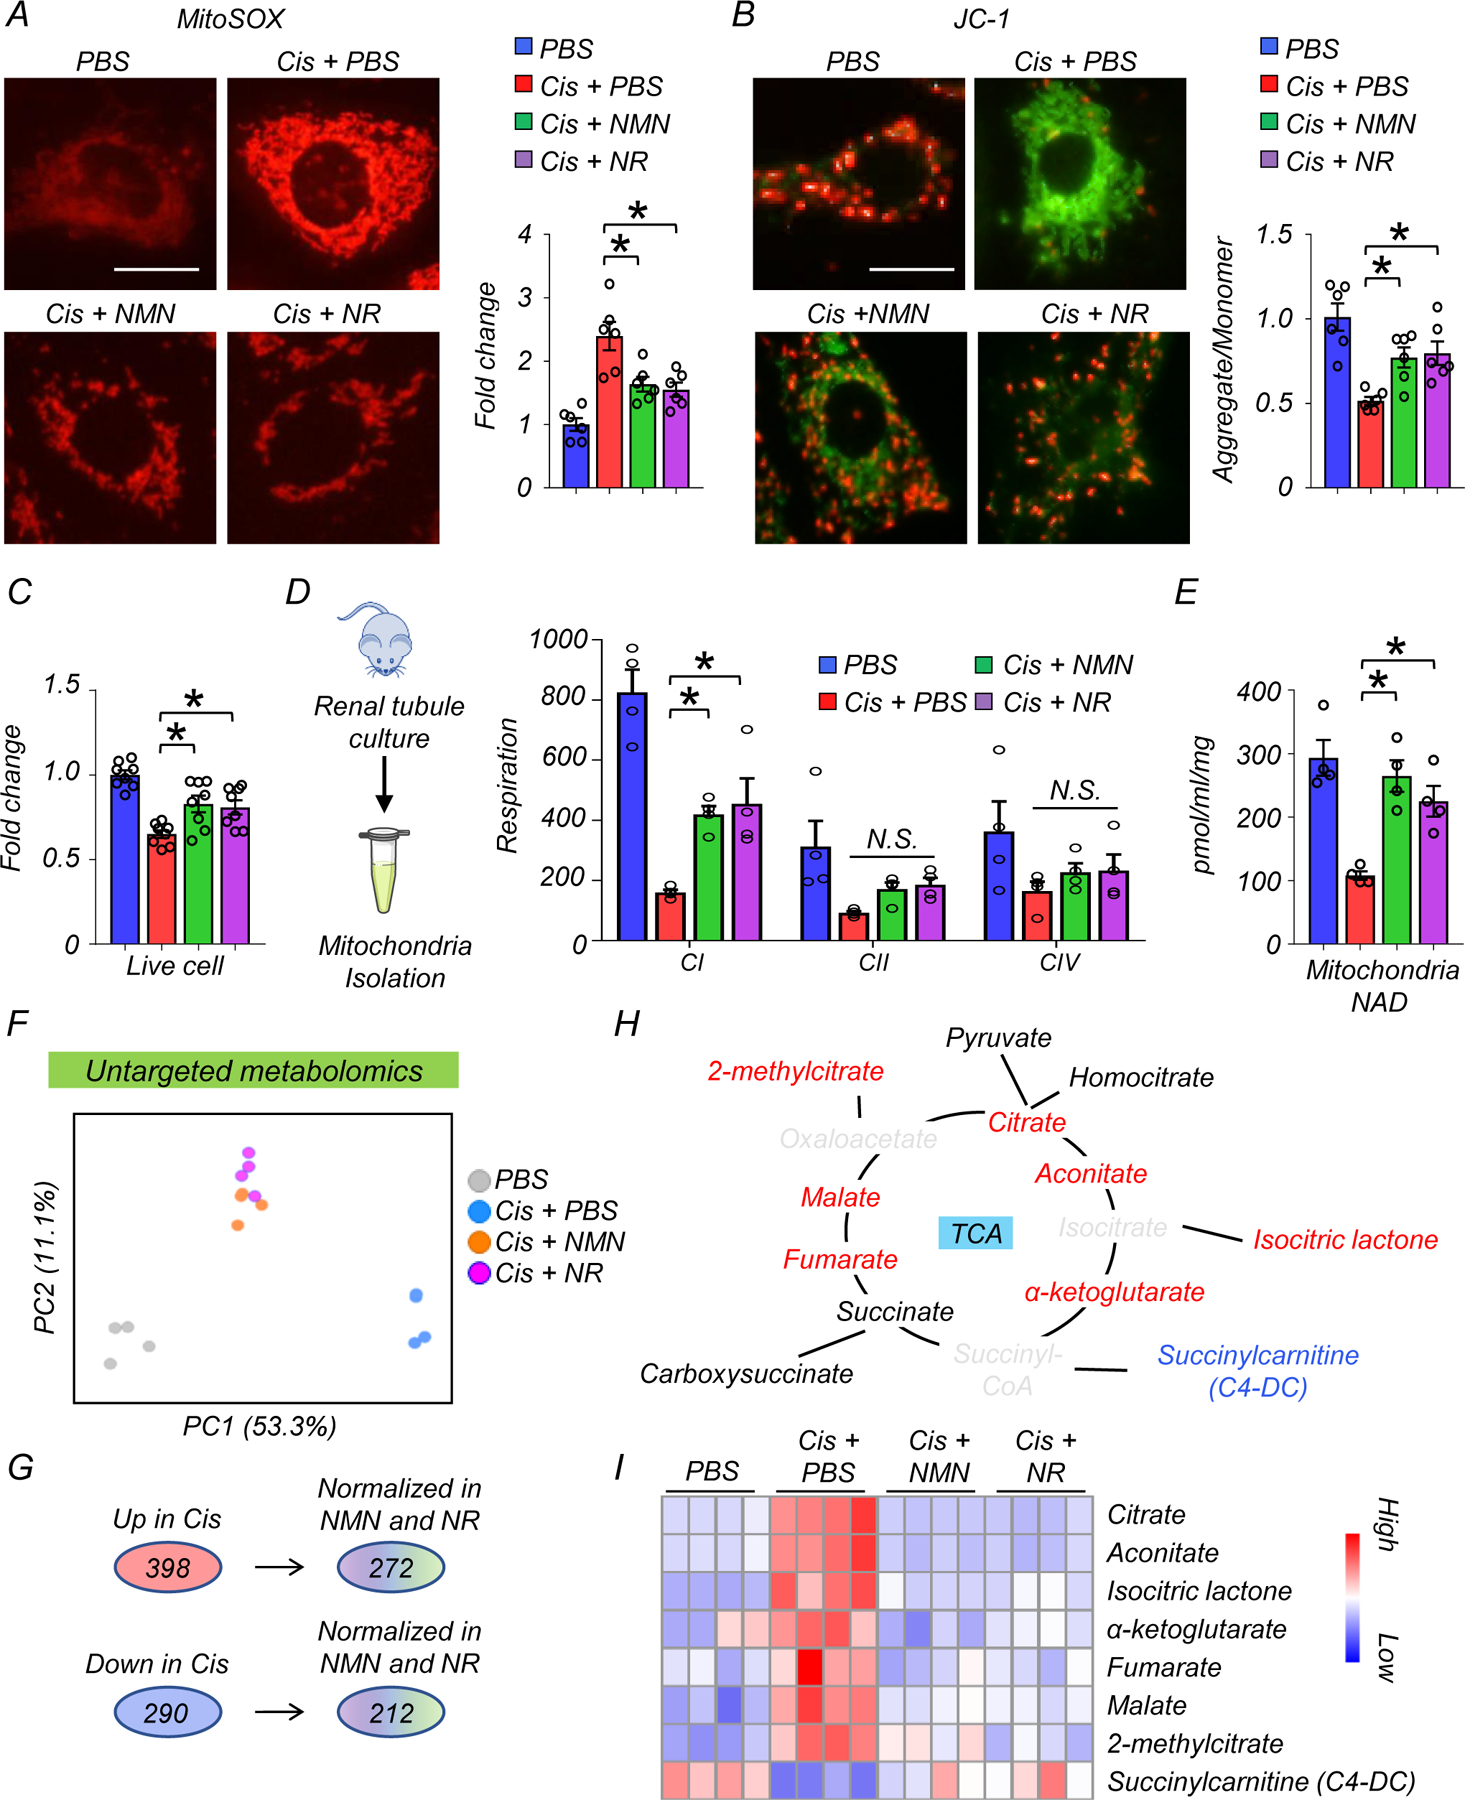
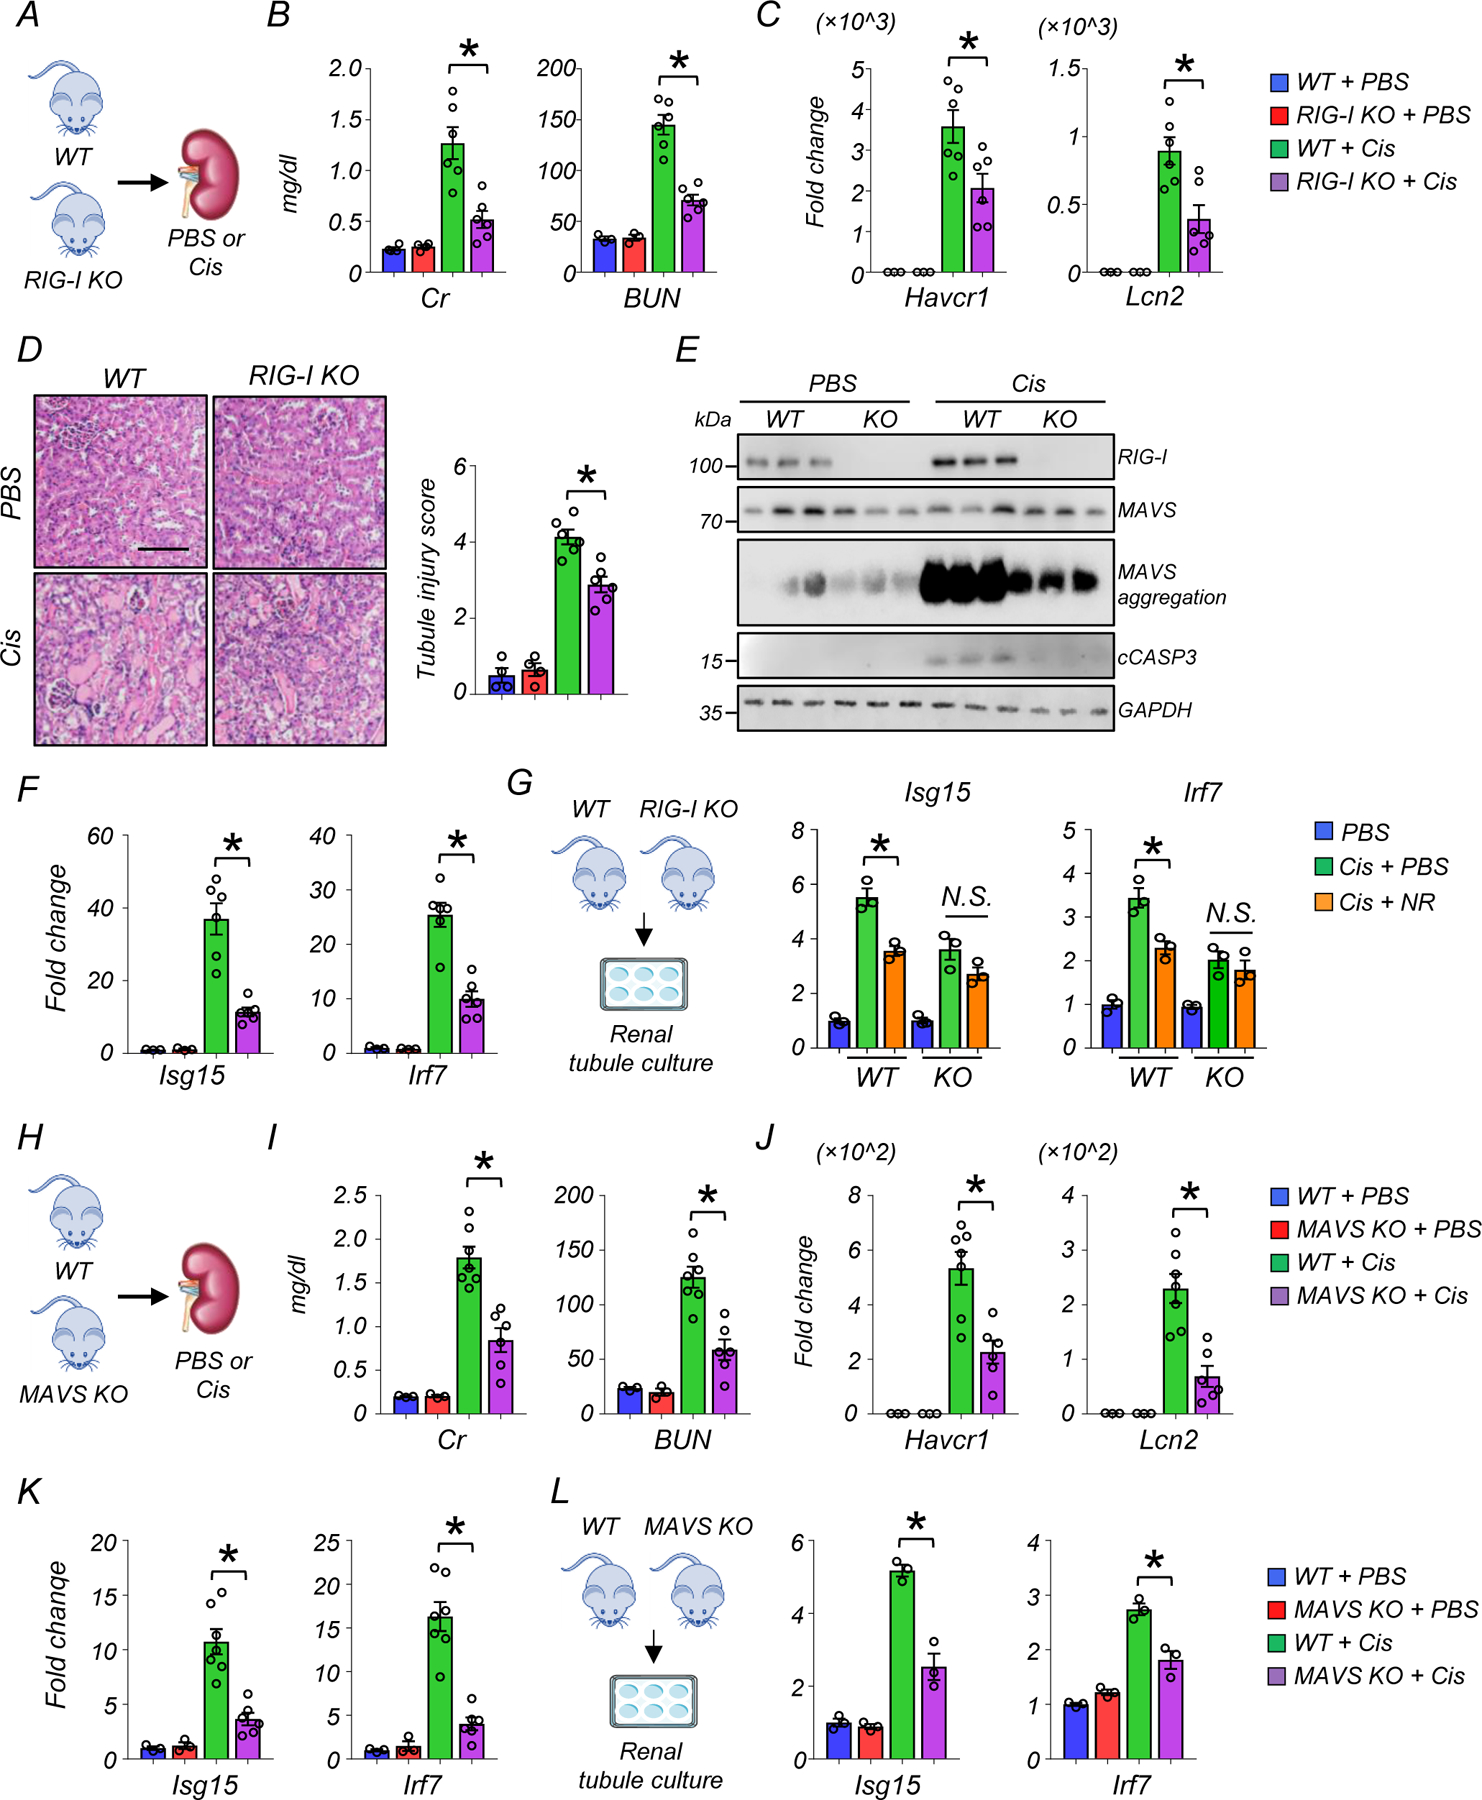
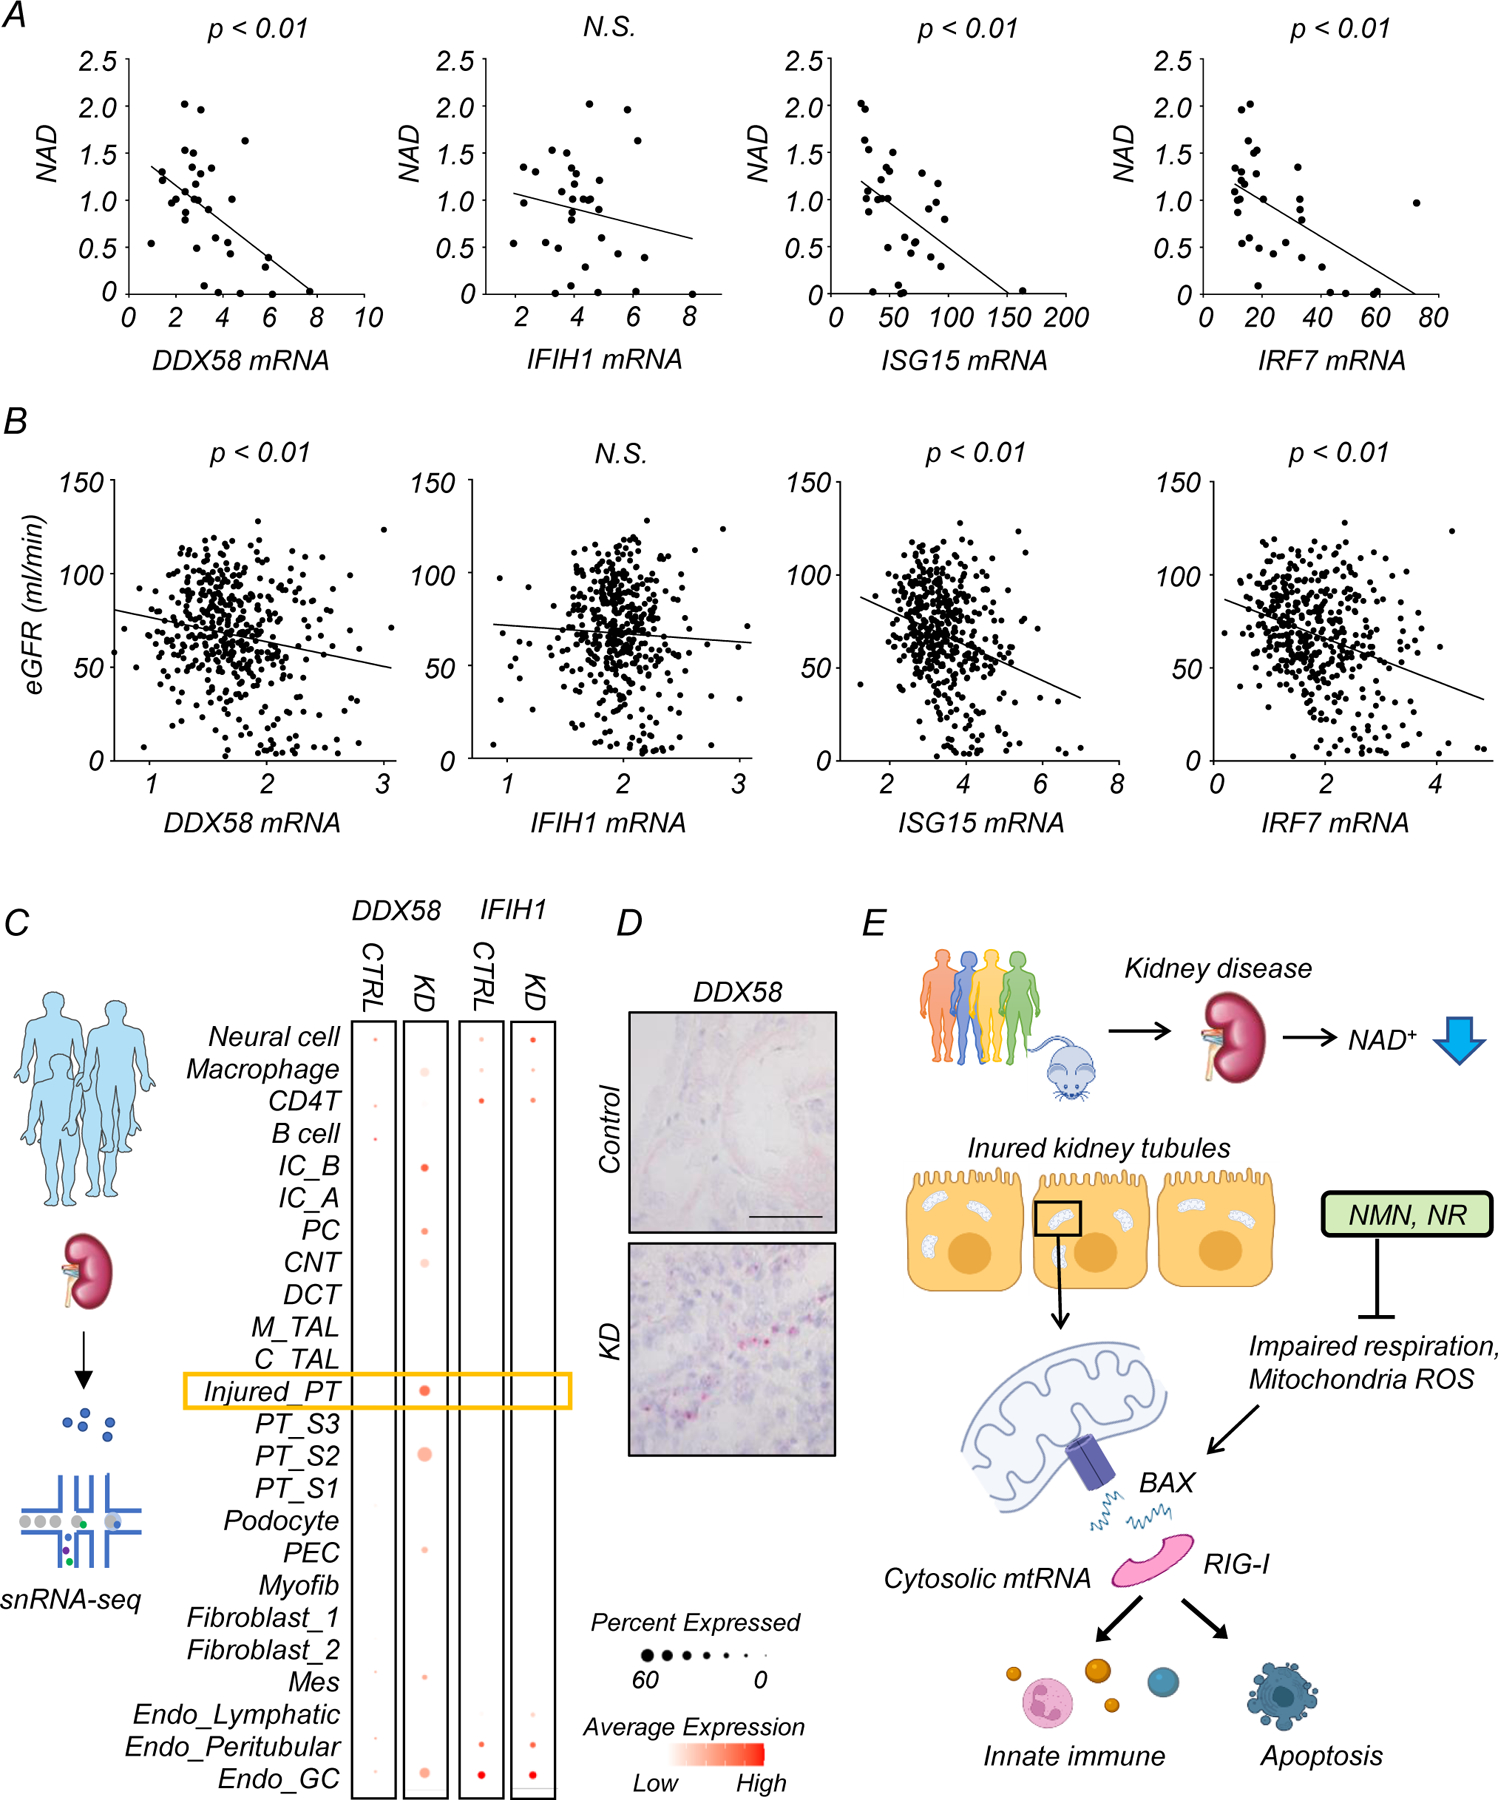
Our understanding of how global changes in cellular metabolism contribute to human kidney disease remains incompletely understood. Here we show that nicotinamide adenine dinucleotide (NAD+) deficiency drives mitochondrial dysfunction causing inflammation and kidney disease development. Using unbiased global metabolomics in healthy and diseased human kidneys, we identify NAD+ deficiency as a disease signature. Furthermore using models of cisplatin- or ischaemia-reperfusion induced kidney injury in male mice we observed NAD+ depletion Supplemental nicotinamide riboside or nicotinamide mononucleotide restores NAD+ levels and improved kidney function. We find that cisplatin exposure causes cytosolic leakage of mitochondrial RNA (mtRNA) and activation of the cytosolic pattern recognition receptor retinoic acid-inducible gene I (RIG-I), both of which can be ameliorated by restoring NAD+. Male mice with RIG-I knock-out (KO) are protected from cisplatin-induced kidney disease. In summary, we demonstrate that the cytosolic release of mtRNA and RIG-I activation is an NAD+-sensitive mechanism contributing to kidney disease.


Conflict of interest statement

Conflict of interest statement

Work in the Susztak lab is supported by Gilead, GSK, Boehringer, Regeneron, Novo Nordisk, Novartis, Calico, Astra Zeneca, Genentech, Ventus, and Maze biotech. J.A.B. is consultant to Pfizer and Cytokinetics, an inventor on a patent for using NAD+ precursors in liver injury and has received research funding and materials from Elysium Health and Metro International Biotech, both of which have an interest in NAD+ precursors. The remaining authors declare no competing interests.

Figures

Extended Data Fig. 1
Extended Data Fig. 1. Changes in de novo NAD+ synthesis pathway in human and mouse kidneys.
(A) Simplified de novo NAD+ synthesis pathway. The color indicates metabolites significantly higher (red) or lower (blue) in injured kidneys of human and mice. (B) Relative quantification of tryptophan, kynurenine, and quinolinate in human kidneys (Healthy control n=25. Kidney disease n=25). * p<0.05. N.S. not significant. (C) Relative quantification of tryptophan, kynurenine, and quinolinate in mouse kidneys (PBS n=4. Cis n=4). ** p<0.01, *** p<0.001. (D) Heatmap showing the expression of genes involved in NAD+ metabolism in human kidneys. Color indicates higher (red) or lower (blue) expression. (E) Heatmap showing the expression of genes involved in NAD+ metabolism in mouse kidneys. Color indicates higher (red) or lower (blue) expression. Data are presented as mean ± s.e.m. and were analyzed using a two-tailed Student’s t-test.
Extended Data Fig. 2
Extended Data Fig. 2. Changes in de novo NAD+ synthesis pathway in age-matched human kidneys.
(A) Demographic and clinical data of age-matched human kidney samples. (B) Relative quantification of NAD+, NR, NAM, and quinolinate in human kidneys (Healthy control n=25. Kidney disease n=25). * p<0.05. Data are presented as mean ± s.e.m. and were analyzed using a two-tailed Student’s t-test.
Extended Data Fig. 3
Extended Data Fig. 3. The expression levels of genes involved in cytosolic DNA and RNA sensing in kidneys.
(A) TPM values of cGAS, Aim2, Tlr9, Zbp1, and Ddx58 in kidneys. (B) Relative transcript levels of Ddx58, Isg15, Irf7, and Ifitm3 in in the kidneys of experimental groups (PBS n=4. Cis + PBS n=8. Cis + NMN n=8. Cis + NR n=8). Upper: Data were normalized using Gapdh. Lower; Data were normalized using Actb. Data are presented as mean ± s.e.m. and were analyzed using a one-way ANOVA followed by Tukey post hoc test for multigroup comparison.
Extended Data Fig. 4
Extended Data Fig. 4. NMN and NR supplementation improved kidney function and lowered inflammation in IRI mouse kidney disease model.
(A) The experiment designs. NAD+ precursors (NMN or NR) or vehicle (PBS) were injected i.p. for 4 consecutive days. First dose was injected 2 hours before IRI. (B) Kidneys were collected 3 days after IRI. Kidney NAD+ levels in experimental groups. *p<0.05. (C) Representative images of hematoxylin and eosin staining and semi-quantitative analysis of tubule injury in experimental groups. Scale bars: 20 μm. *p<0.05. (D) Serum creatinine and blood urea nitrogen (BUN) levels in experimental groups. **p<0.01. (E) Relative expression levels of Lcn2 and Havcr1 in the kidneys of mice in experimental groups. **p<0.01. (F) Relative expression levels of Ddx58, Isg15, Irf7, ifitm3, Cxcl10, and Cxcl16 in the kidneys of mice in experimental groups. *p<0.05, **p<0.01. (B-F) PBS n=4. Cis + PBS n=8. Cis + NMN n=8. Cis + NR n=8. Data are presented as mean ± s.e.m. and were analyzed using a one-way ANOVA followed by Tukey post hoc test for multigroup comparison.
Extended Data Fig. 5
Extended Data Fig. 5. The effect of NAD+ depletion by NAMPT inhibitor (FK866)
(A) Experimental design. Renal tubule cells were cultured and treated with NAMPT inhibitor, FK866 (100nM) for indicated days. NAD+ levels in renal tubule cells and changes in live cell numbers of experimental groups on day1 (D1), day2 (D2), and day3 (D3). (B) Relative transcript levels of Bax, Ddx58, Isg15, Irf7, ifitm3, Cxcl10, and Cxcl16 in renal tubule cells of experimental groups on D2. Gene expression levels were normalized to Gapdh. (A, B) PBS n=3. FK866 + PBS n=3. FK866 + NR n=3. Data are presented as mean ± s.e.m. and were analyzed using a one-way ANOVA followed by Tukey post hoc test for multigroup comparison.
Extended Data Fig. 6
Extended Data Fig. 6. NAD+ precursors (NMN or NR) treatment restored mitochondria respiration capacity, lowered apoptosis, and improved energy production
(A) Cytotoxicity assay. The data is as represented as fold-change normalized to control PBS group (n=8 in each group). (B) Relative transcript levels of Bax in renal tubule cells of experimental groups (n=3 in each group). Gene expression levels were normalized to Gapdh. (C) The result of oxygen consumption rate (OCR) in cultured renal tubule cells of experimental groups PBS n=6. Cis + PBS n=6. Cis +NMN n=5. Cis + NR n=5. *p<0.05. The data was normalized to total protein levels. (D) ATP levels in renal tubule cells in experimental groups (n=3 in each group). *p<0.05. The data was normalized to total protein levels. (E) Live cell numbers of cisplatin-treated renal tubule cells in indicated experiment groups (n=3 in each group). veh; vehicle control. N.S. not significant. Data are presented as mean ± s.e.m. and were analyzed using a one-way ANOVA followed by Tukey post hoc test for multigroup comparison.
Extended Data Fig. 7
Extended Data Fig. 7. MitoTEMPO and BAX inhibitor reduced RIG-I cytosolic RNA sensing pathway induction in renal tubule cells.
(A) (Left) The experimental design of the MitoTEMPO study (Right) Relative transcript levels of Ddx58, isg15, and Irf7 in experimental groups (n=3 in each group). Gene expression levels were normalized using Gapdh. veh; vehicle control. *p<0.05. (B) (Left) The experimental design of the BAX inhibitor study (Right) Relative transcript levels of Ddx58, isg15, and Irf7 in experimental groups (n=3 in each group). Gene expression levels were normalized using Gapdh. veh; vehicle control. *p<0.05. Data are presented as mean ± s.e.m. and were analyzed using a one-way ANOVA followed by Tukey post hoc test for multigroup comparison.
Extended Data Fig. 8
Extended Data Fig. 8. RIG-I depletion protected from kidney injury, cell death, and inflammation.
(A) Western blot quantification of RIG-I, MAVS, cleaved caspase-3 (cCASP3) in mice kidneys in indicated groups (n=3 in each group). *p<0.05, ***p<0.001. N.S. not significant. (B) Experimental design. Renal tubule cells were isolated from WT and RIG-I KO mice. Relative transcript levels of Ifih1, cGAS, Isg15 and Irf7 in renal tubule cells of experimental groups (n=3 in each group). Gene expression levels were normalized to Gapdh. *p<0.05. N.S. not significant. (C) Kidney NAD+ levels in experimental groups (WT + PBS n=4. RIG-I KO + PBS n=4. WT + Cis n=6. RIG-I KO + Cis n=6). *p<0.05. Data are presented as mean ± s.e.m. and were analyzed using a one-way ANOVA followed by Tukey post hoc test for multigroup comparison.
Extended Data Fig. 9
Extended Data Fig. 9. The effect of MDA5 and cGAS deletion on expression of inflammatory molecules in cisplatin treated renal tubule cells.
(A) Experimental design. Renal tubule cells were isolated from WT and MDA5 KO mice. Western blot image of MDA5 in renal tubule cells. Relative transcript levels of Ddx58, cGAS, Isg15, Irf7, and Ifitm3 in experimental groups (n=3 in each group). Gene expression levels were normalized to Gapdh. N.S. not significant. (B) Experimental design. Renal tubule cells were isolated from cGAS flox/flox mice, and infected with Adenovirus-GFP (Ade-GFP) or Adenovirus-Cre-GFP (Ade-Cre-GFP). Western blot image of cGAS in renal tubule cells. Relative transcript levels of Ddx58, Ifih1, Isg15, Irf7, and Ifitm3 in experimental groups (n=3 in each group). Gene expression levels were normalized to Gapdh. N.S. not significant*p<0.05. N.S. not significant. Data are presented as mean ± s.e.m. and were analyzed using a one-way ANOVA followed by Tukey post hoc test for multigroup comparison.
Extended Data Fig. 10
Extended Data Fig. 10. The correlation between the degree of renal fibrosis and expression of RIG-I and cytosolic RNA sensing pathway genes.
(A) Correlation between the degree of kidney fibrosis and normalized transcription levels of DDX58, ISG15, and IRF7 in human kidney samples. (B) Correlation between transcription levels of DDX58 and ISG15, IRF7, CXCL10, and CXCL16 in human kidney samples. (C) Correlation of relative transcript levels of PPARGC1A with kidney NAD+ levels and eGFR. p-value was calculated by Person’s correlation.
Figure 1.
Figure 1.. Integrated metabolomics and transcriptomics data analysis of human kidney samples
(A) Total of 50 human kidney samples were collected for metabolomics analysis; including healthy controls (n=25) and patients with kidney disease (n=25). (B) Volcano plot of metabolites showing significant changes in human diseased kidneys. x-axis: log2 fold change (log2FC). Y-axis: -log10(p-value). Color indicates metabolites significantly higher (red) or lower (blue) in human diseased kidneys. Welch’s two-sided t-test was used to calculate p-value. (C) Metabolic pathways showing significant changes in diseased kidneys. The dot color indicates the level of significance, the dot size indicates pathway impact. p-value was calculated from the enrichment analysis in Metaboanalyst. (D) The simplified NAD salvage pathway. Blue indicates metabolites significantly lower in human diseased kidneys. (E) The levels of NAD+, NMN, NR, and NAM in human kidneys (Healthy control n=25. Kidney disease n=25). * p<0.05. N.S. not significant. Data are presented as mean ± s.e.m. and were analyzed using Welch’s two-sided t-test. (F) The bulk RNA-seq of same human kidney samples used for metabolomic studies. (G) Gene ontology analysis of cellular composition of genes significantly correlating with kidney NAD+ levels. The dot color and size indicate significance and gene counts, respectively. (H) The correlation between kidney NAD+ levels (x-axis) and relative genes expression (y-axis) encoding mitochondrial proteins. P-value was calculated using Pearson’s correlation.
Figure 2.
Figure 2.. Integrated metabolomics and transcriptomics data analysis of mouse kidney disease samples
(A) Experimental set-up to collect sham (PBS, n=4) or cisplatin (n=4)-injected kidneys. (B) Volcano plot showing significantly changed metabolites in the kidneys of mice. x-axis: log2 fold change (log2FC). Y-axis: -log10(p-value). Color indicates metabolites significantly higher (red) or lower (blue) in cisplatin-injected kidneys. Welch’s two-sided t-test was used to calculate p-value. (C) Metabolic pathways showing significant changes in diseased kidneys. The dot color indicates significance, the dot size indicates pathway impact. p-value was calculated from the enrichment analysis in Metaboanalyst. (D) The salvage pathway of NAD+ biosynthesis. Blue indicates the metabolites significantly lower in the kidneys of mice injected with cisplatin. (E) The levels of NAD+, NMN, NR, and NAM in the kidneys of mice (PBS n=4. Cis n=4). *** p<0.001. Data are presented as mean ± s.e.m. and were analyzed using Welch’s two-sided t-test. (F) The bulk RNA-seq of same mice kidney samples used for metabolomics analysis. (G) Gene ontology analysis of cellular composition of genes significantly correlated with kidney NAD+ levels. The dot color and size indicate significance and gene counts, respectively. (H) The levels of Acadm, Aco2, Ndufv1, and Bax in kidneys of mice (PBS n=4. Cis n=4). ***p<0.001. Data are presented as mean ± s.e.m. and were analyzed using a two-tailed Student’s t-test.
Figure 3.
Figure 3.. NAD+ precursors (NMN, NR) supplementation protected from kidney dysfunction, tubular injury, and apoptosis induced by cisplatin.
(A) The experiment designs. NAD+ precursors (NMN or NR) and vehicle control (PBS) were injected i.p. for 4 consecutive days. First dose was injected 2 hours before cisplatin injection (25mg/kg). Kidneys were collected 3 days after cisplatin injection. (B) Kidney NAD+ levels in experimental groups. ** p<0.01. (C) Representative images of hematoxylin and eosin staining and semi-quantitative analysis for tubule injury in experimental groups. Scale bars: 20 μm. *p<0.05. (D) Serum creatinine and blood urea nitrogen (BUN) levels in experimental groups. *p<0.05. (E) Relative expression levels of Lcn2 and Havcr1 in the kidneys of mice in experimental groups. *p<0.05. (F) PCA analysis of RNA-seq in experimental groups. (G) (Upper panel) The number of genes significantly higher or lower in kidneys of mice injected with cisplatin. The number of genes normalized by both NAD+ precursors (NMN and NR). (Lower panel) Corresponding GO analysis of normalized genes. (H) Western blot image and quantification of BAX, cleaved caspase-3 (cCASP3) in experimental groups. The protein expression was normalized using GAPDH (n=3 in each group). *p<0.05. (I) Quantification of kidney ATP levels in experimental groups. The values were normalized using total protein levels (n=4 in each group). *p<0.05. (B-E) (PBS n=4. Cis + PBS n=8. Cis + NMN n=8. Cis + NR n=8). Data are presented as mean ± s.e.m. and were analyzed using a one-way ANOVA followed by Tukey post hoc test for multigroup comparison.
Figure 4.
Figure 4.. NAD+ precursor (NMN, NR) supplementation protected from cytosolic RNA sensing pathway activation.
(A) Heatmap showing genes associated with cytosolic RNA sensing and downstream interferon stimulated genes (ISG) in experimental groups. (B) Western blot image and quantification of RIG-I, MAVS, and SDD-PAGE image of MAVS aggregation in the kidneys of mice in experimental groups. *p<0.05. (C) Quantification of RIG-I and MAVS in the kidneys of experimental groups (n=3 in each group). *p<0.05. (D) (Upper panel) Kidney tubule cell culture from WT mice. (Lower panel) Relative transcript levels of Ddx58, Isg15, Irf7 and Ifitm3 in experimental groups (n=3 in each group). *p<0.05. (E) The representative in situ hybridization image of Isg15 in kidneys of mice in experimental groups. 2 experiments were repeated independently. Scale bars: 20 μm. (F) (Left) In silico cellular deconvolution analyses for the kidneys of mice in experimental groups. (Right) Each row represents cell type. Color indicates higher (red) or lower (blue) values. Mac; Macrophage, NKT; natural killer T cells, Endo; endothelial, IC; intercalated cell, PC; principal cell, DCT; distal convoluted tubule, ALOH; ascending loop of Henle, PT; proximal tubule. (G) Representative image and quantification of neutrophil (Ly6g) staining in the kidneys of mice in experimental groups (n=4 in each group). Scale bars: 20 μm. HPF: high power field. *p<0.05. Data are presented as mean ± s.e.m. and were analyzed using a one-way ANOVA followed by Tukey post hoc test for multigroup comparison. Gene or protein expression levels were normalized using Gapdh.
Figure 5.
Figure 5.. Activation of RIG-I cytosolic RNA sensing pathway in response to cytosolic mtRNA leakage.
(A) Experimental design. Cytosolic RNA was isolated from cultured renal tubules of WT mice following cisplatin injury. (B) Western blot image of GAPDH (cytosolic), HSP60 (mitochondria), TIMM44 (mitochondria), and H3 (nuclear) in whole cell or extracted cytosolic fraction using Digitonin. 3 experiments were repeated independently. (C) Relative transcript levels of Co2, Nd1 in cytosolic fraction treated with DNase in experimental groups (n=3 in each group). *p<0.05. (D) (Upper) Experimental design. Extracted mtRNA was transfected to renal tubule cells. (Lower) Relative transcript levels of Ddx58, Isg15, Irf7, ifitm3, and Tmem173 in renal tubule cells treated with mock or mtRNA transfection (n=3 in each group). **p<0.01, ***p<0.001, N.S. not significant. (E) Experimental design. Cytosolic fraction from cisplatin-treated renal tubule cells were immunoprecipitated with RIG-I Ab or IgG, followed by RNA isolation. Fold enrichment of Co2 and Nd1 was calculated (n=3 in each group). **p<0.01. (F) Experimental design. Renal tubule cells were cultured in a medium or in the presence of ethidium bromide (EtBr, Rho0 cells), and treated with PBS or cisplatin. (G) Relative transcript levels of Co2, ND1 in WT or Rho0 renal tubule cells. **p<0.01. (H) Relative transcript levels of Ddx58, Isg15, Irf7, and ifitm3 in WT or Rho0 renal tubule cells as indicated. *p<0.05, **p<0.01, ***p<0.001. Gene expression levels were normalized using Gapdh. Data are presented as mean ± s.e.m. and were analyzed using a two-tailed Student’s t-test or a one-way ANOVA followed by Tukey post hoc test for multigroup comparison.
Figure 6.
Figure 6.. NAD+ precursors (NMN and NR) restored mitochondria function in renal tubule cells and mitochondrial metabolic activity in mice kidneys after cisplatin treatment.
(A) Representative image and quantification of MitoSOX in renal tubules in experimental groups. Scale bars: 5 μm (n=6 in each group). *p<0.05. (B) Representative image and quantification of JC-1 in renal tubules in experimental groups (n=3 in each group). Scale bars: 5 μm. JC-1 detect mitochondria membrane potential; aggregate form (red) and monomer form (green). *p<0.05. (C) The relative quantification of live renal tubule cells in experimental groups (n=8 in each group). *p<0.05. (D) Mitochondria were isolated from cultured renal tubule cells. Mitochondria respiration in each component (C1: complex1, CII: complex II, CIV: complex IV) was monitored by Oroboros in experimental groups (n=3 in each group). The values were normalized by total proteins. *p<0.05. (E) Quantification of mitochondrial NAD+ levels in renal tubule cells from experimental groups (n=4 in each group). Values were normalized to total protein levels. *p<0.05. (F) PCA analysis of untargeted metabolomics in kidneys of mice in experimental groups. (G) Number of metabolites significantly higher (Up) or lower (Down) in the kidneys of mice injected with cisplatin. Number of metabolites those levels returned to normal following NAD+ precursor (NMN or NR) treatment. (H) Graphic representation of the TCA cycle intermediates. The color indicates metabolites; significantly increased (red), decreased (blue), not changes (Black), not detected (gray) in the kidneys of mice treated with cisplatin. (I) Heatmap showing TCA cycle intermediated and their derivative metabolites. Color indicates higher (red) or lower (blue) levels. Data are presented as mean ± s.e.m. and were analyzed using a one-way ANOVA followed by Tukey post hoc test for multigroup comparison.
Figure 7.
Figure 7.. Rig-I KO and MAVS KO mice protected from kidney dysfunction, tubule injury, apoptosis induced by cisplatin.
(A) Experimental design. WT or Rig-I KO mice were injected with PBS or Cisplatin (Cis). (B) Serum creatinine (Cr) and blood urea nitrogen (BUN) levels in experimental groups. *p<0.05. (C) Relative transcript levels of Havcr1 and Lcn2 in kidneys of experimental groups. *p<0.05. (D) Representative images of hematoxylin and eosin staining and semi-quantitative analysis of renal tubule injury in experimental groups. Scale bars: 20 μm. *p<0.05. (E) Western blot image and quantification of RIG-I, MAVS, cleaved caspase-3 (cCASP3), and SDD-PAGE of MAVS aggregation (n=3 in each group). *p<0.05, ***p<0.001. N.S. not significant. (F) Relative transcript levels of Isg15, Irf7 in the kidneys of experimental groups. *p<0.05. (G) Renal tubules were isolated from the kidneys of WT and Rig-I KO mice. Relative transcript levels of Isg15, Irf7 in experimental groups (n=3 in each group). *p<0.05. (H) Experimental design. WT and MAVS KO mice were injected with PBS or Cisplatin (Cis). (I) Serum creatinine and blood urea nitrogen (BUN) levels in experimental groups. *p<0.05. (J) Relative transcript levels of Havcr1 and Lcn2 in kidneys of experimental groups. *p<0.05. (K) Relative transcript levels of Isg15, Irf7 in the kidneys of experimental groups. *p<0.05. (L) Renal tubules were isolated from the kidneys of WT and MAVS KO mice. Relative transcript levels of Isg15, Irf7 in experimental groups (n=3 in each group). *p<0.05. (B-D,F) (WT + PBS n=3. RIG-I KO + PBS n=3. WT + Cis n=6. RIG-I KO + Cis n=6). (I-K) (WT + PBS n=3. MAVS KO + PBS n=3. WT + Cis n=7. MAVS KO + Cis n=6). Gene and protein expression levels were normalized using Gapdh. Data are presented as mean ± s.e.m. and were analyzed using a one-way ANOVA followed by Tukey post hoc test for multigroup comparison.
Figure 8
Figure 8. Lower NAD+ levels are associated with higher RIG-I expression in renal tubules of human diseased kidneys
(A) Bulk RNA-seq and untargeted metabolomics were performed in the same human kidney samples. Correlation of kidney NAD+ levels and relative transcript levels of DDX58, IFIH1, ISG15, and IRF7. p-value was calculated by Person’s correlation. (B) The correlation of eGFR with relative transcript levels of DDX58, IFIH1, ISG15, and IRF7 in 432 human kidney tissue samples. x-axis is relative gene expression y-axis is eGFR ml/min/1.72m2. p-value was calculated by Person’s correlation. (C) snRNA-seq of human kidney samples. Each row represents cell type. Note that DDX58 expression was enriched in injured proximal tubule (PT) cells in kidney disease (KD) samples. IC; Intercalated cell, PC; principal cell, CNT; connecting tubule, DCT; distal convoluted tubule, M_TAL; thick ascending limp in the medulla, C_TAL; thick ascending limp in the cortex, PT; proximal tubule, PEC; parietal epithelial cell, MES; mesangial cell. GC; glomerular capillary (D) Representative image of in situ hybridization of DDX58 in healthy control and kidney disease sample (KD). Scale bars: 20 μm. 2 experiments were repeated independently. (E) Proposed mechanism of proximal tubule metabolic dysfunction

Comment in

References

    1. Doke T et al. Transcriptome-wide association analysis identifies DACH1 as a kidney disease risk gene that contributes to fibrosis. The Journal of clinical investigation 131 (2021). - PMC - PubMed
    1. Qiu C et al. Renal compartment-specific genetic variation analyses identify new pathways in chronic kidney disease. Nature medicine 24, 1721–1731 (2018). - PMC - PubMed
    1. Sheng X et al. Mapping the genetic architecture of human traits to cell types in the kidney identifies mechanisms of disease and potential treatments. Nature genetics 53, 1322–1333 (2021). - PMC - PubMed
    1. Liu BC, Tang TT, Lv LL & Lan HY Renal tubule injury: a driving force toward chronic kidney disease. Kidney Int 93, 568–579 (2018). - PubMed
    1. Nadour Z et al. Validation of a liquid chromatography coupled to tandem mass spectrometry method for simultaneous quantification of tryptophan and 10 key metabolites of the kynurenine pathway in plasma and urine: Application to a cohort of acute kidney injury patients. Clinica chimica acta; international journal of clinical chemistry 534, 115–127 (2022). - PubMed

Publication types