

Editorial
doi: 10.21037/qims-22-1411.
Epub 2022 Dec 30.
A summary of our recent evidence-based works on radiographic diagnostics of prevalent osteoporotic vertebral fracture in older men and women
Affiliations
- PMID: 36915360
- PMCID: PMC10006108
- DOI: 10.21037/qims-22-1411
Item in Clipboard
Editorial
A summary of our recent evidence-based works on radiographic diagnostics of prevalent osteoporotic vertebral fracture in older men and women
Quant Imaging Med Surg.
.
No abstract available
Conflict of interest statement
Conflicts of Interest: The author has completed the ICMJE uniform disclosure form (available at https://qims.amegroups.com/article/view/10.21037/qims-22-1411/coif). YXJW serves as the Editor-in-Chief of Quantitative Imaging in Medicine and Surgery. He is the founder of Yingran Medicals Co., Ltd., which develops medical image-based diagnostics software including those for vertebral compressive fracture evaluation. The author has no other conflicts of interest to declare.
Figures
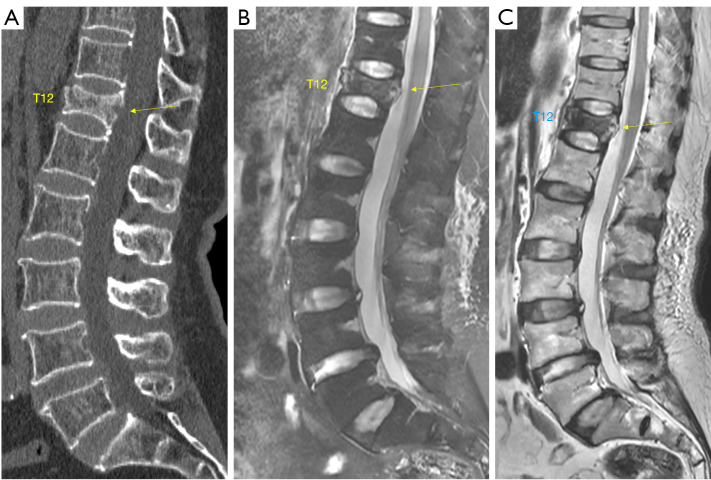
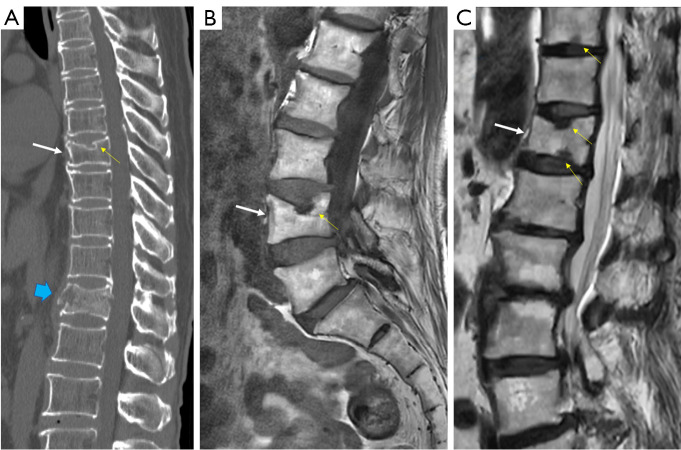
A 74-year-old woman with a low energy trauma induced T12 VF (arrow). Imaging (A: CT, B: T2 weighted MRI, C: T1 weighted MRI) was conducted 10 hours after the incident. Signals on MRI suggest the fracture was in acute phase. VF, vertebral fracture; CT, computed tomography; MRI, magnetic resonance imaging.
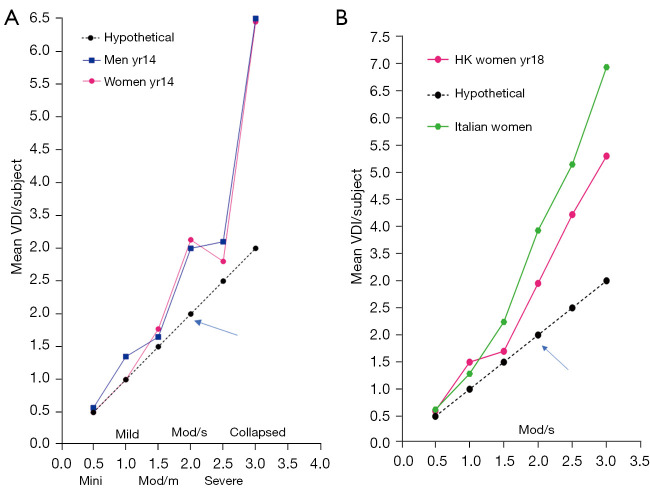
Relationship between the highest OLVF grading in a subject and the VDI [data from (8-10)]. One OLVF of ‘minimal’, ‘mild’, ‘moderate’, ‘moderately severe (mod/s)’, ‘severe’, ‘collapsed’ has <1/5, 1/5–<1/4, 1/4–<1/3, 1/3–<2/5, 2/5–<2/3, and ≥2/3 vertebral height loss, and is assigned a score of 0.5, 1.0, 1.5, 2.0, 2.5, 3.0 respectively. VDI is calculated by summing up the scores of vertebrae T4 to L5. X-axis: the highest OLVF grade of a subject. Y-axis: mean VDI score/subject. If each subject had one OLVF each, then the result follows the black dot and lines (hypothetical). Both (A,B) show, for subjects with one OLVF of ≥1/3 height loss (arrow), the chance of having multiple OLVFs per case increases. (A) MrOS(Hong Kong)and MsOS(Hong Kong) year-14 follow-up results for older men and older women. (B) MsOS(Hong Kong) year-18 follow-up radiograph women results and 302 Italian female cases from “Roman Osteoporosis Prevention Project”. VDI, vertebral deformity index; OLVF, osteoporotic-like vertebral fracture.
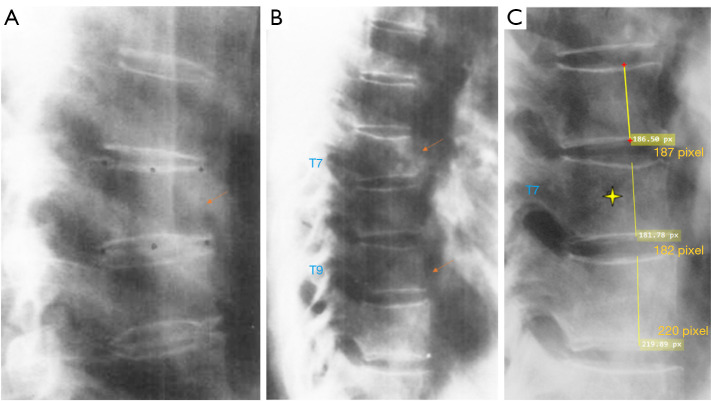
Examples of mild grade VD (A,B) in the article of Genant et al. (5) are classified by us as minimal grade deformity (arrow). (C) show a magnified image of T7 (stellate). According to our measurement approach (3), these three vertebral deformities do not reach the threshold of 1/5 vertebral height loss. For experienced readers, there is usually a very good agreement on the ‘yes’ or ‘no’ for the existence of a VD (except for those of very minimal deformities). However, disagreement on the grading is common, which can only be resolved by measurement with an agreed method. Radiographically, the VD in (A) cannot be certainly diagnosed as an OVF. In (B), two non-adjacent vertebral deformities suggest they were likely to be osteoporotic in a postmenopausal woman. Modified from Fig. 2 and Fig. 8 in (5). VD, vertebral deformity; OVF, osteoporotic vertebral fracture.
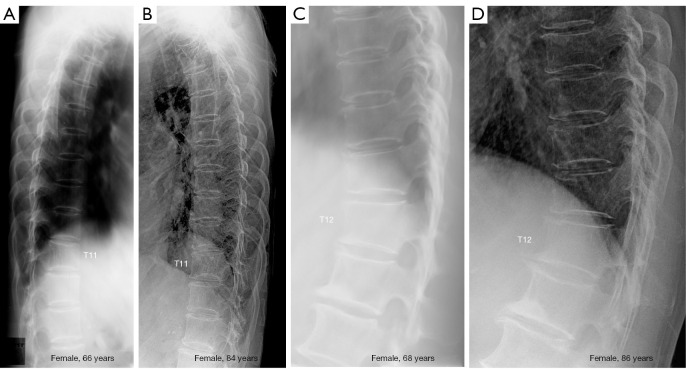
Radiographic recovery of OLVF of two female cases (A and C: baseline, B and D: follow-up). (A) and (B) show T11 recovered to normal shape. (C) and (D) show T12 recovered to normal shape. Images from the MsOS(Hong Kong) year-18 follow-up study. OLVF, osteoporotic-like vertebral fracture.
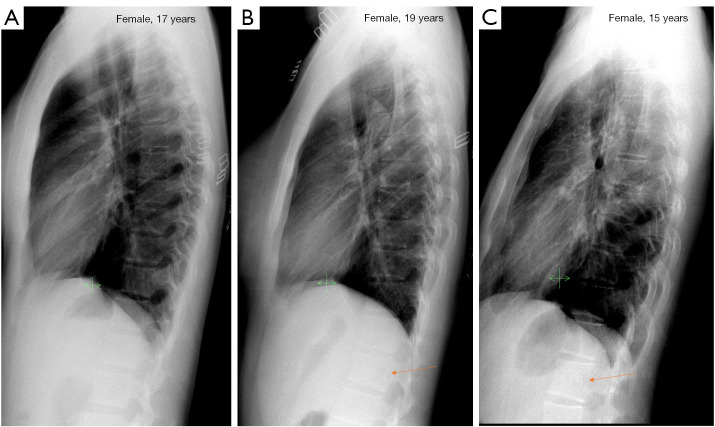
Examples of normal vertebrae and minimal grade VD among adolescent females. (A) Lateral chest radiograph of a 17-year-old female shows normal vertebrae. (B) Lateral chest radiograph of a 19-year-old female shows vertebra L2 minimal wedging (arrow). (C) Lateral chest radiograph of 15-year-old female shows vertebra L1 minimal wedging (arrow). Reused with permission from (11). VD, vertebral deformity.
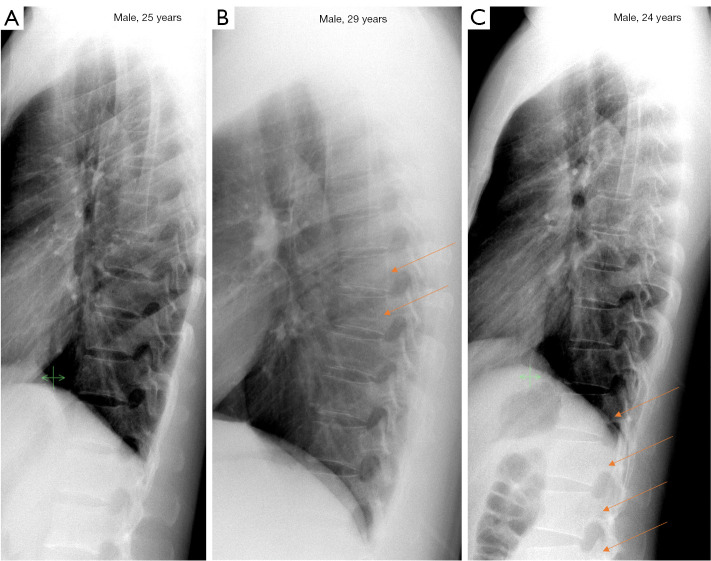
Examples of normal vertebrae and minimal/mild grades VD among adult males. (A) Lateral chest radiograph of a 25-year-old male shows normal vertebrae. (B) Lateral chest radiograph of a 29-year-old male shows vertebrae T7 and T8 minimal grade deformity (arrows). (C) Lateral chest radiograph of a 24-year-old male shows vertebrae T12, L1, L2 and L3 (partially seen) minimal grade deformity (arrows). Reused with permission from (11). VD, vertebral deformity.
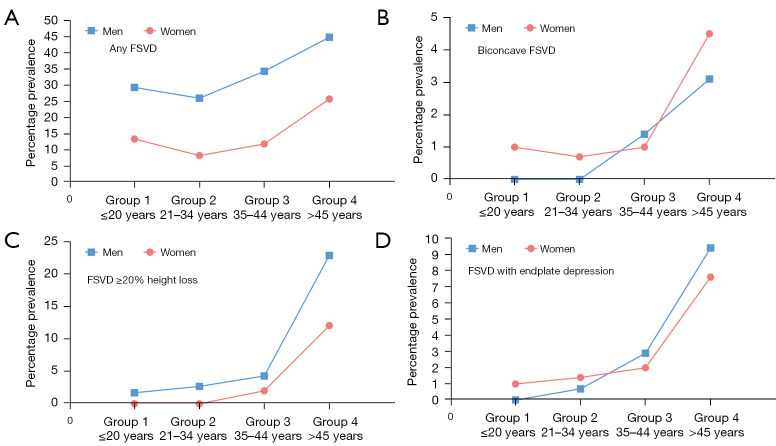
Prevalence of FSVDs among four age groups of female and male cases (the Jiaxing study). (A) Prevalence of all-inclusive FSVD, higher prevalences are noted among males than among females. Note a trend of lower FSVD prevalences is observed among groups 2 subjects (21–34 years) than among groups 1 subjects (≤20 years), both for females and for males. From female group-1 to group-2, there was also a reduction of multiplicity from 53.8% to 16.7% (11). (B) Prevalence of biconcave FSVDs, a weak trend of higher biconcave FSVD among females than among males is noted. (C) Prevalence of FSVDs with ≥20% vertebral height loss. (D) Prevalence of FSVDs with endplate depression. Both biconcave FSVDs and FSVDs with endplate depression are noted among subjects assumed to be with normal BMD (those <45 years). Reused with permission from (11). FSVDs, fracture shaped vertebral deformities; BMD, bone mineral density.
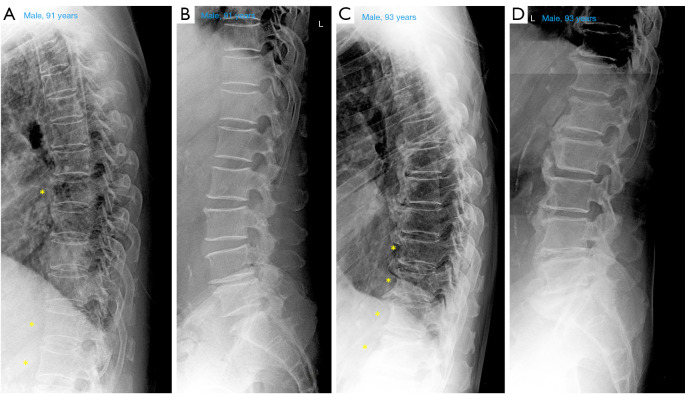
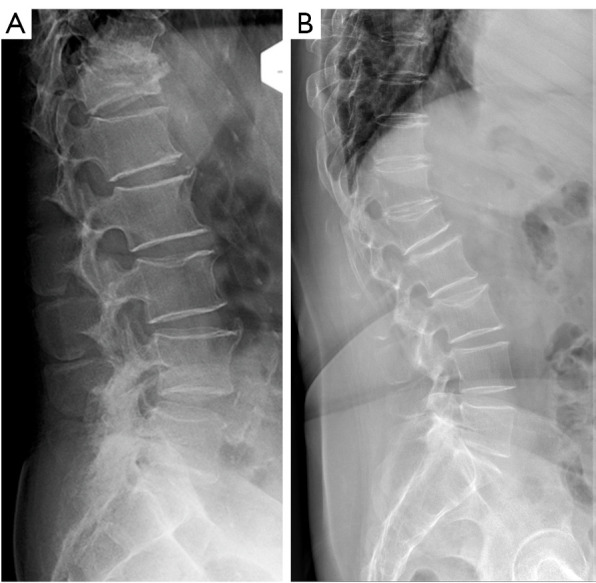
Thoracic and lumbar spine radiograph of two older male cases (A and B: a 91-year-old man, C and D: a 93-year-old man). Though these two cases were at an advanced age, no radiographic vertebral wedging is noted at mid-thoracic and thoracolumbar regions. *, vertebrae with endplate ring appearing as oval shape due to X-ray beam projection.
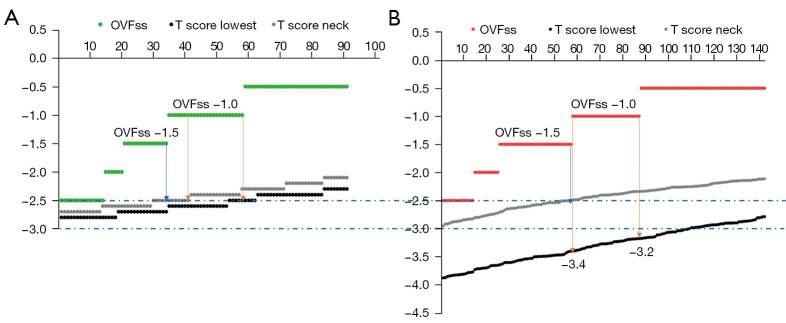
The relationship between OLVF sum score (denoted as OVFss in the graphs) of −1.5/−1.0 and T-scores for Italian women (A) and Chinese women (B). See reference (10) for methodology. Arrows indicate the threshold for suggesting osteoporosis. The study cohorts in these graphs had a mean age of 73.6 years for Italians and 74.0 years for Chinese. Reused with permission from (10). OVF, osteoporotic vertebral fracture; OLVF, osteoporotic-like vertebral fracture.
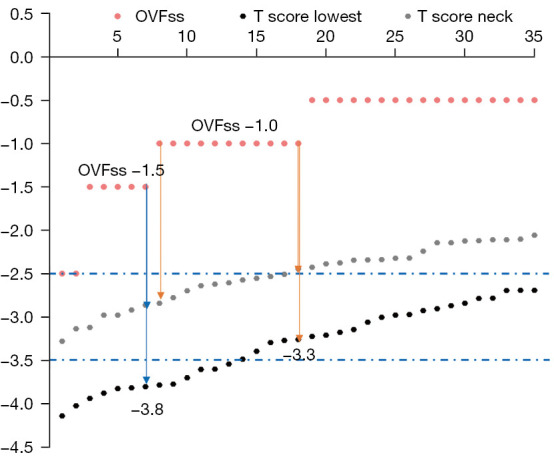
The relationship between OLVF sum score (denoted as OVFss in the graph) of −1.5/−1.0 and T-scores for Chinese women with a mean age of 68.9±5.5 years. See reference (10) for data and methodology. Arrows indicate the threshold for suggesting osteoporosis. OLVFss =−1.0 corresponds to highest tscorelowest of −3.3, and OLVFss =−1.5 corresponds highest tscorelowest of −3.8. Compared with the results in Figure 9, the results suggest that for a younger subject, in statistical terms, a lower BMD value might be required for the subject to sustain an OVF. Data from (10). OLVF, osteoporotic-like vertebral fracture; OVF, osteoporotic vertebral fracture; BMD, bone mineral density.

VDI among young and middle-aged patients unrelated to spine disorders (Jiaxing study). It can be assumed that for women younger than 44 years old and men younger than 60 years old there would be few cases, or none, had osteoporosis. One VD of ‘minimal’, ‘mild’, ‘moderate’, ‘moderately severe (mod/s)’, ‘severe’, ‘collapsed’ has <1/5, 1/5 -<1/4, 1/4 -<1/3, 1/3 -<2/5, 2/5 -<2/3, and ≥2/3 vertebral height loss, and is assigned a score of −0.5, −1.0, −1.5, −2.0, −2.5, −3 respectively. Chest VDI is calculated by summing up the scores of vertebrae T4 to L1 or L2 (depending the visibility of L2 on lateral chest radiograph). Patients with any fracture shaped VDs are presented. Vertical dotted line: separation of those <60 and ≥60 years old. Reused with permission from (11). OVF, osteoporotic vertebral fracture; VDI, vertebral deformity index; VD, vertebral deformity.
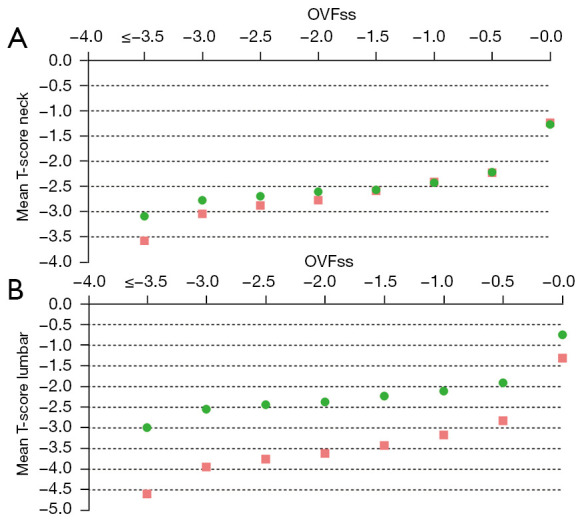
Relationship between OLVFss and mean femoral neck T-score (A) or mean lumbar spine T-score (B). Results for Italians (n=301, age: 73.6±6.1 years) are in green dots and results for Chinese are in pink square (n=521, 74.0±7.2 years). (A) shows, for those without OVF, the tscoreneck values are similar between Chinese and Italians. For OVFss ≤−2.0, for each OVF grade the values for Italian were slightly less negative than those for Chinese. For example, when OVFss =−2.5, tscoreneck is −2.60 for Italians and −2.77 for Chinese. This means, if we considered OVF severity as a surrogate clinical endpoint, then a tscoreneck of −2.77 for Chinese is equivalent to a tscoreneck of −2.60 for Italians. This supports our suggestion that, instead of adopting the cutpoint tscore value of ≤−2.5 for defining osteoporosis, this cutpoint tscore value for tscoreneck can be slightly lower for Chinese, such as ≤−2.7. (B) show data for tscorelumbar. It appears that Italians have a higher mean tscorelumbar value to start with even for those without OVF, once there is an OVF, then the difference between Italians and Chinese become wider. When OVFss =−2.5, tscorelumbar is −2.44 for Italians and −3.75 for Chinese, while when OVFss =−1.5, tscorelumbar is −2.23 for Italians and −3.42 for Chinese. This means, if we considered OVF severity as a surrogate clinical endpoint, then a tscorelumbar of −3.75 for Chinese is equivalent to a tscorelumbar of −2.44 for Italians. This supports our suggestion that, instead of adopting the conventional cutpoint tscore value of ≤−2.5 for defining osteoporosis, this cutpoint tscorelumbar value can be lowered to ≤−3.7 for Chinese women (18). Data from (10) (the same data as in Figure 9). tscoreneck, femoral neck T-score; tscorelumbar, lumbar spine T-score; OVF, osteoporotic vertebral fracture; OLVF, osteoporotic-like vertebral fracture.
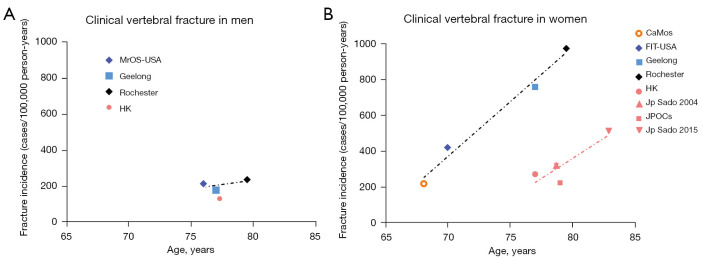
The clinical OVF prevalence among older men (A) and women (B). East Asians have a much lower clinical OVF prevalence than those of Caucasians. (A) Data are from MrOS(Hong Kong) study, Freitas et al.
Osteoporos Int 2008;19:615-23 (MrOS USA study), Sanders et al.
Osteoporos Int 1999;10:240-7 (Geelong study), and Cooper et al. J Bone Miner Res 1992;7:221-7 (Rochester study). (B) Data are from MsOS(Hong Kong) study; Sakuma et al., J Bone Miner Metab 2008;26:373-8 (Japan Sado 2004), Imai et al., J Bone Miner Metab 2019;37:484-90 (Japan Sado 2015); Kamiya et al., Maturitas 2019;130:13-20 (JPOCS); Sanders et al.
Osteoporos Int 1999;10:240-7 (Geelong study); Cooper et al.
J Bone Miner Res 1992;7:221-7 (Rochester study); Fink et al.
J Bone Miner Res 2005;20:1216-22 (FIT-USA study), and Papaioannou et al.
Osteoporos Int 2005;16:568-78 (CaMos study). The dotted black and orange lines indicate linear fits for simplicity (ideally it should be an exponential growth fit). OVF, osteoporotic vertebral fracture.
Examples of Schmorl node co-exist with OVF. Schmorl node can exist in the same vertebra with OVF, or in a vertebra without OVF. (A) Sagittally reconstructed spine CT image of an elderly women with acuate low energy trauma. Blue arrow denotes an acute OVF, white arrow denotes an OVF with apparent upper endplate depression and a Schmorl node. (B) L4 OVF with apparent upper endplate depression and a Schmorl node. (C) T12 OVF with apparent upper endplate depression and a Schmorl node and also with a lower endplate Schmorl node. T10 with a lower endplate Schmorl node. Yellow arrows: Schmorl node. (B) and (C) are from MsOS(Hong Kong) year-14 follow-up study. OVF, osteoporotic vertebral fracture; CT, computed tomography.
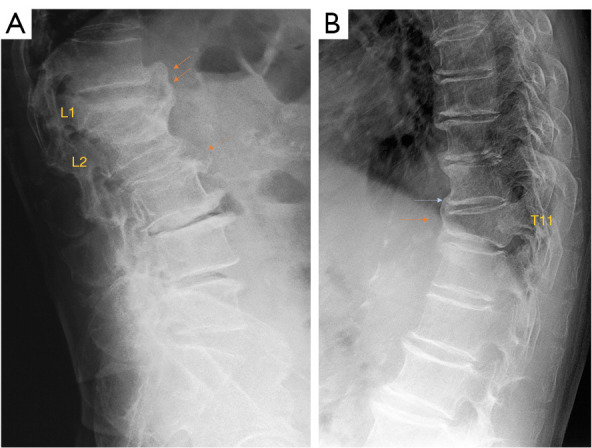
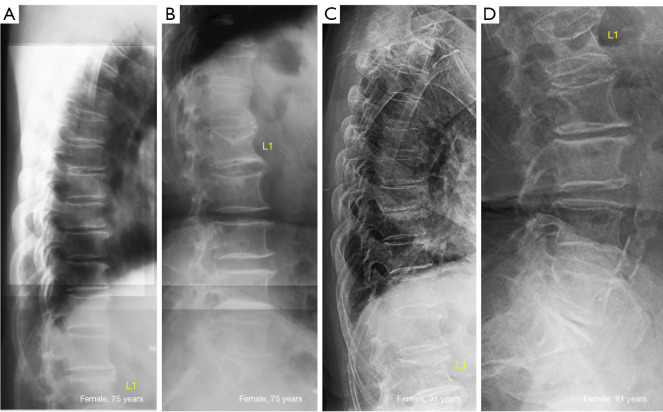
Endplate depression with vertebral height maintained. (A) Lumbar radiograph of a male subject aged 85 years. T12 collapsed deformity. L3 upper endplate slight depression with anterior vertebral height well maintained. (B) Lumbar radiograph of a female subject aged 74 years. L1 severe osteoporotic deformity. L3 upper endplate slight depression with anterior vertebral height well maintained.
Spine radiograph of a 72-year-old woman. (B) show T12 (arrow) upper endplate fracture mimics, while (A) suggests the upper endplate morphology and vertebral anterior height maintained.
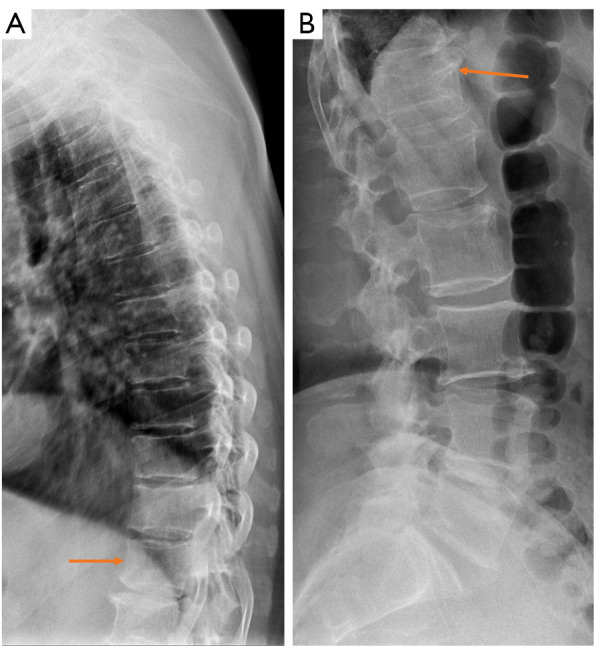
Formation of osteophyte bridging to stable the spine. (A) Radiograph of an 88-year-man, L1 is collapsed, while L2 is with severe OVF. From T12 to L2, there is a formation of osteophyte bridging (arrows). From L2 to L3, there is a partial formation of osteophyte bridging (arrow). (B) Radiograph of a 91-year-old man with T11 collapsed OVF and formation of osteophyte bridging from T10 to T12 (arrows). OVF, osteoporotic vertebral fracture.
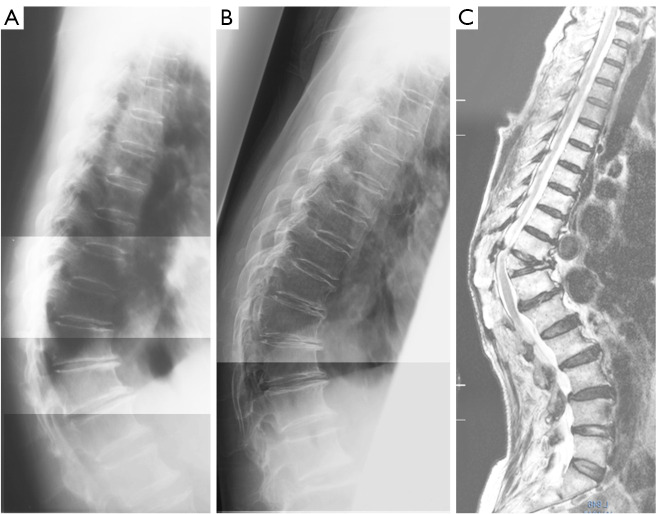
A female patient followed-up for 16 years (A,B: baseline thoracic and lumbar spine radiograph; C,D: follow-up thoracic and lumbar spine radiograph). L1 osteoporotic deformity and upper endplate depression are noted at baseline. After 16 years, no apparent progression was noted. Note that on (D) the L1 appears more compressed is due to the oblique X-ray projection. This patient did not take anti-osteoporosis medication during the follow-up period.
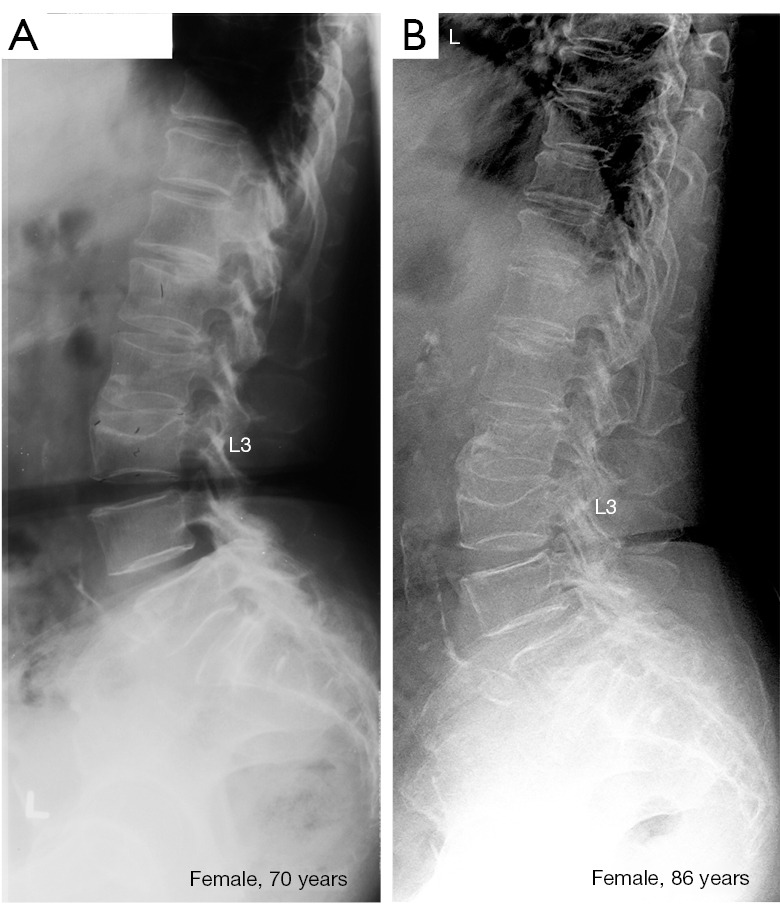
A female subject followed-up for 16 years (A: baseline lumbar spine radiograph; B: follow-up lumbar spine radiograph). L3 osteoporotic deformity and upper endplate depression are noted at baseline. After 16 years, no apparent progression was noted. This subject did not take anti-osteoporosis medication during the follow-up period.
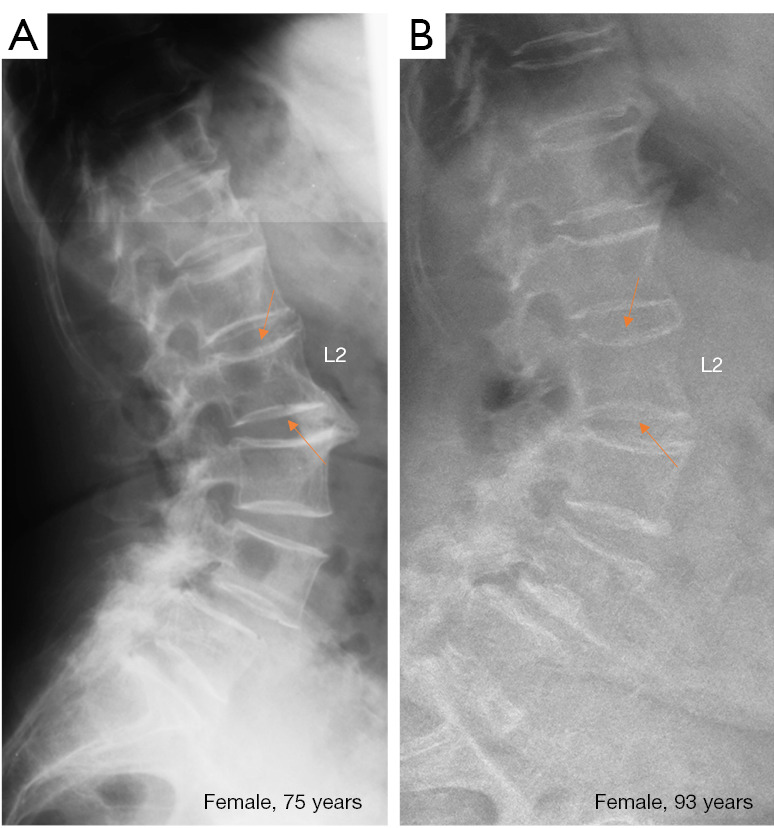
Baseline (A) and follow-up (B) lumbar spine radiograph of a female subject followed-up for 18 years. L2 had minimal depression of bother upper and lower endplates. After 18 years, endplate depressions only slightly progressed (arrows). The anterior vertebral height of L2 was maintained. This patient did not take anti-osteoporosis medication during the follow-up period.
A female case (80 years old at baseline) had T11 mild grade deformity progressed to collapse. (A) Baseline radiograph; T10, T11, T12 appeared anterior wedging with osteoarthritic degenerative changes (with reduced intervertebral disc heights and growth of osteophytes). (B) Year-4 follow-up radiograph. (C) Year-14 follow-up magnetic resonance imaging. (C) shows T11 is collapsed. A consistent local kyphosis suggests increased stress.
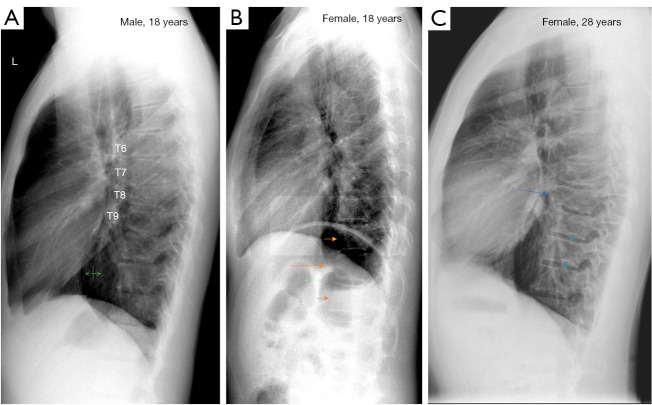
Three cases of congenital short vertebrae. (A) An 18-year-old man, vertebra T8 has a reduced height, and the size of T7 is larger than usual while size of T9 is smaller than usual. T10 has a longer than usual anterior length. Intervertebral disc spaces of T6/T7 and T7/T8 are narrowed. (B) An 18-year-old woman, vertebra T11 has a reduced height (long arrow). The anterior upper and lower corners are smooth. Vertebrae T10 and T12 (short arrows) have compensated overgrow. (C) A 28-year-old man vertebra (from the Jiaxing study), T8 has a reduced height (arrow), the border of T8 appears to be irregular. The lower endplates of T9 and T10 both have a notch (*), suggesting juvenile epiphysitis. (A,B) are reused with permission from (11).
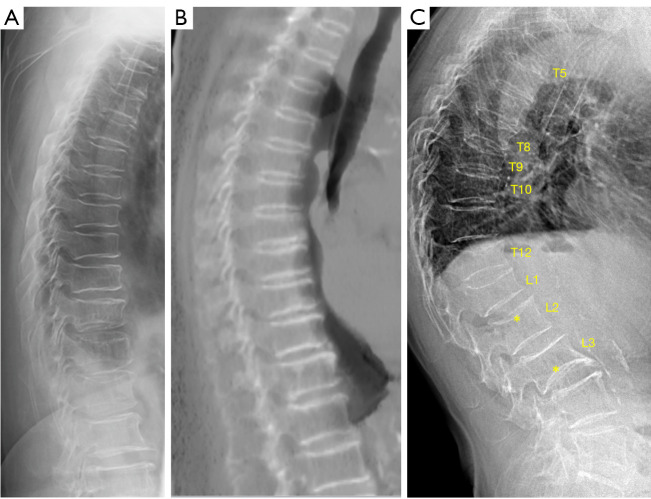
Differentiation of multiple aSVs and multiple OVFs. (A) A female case radiograph shows multiple aSVs. (B) Another female case sagittally reconstructed CT scan shows multiple aSVs. (C) Another female case radiograph shows multiple OVFs. In (C), OVFs vary greatly in shape and severity, and most show endplate depression. (*) on L2 shows upper endplate fracture (depression); (*) on L3 show lower expansive endplate (an anomaly). In (A,B), multiple aSVs show much less variation in shape and severity, and aSVs do not show apparent wedging or apparent endplate depression. In (B), the increased density of the involved endplates suggests regenerative inflammatory changes. While many aSV in (A) and (B) are already quite severe, it appears that they did not apparently ‘fracture’. Reused with permission from (9). aSVs, acquired short vertebrae; OVF, osteoporotic vertebral fracture; CT, computed tomography.
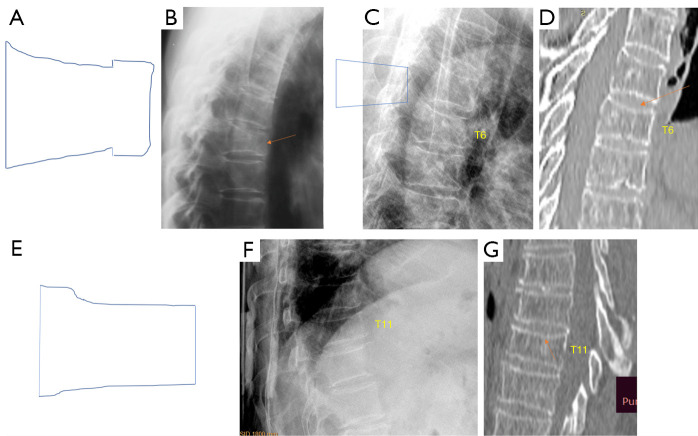
A singular aSV can be the ‘intermediate shape’ between OVF’s anterior wedging and ‘mixed shape’ OVF, thus most likely be an OVF. (A) and (B) illustrate a ‘mixed shape’ OVF (arrow in B). (C) and (D) illustrate an anteriorly wedged OVF. The arrow in (D) denotes endplate depression. (E-G) illustrate an OVF with the appearance of singular aSV. Arrow in (G) suggest slight endplate depression. These images illustrate (F) can be an ‘intermediate shape’ between (B) and (C). (A,B) are reused with permission from (1). (E,F) are reused with permission from (15). aSV, acquired short vertebra; OVF, osteoporotic vertebral fracture.
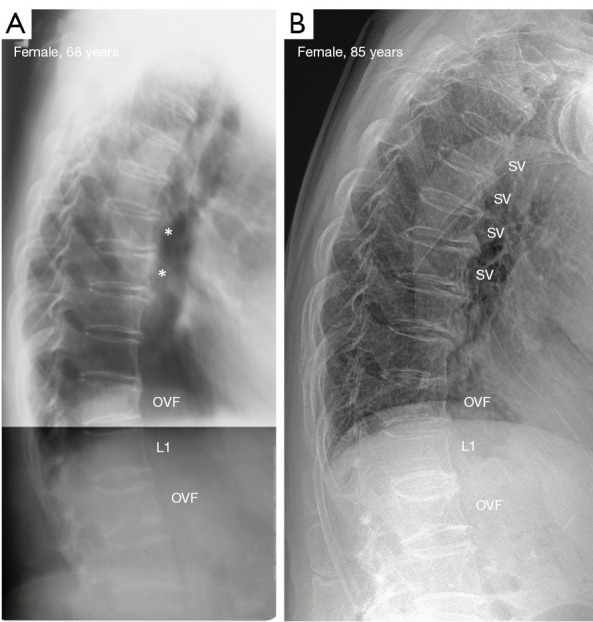
Multiple aSV started from multiple ‘slight degree’ aSV (A) and then progressed in number and severity (B). (A) T8 and T9 faint degree of aSV (*). (B) Follow-up image (17 years later) shows multiple aSV (marked as SV) at the mid- and upper thoracic spine. T12 and L2 had OVF, and no apparent progression is noted for the OVFs during the follow-up. aSV, acquired short vertebrae; OVF, osteoporotic vertebral fracture.
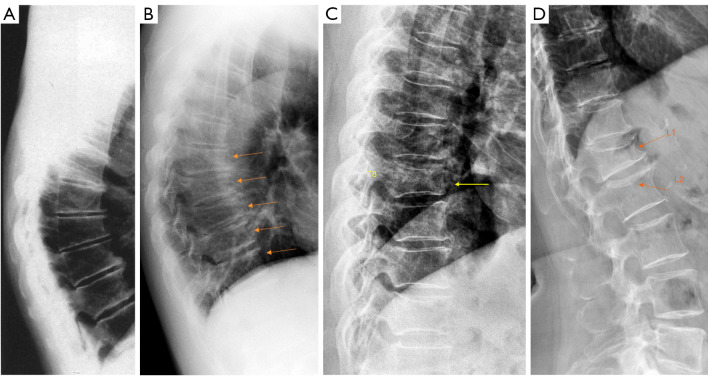
OA wedging and OVF. (A) Spine radiograph of an older woman with OA wedging. Mid-thoracic region shows anterior wedging of multiple vertebrae with similar appearance. Disc space narrowing and osteophytes are noted while without endplate depression. (B) Spine portion of a lateral chest radiograph of a 59-year-old man (a farmer) with OA wedging. Mid-thoracic region shows anterior wedging of multiple vertebrae with similar appearance (arrows), osteophytes are noted. It is considered that there are micro-factures among the involved vertebrae. (C) Spine portion of a lateral chest radiograph of an elderly women, T8 vertebra shows deformity consistent with OVF (arrow). (D) Spine radiograph of an elderly women. L1 vertebra shows deformity consistent with OVF (arrow), while L2 shows upper endplate depression (i.e., endplate fracture) (arrow). (A) is modified from (33); (B) is modified from (11); (C,D) are reused with permission from (1). OA, osteoarthritic; OVF, osteoporotic vertebral fracture.
References
-
- Wáng YXJ, Diacinti D, Yu W, Cheng XG, Nogueira-Barbosa MH, Che-Nordin N, Guglielmi G, Ruiz Santiago F. Semi-quantitative grading and extended semi-quantitative grading for osteoporotic vertebral deformity: a radiographic image database for education and calibration. Ann Transl Med 2020;8:398. 10.21037/atm.2020.02.23 - DOI - PMC - PubMed
Publication types
LinkOut - more resources
Full Text Sources