. 2023 Feb 24;9(3):e13985.
doi: 10.1016/j.heliyon.2023.e13985. eCollection 2023 Mar.

Translational characterization of the temporal dynamics of metabolic dysfunctions in liver, adipose tissue and the gut during diet-induced NASH development in Ldlr-/-.Leiden mice

Affiliations

Translational characterization of the temporal dynamics of metabolic dysfunctions in liver, adipose tissue and the gut during diet-induced NASH development in Ldlr-/-.Leiden mice

Eveline Gart et al. Heliyon. .

Abstract

Background: NAFLD progression, from steatosis to inflammation and fibrosis, results from an interplay of intra- and extrahepatic mechanisms. Disease drivers likely include signals from white adipose tissue (WAT) and gut. However, the temporal dynamics of disease development remain poorly understood.

Methods: High-fat-diet (HFD)-fed Ldlr-/-.Leiden mice were compared to chow-fed controls. At t = 0, 8, 16, 28 and 38w mice were euthanized, and liver, WAT depots and gut were analyzed biochemically, histologically and by lipidomics and transcriptomics together with circulating factors to investigate the sequence of pathogenic events and organ cross-talk during NAFLD development.

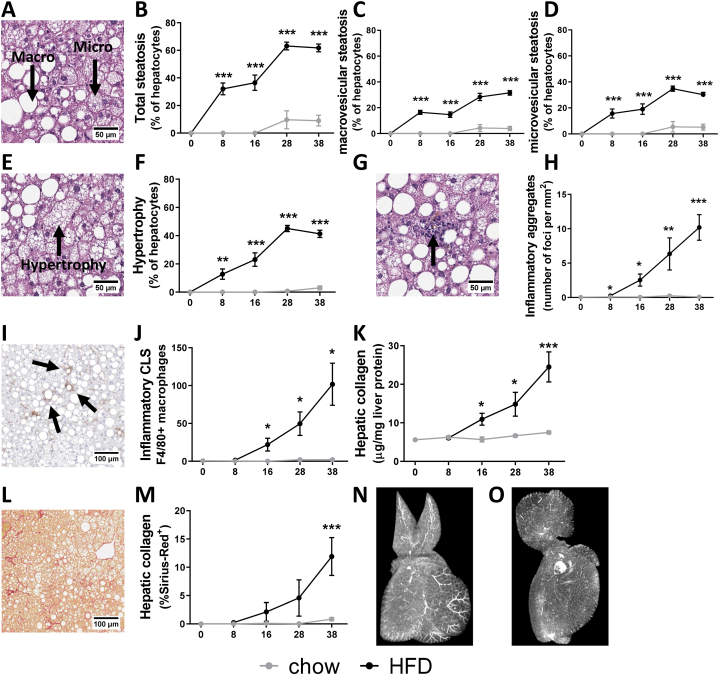
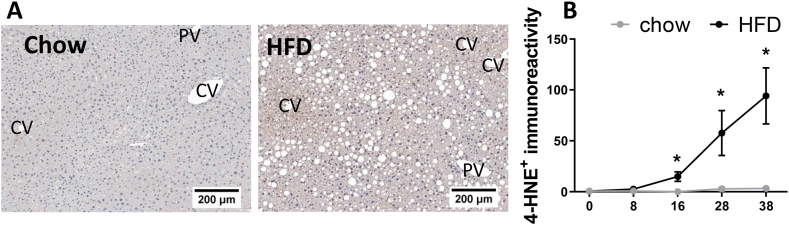
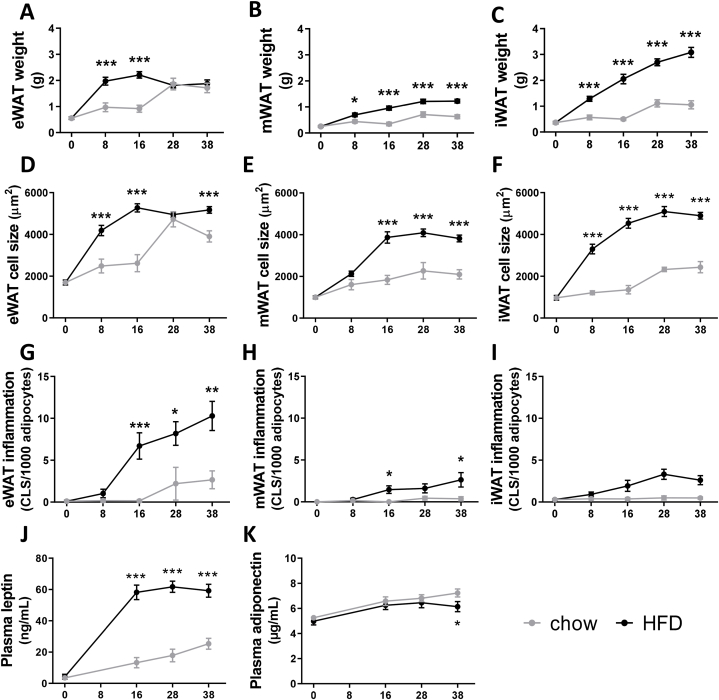
Results: HFD-induced obesity was associated with an increase in visceral fat, plasma lipids and hyperinsulinemia at t = 8w, along with increased liver steatosis and circulating liver damage biomarkers. In parallel, upstream regulator analysis predicted that lipid catabolism regulators were deactivated and lipid synthesis regulators were activated. Subsequently, hepatocyte hypertrophy, oxidative stress and hepatic inflammation developed. Hepatic collagen accumulated from t = 16 w and became pronounced at t = 28-38 w. Epididymal WAT was maximally hypertrophic from t = 8 w, which coincided with inflammation development. Mesenteric and subcutaneous WAT hypertrophy developed slower and did not appear to reach a maximum, with minimal inflammation. In gut, HFD significantly increased permeability, induced a shift in microbiota composition from t = 8 w and changed circulating gut-derived metabolites.

Conclusion: HFD-fed Ldlr-/-.Leiden mice develop obesity, dyslipidemia and insulin resistance, essentially as observed in obese NAFLD patients, underlining their translational value. We demonstrate that marked epididymal-WAT inflammation, and gut permeability and dysbiosis precede the development of NAFLD stressing the importance of a multiple-organ approach in the prevention and treatment of NAFLD.

Keywords: Inter-organ crosstalk; Liver fibrosis; Non-alcoholic fatty liver disease; Oxidative stress; Temporal dynamics.


Conflict of interest statement

The authors declare that they have no known competing financial interests or personal relationships that could have appeared to influence the work reported in this paper.

Figures

Image 1
Graphical abstract
Fig. 1
Fig. 1
Body composition, food intake and systemic metabolic parameters during NAFLD development. Groups of Ldlr−/−. Leiden mice fed a chow or a high-fat (HFD) diet were euthanized over time up to 38 weeks. (A) body weight and caloric food intake, (B) Fat mass and lean mass determined with echoMRI, (C) visceral fat mass is a composite of the visceral epididymal and mesenteric fat mass. In 5-h fasted plasma (D) cholesterol and triglyceride concentrations were determined as well as (E) insulin and glucose in whole blood. Insulin and glucose concentrations were used to calculate the (F) HOMA-IR. Lipoprotein profiles were analyzed in fasting plasma pools (n = 15/grp) and fractionated with FPLC, in the respective fractions (G) cholesterol and (H) triglyceride concentrations were determined at t = 20 and plotted as profiles. (I) plasma apoB concentrations. Circulating liver integrity markers (J) AST and ALT were determined in plasma pools (n ≥ 8/grp). Liver damage markers including (K) CK-18M30 and TIMP1 were analyzed in 5-h fasted plasma. The x-axis indicates the time in weeks and data represent mean ± SEM with * p < 0.05, ** p < 0.01, *** p < 0.001 vs. HFD.
Fig. 2
Fig. 2
Obesity-associated NASH and liver fibrosis development. (A) Illustrative picture of haematoxylin-eosin (HE) stained liver cross sections of HFD-induced NASH and scored for over time development of (B) total steatosis, a sum of (C) macrovesicular steatosis and (D) microvesicular steatosis. In the same HE cross sections (E) hepatocellular hypertrophy was (F) quantified. (G) Illustration of inflammatory aggregates (indicated by arrow) to score (H) hepatic inflammation of mixed inflammatory cell infiltration per mm2, alongside analysis of (I) F4/80 immunoreactivity as marker of macrophages to score (J) inflammatory crown-like structures per cross section. Liver fibrosis was scored biochemically by quantification of (K) collagen content per mg protein and (L) histologically in Sirius-red stained liver cross-sections by (M) quantification of the percentage of Sirius-Red positive area. The x-axis indicates the time in weeks and data are presented as mean ± SEM. * p < 0.05, ** p < 0.01, *** p < 0.001 compared to the chow control group. Representative images from the 3D reconstruction supplemental videos of vascular structures analyzed by Micro-CT are demonstrated for (N) chow and (O) HFD.
Fig. 3
Fig. 3
Hepatic oxidative stress induced lipid peroxidation. (A) Illustrative pictures of 4-HNE with indications for the central veins (CV) and portal veins (PV). (B) 4-HNE quantification. The x-axis indicates the time in weeks and data are presented as mean ± SEM. * p < 0.05 compared to the chow control group.
Fig. 4
Fig. 4
Obesity-associated white adipose tissue dysfunction during NAFLD development. Adiposity scored in visceral (A) epididymal white adipose tissue (eWAT) weight, (B) mesenteric WAT (mWAT), and subcutaneous (C) inguinal WAT (iWAT). Cell morphometry analysis to determine average cell sizes of (D) eWAT, (E) mWAT and (F) iWAT. The number of crown-like structures (CLS) per 1000 adipocytes was scored to determine (G) eWAT inflammation, (H) mWAT inflammation and (I) iWAT inflammation. Circulating adipokine concentrations were determined in 5h-fasted plasma, including (J) leptin and (K) adiponectin. The x-axis indicates the time in weeks and data are presented as mean ± SEM. * p < 0.05, ** p < 0.01, *** p < 0.001 compared to the chow control group.
Fig. 5
Fig. 5
Gut dysbiosis, increased gut permeability and altered circulating microbiota derived metabolites during NAFLD development. Microbiota composition was studied using 16s rRNA gene analysis in the mucosal compartments of both the ileum and colon over time. The microbiota composition was visualized by non-metric multidimensional scaling (NMDS), using the Bray–Curtis index, of the (A) the ileum and (B) colon: every dot represents the microbiota composition of one mouse and the distance between dots represents how (dis)similar the microbiota composition is between these mice. (C) Functional gut permeability was determined using fluorescent labelled dextran’s (FD4 test). The x-axis represents the time in weeks and data are presented as mean ± SEM. * p < 0,05, ** p < 0,01, *** p < 0,001 compared to the chow control group.

References

    1. Loomba R., Friedman S.L., Shulman G.I. Mechanisms and disease consequences of nonalcoholic fatty liver disease. Cell. 2021;184:2537–2564. doi: 10.1016/j.cell.2021.04.015. - DOI - PubMed
    1. Polyzos S.A., Kang E.S., Boutari C., Rhee E.-J., Mantzoros C.S. Current and emerging pharmacological options for the treatment of nonalcoholic steatohepatitis. Metabolism. 2020;111 doi: 10.1016/j.metabol.2020.154203. - DOI - PubMed
    1. van den Hoek A.M., de Jong J.C.B.C., Worms N., van Nieuwkoop A., Voskuilen M., Menke A.L., Lek S., Caspers M.P.M., Verschuren L., Kleemann R. Diet and exercise reduce pre-existing NASH and fibrosis and have additional beneficial effects on the vasculature, adipose tissue and skeletal muscle via organ-crosstalk. Metabolism. 2021;124 doi: 10.1016/J.METABOL.2021.154873. - DOI - PubMed
    1. Gorden D.L., Ivanova P.T., Myers D.S., McIntyre J.O., VanSaun M.N., Wright J.K., Matrisian L.M., Brown H.A. Increased diacylglycerols characterize hepatic lipid changes in progression of human nonalcoholic fatty liver disease; comparison to a murine model. PLoS One. 2011;6 doi: 10.1371/JOURNAL.PONE.0022775. - DOI - PMC - PubMed
    1. Lyu K., Zhang Y., Zhang D., Kahn M., ter Horst K.W., Rodrigues M.R.S., Gaspar R.C., Hirabara S.M., Luukkonen P.K., Lee S., Bhanot S., Rinehart J., Blume N., Rasch M.G., Serlie M.J., Bogan J.S., Cline G.W., Samuel V.T., Shulman G.I. A membrane-bound diacylglycerol species induces pkcε-mediated hepatic insulin resistance. Cell Metabol. 2020;32 doi: 10.1016/J.CMET.2020.08.001. 654-664.e5. - DOI - PMC - PubMed