. 2023 Aug;43(8):1301-1316.
doi: 10.1177/0271678X231161207. Epub 2023 Mar 13.

Therapeutic effect of α 7 nicotinic receptor activation after ischemic stroke in rats

Affiliations

Therapeutic effect of α 7 nicotinic receptor activation after ischemic stroke in rats

Laura Aguado et al. J Cereb Blood Flow Metab. 2023 Aug.

Abstract

Nicotinic acetylcholine α7 receptors (α7 nAChRs) have a well-known modulator effect in neuroinflammation. Yet, the therapeutical effect of α7 nAChRs activation after stroke has been scarcely evaluated to date. The role of α7 nAChRs activation with PHA 568487 on inflammation after brain ischemia was assessed with positron emission tomography (PET) using [18F]DPA-714 and [18F]BR-351 radiotracers after transient middle cerebral artery occlusion (MCAO) in rats. The assessment of brain oedema, blood brain barrier (BBB) disruption and neurofunctional progression after treatment was evaluated with T2 weighted and dynamic contrast-enhanced magnetic resonance imaging (T2 W and DCE-MRI) and neurological evaluation. The activation of α7 nAChRs resulted in a decrease of ischemic lesion, midline displacement and cell neurodegeneration from days 3 to 7 after ischemia. Besides, the treatment with PHA 568487 improved the neurofunctional outcome. Treated ischemic rats showed a significant [18F]DPA-714-PET uptake reduction at day 7 together with a decrease of activated microglia/infiltrated macrophages. Likewise, the activation of α7 receptors displayed an increase of [18F]BR-351-PET signal in ischemic cortical regions, which resulted from the overactivation of MMP-2. Finally, the treatment with PHA 568487 showed a protective effect on BBB disruption and blood brain vessel integrity after cerebral ischemia.

Keywords: Cerebral ischemia; MRI; PET; metalloproteinases; neuroinflammation.


Conflict of interest statement

The author(s) declared no potential conflicts of interest with respect to the research, authorship, and/or publication of this article.

Figures
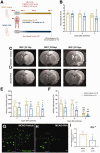
Figure 1.
Figure 1.
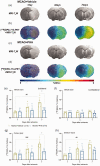
Experimental set-up of the therapeutic evaluation of α7 nicotinic receptor activation and MRI (T2W) images of axial planes at the level of ischemic lesion after cerebral ischemic in vehicle and PHA treated rats (a, c–d). Neurological impairment (b), volume of infarction (e) and midline displacement (f) was evaluated at days 1, 3 and 7 after MCAO in vehicle (n = 12) and PHA-treated (n = 12) rats. Fluoro-Jade positive cells shows degenerative neurons in the ischemic region after MCAO in vehicle (n = 5) and PHA-treated (n = 5) rats (g–i). *p < 0.05, **p < 0.01 and ***p < 0.001 compared with vehicle; #p < 0.05 and ###p < 0.001 compared with day 1; &&p < 0.01 and &&&p < 0.01, compared with day 3. Scale bars, 20 μm. Values are presented as scatter dot blot (mean ± SD).
Figure 2.
Figure 2.
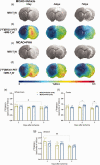
MRI-T2W and PET images of [18F]DPA-714 at days 1, 3 and 7 after MCAO in vehicle and PHA-treated rats. MRI (T2W) (a, c) and TSPO receptor PET signal (b, d) images of axial planes at the level of the ischemic lesion. [18F]DPA-714 PET signal was quantified at days 1, 3 and 7 after ischemia in the entire ipsilateral (e) and contralateral (f) cerebral hemisphere, ipsilateral cortex (g) and striatum (h). *p < 0.05 compared with vehicle; ##p < 0.01 and ###p < 0.001 compared with day 1. Values are presented as scatter dot blot (mean ± SD).
Figure 3.
Figure 3.
Immunofluorescent labeling of TSPO (green), CD11b (red) and DAPI (blue) in the ischemic area, shown as three channels. The data show TSPO expression in microglia/macrophages at day 7 after MCAO in and PHA-treated rats. CD11b-reactive microglia/macrophages (a) expressing TSPO expression (b) decrease after MCAO in PHA-treated rats in merged images of two immunofluorescent antibodies (d). The number of CD11b-reactive microglia/macrophages expressing TSPO was evaluated at day 7 in ipsilateral and contralateral whole brain (e), cortex (f) and striatum (g) after daily treatment with vehicle (n = 5) and PHA (n = 5). **p < 0.01 and ***p < 0.01 compared with vehicle; &&p < 0.01 and &&&p < 0.001 compared with contralateral. Scale bars, 20 μm. Values are presented as scatter dot blot (mean ± SD).
Figure 4.
Figure 4.
MRI-T2W and PET images of [18F]BR-351 at days 1, 3 and 7 after MCAO in vehicle and PHA-treated rats. MRI (T2W) (a, c) and MMP PET signal (b, d) images of axial planes at the level of the ischemic lesion. [18F]BR-351 PET signal was quantified at days 1, 3 and 7 after ischemia in the whole brain (e) cortex (f) and striatum (g). *p < 0.05 compared with vehicle; ##p < 0.05 and ##p < 0.01 compared with day 1; Values are presented as scatter dot blot (mean ± SD).
Figure 5.
Figure 5.
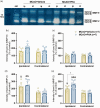
Gelatine zymography of MMP-2/-9 at day 7 after MCAO in vehicle and PHA-treated rats. Activity of a (proenzyme) and b (active form) bands of gelatinases MMP-9/-2 in zymogram shown as white bands in the ipsilateral and contralateral hemispheres after ischemia (a). Intensity of bands a (b, d) and bands b (c, e) of MMP-2/-9 were quantified in both ipsilateral and contralateral hemispheres after MCAO. *p < 0.05 compared with vehicle; &p < 0.05, &&p < 0.01, &&&p < 0.001 compared with contralateral. Values are presented as scatter dot blot (mean ± SD).
Figure 6.
Figure 6.
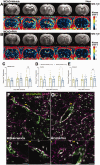
MRI-T2W and DCE-MRI images at day 7 after MCAO in vehicle and PHA-treated rats. MRI axial images show the ischemic lesion and blood brain barrier disruption (BBBd) (Ktrans) at the level of the lesion (a, b). Ktrans was quantified at days 1, 3 and 7 after ischemia in the whole brain (c) cortex (d) and striatum (e). Immunofluorescent merged images of VE-Cadherin (green), GFAP (pink) and DAPI (white) in the ischemic cerebral cortex at day 7 after vehicle (f) and PHA-treated ischemic rats (g). *p < 0.05 compared with vehicle. Scale bars, 20 µm. Values are presented as scatter dot blot (mean ± SD).

References

    1. Gauberti M, Martinez de Lizarrondo S, Vivien D. Thrombolytic strategies for ischemic stroke in the thrombectomy era. J Thromb Haemost 2021; 19: 1618–1628. - PubMed
    1. Chamorro Á, Dirnagl U, Urra X, et al.. Neuroprotection in acute stroke: targeting excitotoxicity, oxidative and nitrosative stress, and inflammation. Lancet Neurol 2016; 15: 869–881. - PubMed
    1. Dagonnier M, Donnan GA, Davis SM, et al.. Acute stroke biomarkers: are we there yet? Front Neurol 2021; 12: 619721. - PMC - PubMed
    1. Martín A, Domercq M, Matute C. Inflammation in stroke: the role of cholinergic, purinergic and glutamatergic signaling. Ther Adv Neurol Disord 2018; 11: 1756286418774267–. - PMC - PubMed
    1. Neumann S, Shields NJ, Balle T, et al.. Innate immunity and inflammation post-stroke: an α7-nicotinic agonist perspective. Int J Mol Sci 2015; 16: 29029–29046. - PMC - PubMed

Publication types

MeSH terms

Substances