Meta-Analysis
. 2023 Mar 14:12:e83364.
doi: 10.7554/eLife.83364.

Reassessment of weak parent-of-origin expression bias shows it rarely exists outside of known imprinted regions

Affiliations
Meta-Analysis

Reassessment of weak parent-of-origin expression bias shows it rarely exists outside of known imprinted regions

Carol A Edwards et al. Elife. .

Abstract

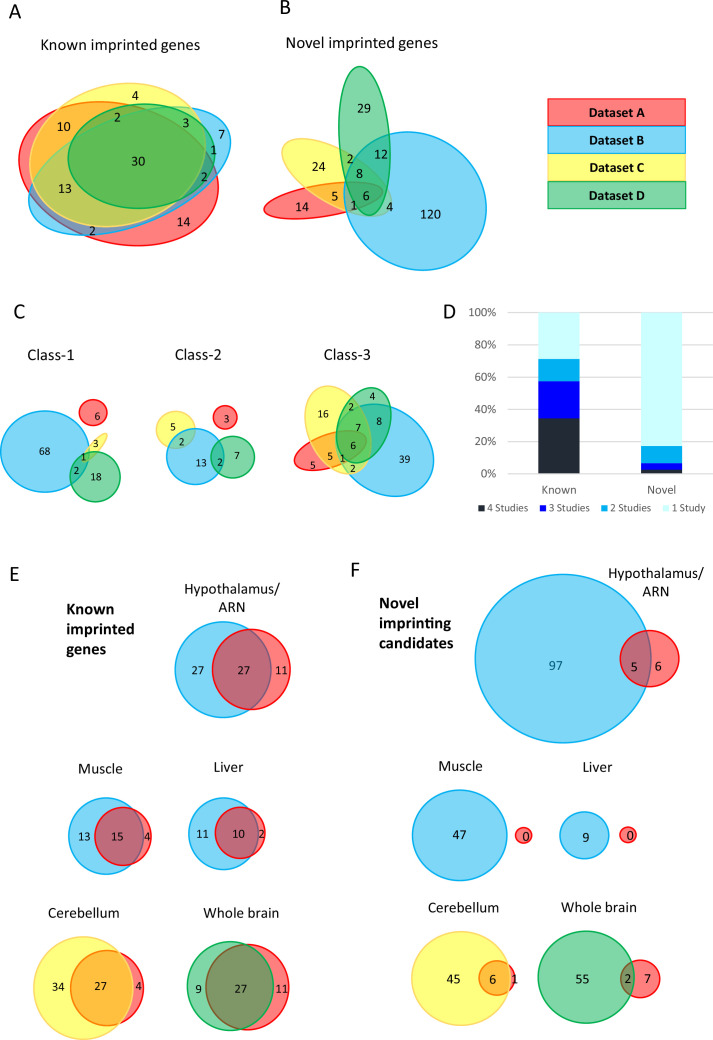
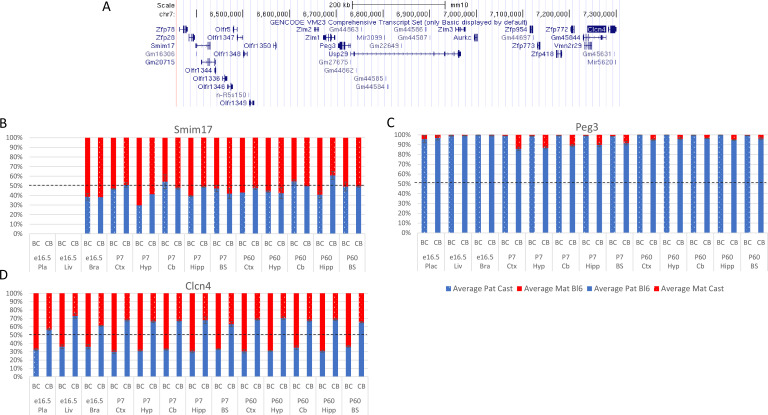
In mouse and human, genes subjected to genomic imprinting have been shown to function in development, behavior, and post-natal adaptations. Failure to correctly imprint genes in human is associated with developmental syndromes, adaptive, and metabolic disorders during life as well as numerous forms of cancer. In recent years researchers have turned to RNA-seq technologies applied to reciprocal hybrid strains of mice to identify novel imprinted genes, causing a threefold increase in genes reported as having a parental origin-specific expression bias. The functional relevance of parental origin-specific expression bias is not fully appreciated especially since many are reported with only minimal parental bias (e.g. 51:49). Here, we present an in-depth meta-analysis of previously generated RNA-seq data and show that the methods used to generate and analyze libraries greatly influence the calling of allele-specific expression. Validation experiments show that most novel genes called with parental-origin-specific allelic bias are artefactual, with the mouse strain contributing a larger effect on expression biases than parental origin. Of the weak novel genes that do validate, most are located at the periphery of known imprinted domains, suggesting they may be affected by local allele- and tissue-specific conformation. Together these findings highlight the need for robust tools, definitions, and validation of putative imprinted genes to provide meaningful information within imprinting databases and to understand the functional and mechanistic implications of the process.

Keywords: epigenetics; gene expression; genetics; genomics; imprinting; mouse.


Conflict of interest statement

CE, WW, ST, LH, RH, AF No competing interests declared

Figures

Figure 1.
Figure 1.. limited overlap between novel genes identified in the four studies.
(A–B) Euler diagrams showing the overlap of (A) - known imprinted genes and (B) – novel biased genes between the four studies. (C) – overlaps between different classes of novel genes. Class-1 = novel singletons >1 Mb from another gene identified in any of the studies. Class-2 = novel clusters where two or more novel genes are within 1 Mb of each other but over 1 Mb from a known imprinted gene. Class-3=novel genes are within 1 Mb of a known imprinted gene. (D) - proportion of known and novel genes by number of studies they were identified in. (E–F) Venn diagrams showing tissue-specific overlaps in E - known imprinted genes and F – novel biased genes.
Figure 2.
Figure 2.. Limited overlap between novel genes called by different analysis pipelines.
(A–C) Venn diagrams showing the overlap between allelic biased genes called by our pipeline with the ISoLDE package (gray circles) versus the original studies. A – Dataset A, B - Dataset B, C - Dataset C. Overlapping novel genes are listed to the right. Dataset A only genes called in the hypothalamus, cerebellum, liver, muscle, and whole adult brain were analyzed. (D–G) Venn diagrams showing the overlap between allelic biased genes called by our pipeline from sequence data generated from the same tissue by different studies: liver (D), muscle (E), hypothalamus (F) from Dataset A and Dataset B and cerebellum (G) from Dataset A and Dataset C. (H–I) Venn diagrams of three-way overlap between allelic biased genes called by our pipeline from sequence data from the liver (H) and muscle (I) generated by Dataset A, Dataset B, and Dataset E.
Figure 2—figure supplement 1.
Figure 2—figure supplement 1.. Expression levels of genes called as biased in at least one of the original studies.
Data generated from re-analysis of original RNA-seq datasets. To allow for comparison across the different datasets, expression levels are reported as mean TPM (transcripts per million) from all biological replicates. Source data is in Supplementary file 1f. Samples: Dataset A - whole adult brain, cerebellum (cb) hypothalamus (hypo) liver, muscle. Dataset B - arcuate nucleus (ARN), dorsal raphe nucleus (DRN), liver, and muscle. Dataset C - P8 and P60 cerebellum.
Figure 2—figure supplement 2.
Figure 2—figure supplement 2.. Overlapping underdetermined genes called between Dataset B (A) and Dataset C (B) and ISoLDE pipeline.
Number of ISoLDE called genes are in pale gray, and overlaps with original study are in dark gray. Overlapping genes are listed to the right. Genes in red were flagged by ISoLDE and genes in bold were validated by pyrosequencing.
Figure 3.
Figure 3.. Weakly biased Class-3 genes are preferentially expressed from the chromosome carrying the germline methylation mark.
(A) Distribution of biased genes by maximum reported bias. Class-1 = novel singletons >1 Mb from another gene identified in any of the studies. Class-2 = novel clusters where two or more novel genes within 1 Mb of each other but over 1 Mb from a known imprinted gene. Class-3 = novel genes are within 1 Mb of a known imprinted gene. (B) – Distribution of biased genes by preferential parental chromosome and maximum reported bias. Genes preferentially expressed from the maternal chromosome are shown in red, paternal chromosome in blue, and preferentially expressed from both chromosomes in a tissue-specific manner in gray. (C) - Distribution of known and Class-3 genes by the methylation status of the imprinting control region (ICR) on the preferentially expressed allele. Genes preferentially expressed from the Meth-ICR chromosome are shown in black, Un-ICR chromosome in pale-gray, and preferentially expressed from both chromosomes in a tissue-specific manner in dark-gray. (D) – Heap maps of DNA methylation (fetal and six week male frontal cortex Shen et al., 2012; Sloan et al., 2016) and Histone H3 lysine 27 trimethylation (E16 and P0 forebrain Gorkin et al., 2017; Shen et al., 2012) over the promoters of known and Class-3 novel genes. Promoters are defined as 500 bp upstream of the transcription factor binding site. Genes are sorted by maximum reported bias and methylation status of the ICR on the preferentially expressed allele. Source data for the figure can be found in Supplementary file 1h.
Figure 4.
Figure 4.. Weakly biased Class-3 genes are located at the periphery of known imprinted domains.
(A) – Distribution of Class-3 biased genes in relation to known imprinted genes. Genes flanked by known imprinted genes are shown in turquoise and those peripheral to known imprinted genes are shown in green.(B) – Sunburst graph of a relationship between position in cluster, the extent of bias, and ICR methylation in Class-3 genes. Low bias = <70% expression from preferential chromosome, high bias = >70% expression from the preferential chromosome. Preferential expression from the methylated imprinting control region (ICR) chromosome is shown in black, preferential expression from the unmethylated ICR chromosome is shown in gray, and genes reported as being biased on both chromosomes depending on tissue or study are shown in red. (C and D) – Schematics of the Snrpn (C) and Dlk1 (D) regions. Highly biased novel genes (80–100%) are located between known imprinted transcripts whereas low-biased genes (50–70%) are located at the periphery. Red boxes = known maternally expressed genes. Blue boxes = known paternally expressed genes. Pink boxes = novel maternally biased genes called by original studies. Turquoise boxes = novel paternally biased genes called by original studies. Blue arrow = cluster of imprinted MBII snoRNAs. Turquoise arrow Mir344 cluster. (E) – Allele-specific expression analysis in peripheral genes in the Dlk1 region in IG-DMR knockout mice. Female mice, heterozygous for IG-DMR knockout were crossed with male CastEiJ mice, and expression was assessed by pyrosequencing. Wildtype (n=5) and maternal heterozygote (n=6) expression biases were compared using an unpaired t-test ** p <0.01 * p < 0.5.
Figure 5.
Figure 5.. Experimentally validated Class-1 and Class-2 genes.
(A) – Nhlrc1 (Class-1) is paternally biased in all postnatal neuronal tissues tested. (B-C) Bisulfite sequencing analysis in P7 tissues.(B) – Cerebellum, (C)- Liver. Each line represents a different clone of bisulfite sequencing derived from two BxC animals and two CxB animals. Numbers of identical clones sequenced are indicated to the right. Black = methylated CpG and Gray = unmethylated CpG, white = CpG absent from clone. Percentage of methylated CpGs from all clones is indicated underneath.(D) – Pcdhb12 (Class-2) is maternally biased in all postnatal tissues tested. (E) – Three Class-2 genes show a maternal bias in e16.5 placenta: Vat1, Pla2g16, and Rtn3. These biases are weaker than seen in Ampd3 which is imprinted in the placenta (Schulz et al., 2006). Allele-specific expression graphs (A, D and E) show mean expression (%) from the paternal allele (deep blue) and maternal allele (red) in C57BL/6 × CastEiJ (BC) and four CastEiJ × C57BL/6 (CB) crosses. Castaneus allele is denoted by a spotted pattern. Standard error of the mean is shown n=3 or 4. Data are normalized to gDNA.
Figure 5—figure supplement 1.
Figure 5—figure supplement 1.. Coro1c pseudogene is almost exclusively expressed from the castaneus allele.
(A) Nhlrc1 expression bias in P6 cerebellum and liver which were also used for bisulfite sequencing analysis. (B) Allelic balance of expression of Coro1c pseudogene that overlaps the Nhlrc1 DMR. Graph shows mean expression (%) from the paternal allele (blue) and maternal allele (red). C57BL/6 × CastEiJ (BC) and CastEiJ × C57BL/6 (CB) crosses. Castaneus allele is denoted by a spotted pattern. Standard error of the mean is shown, n=2 for Nhlrc1 and 3 for Coro1c pseudogene.
Figure 5—figure supplement 2.
Figure 5—figure supplement 2.. Allelic bias in Wnk4 novel cluster.
(A) Weak bias in Wnk4 gene. (B) location of genes in the novel cluster, (C) location of gDMRs, and antisense transcript. Graph shows mean expression (%) from the paternal allele (blue) and maternal allele (red) C57BL/6 × CastEiJ (BC) and four CastEiJ × C57BL/6 (CB) crosses. Castaneus allele is denoted by a spotted pattern. Standard error of the mean is shown, n=3 or 4. Data are normalized to gDNA.
Figure 5—figure supplement 3.
Figure 5—figure supplement 3.. Expression levels of genes tested by allele-specific pyrosequencing.
Data are extracted from Supplementary file 1f. Genes that were only validated in the placenta were counted as unvalidated and the two known placental-specific imprinted genes are not included in the figure. Expression levels were reported as the mean transcripts per million (TPM) across all biological replicates. Samples: Dataset A - whole adult brain, cerebellum (cb) hypothalamus (hypo) liver, muscle. Dataset B - arcuate nucleus (ARN), dorsal raphe nucleus (DRN), liver, and muscle. Dataset C - P8 and P60 cerebellum. The original study the genes were reported as biased is noted on the y-axis – A=Dataset A, B=Dataset B, C=Dataset C, and D=Dataset D.
Figure 6.
Figure 6.. Allele-specific expression analysis of the Dlk1 domain.
(A–F) Allelic bias in Evl (A), Slc25a29 (B), Wars (C) Wdr24 (D) Dlk1 (E), and Dync1h1 (F) Graphs show mean expression (%) from the paternal allele (blue) and maternal allele (red) C57BL/6 × CastEiJ (BC) and four CastEiJ × C57BL/6 (CB) crosses. Castaneus allele is denoted by a spotted pattern. Standard error of the mean is shown, n=3 or 4. Tissues with a mean bias greater than 45:55 are indicated by arrow heads. Amplification bias was assessed in genomic DNA and the data are corrected. (G) – Imprinting of Slc25a29 in e15.5 placenta is not under the control of the IG-DMR. WT (BC) = maternal allele is wildtype for the IG-DMR paternal allele is CastEiJ (n=5). Mat_Het = maternal allele has IG-DMR deletion and the paternal allele is CastEiJ (n=6). WT (CB)=paternal allele is wildtype for the IG-DMR maternal allele is CastEiJ (n=5). Pat_Het = Paternal allele has IG-DMR deletion and the maternal allele is CastEiJ (n=7). (H) Schematic of the validated expression data in the Dlk1 region. Red boxes = known maternally expressed genes. Blue boxes = known paternally expressed genes. Pink boxes = novel validated maternally biased genes. Turquoise boxes = novel validated paternally biased genes. Gray boxes = biallelically expressed genes.
Figure 6—figure supplement 1.
Figure 6—figure supplement 1.. Allelic bias in the Mcts2 region.
(A) Mcts2 imprinted region. (B–E) Allelic bias (%) in Mcts2 (A), Cox4i2 (B), Bcl2l1 (C) , and Tpx2 (D). Graphs show mean expression (%) from the paternal allele (blue) and maternal allele (red) C57BL/6 × CastEiJ (BC) and four CastEiJ × C57BL/6 (CB) crosses. Castaneus allele is denoted by a spotted pattern. Standard error of the mean is shown, n=3 or 4. Data are normalized to gDNA.
Figure 6—figure supplement 2.
Figure 6—figure supplement 2.. Allelic bias (%) in Adam23 (A), Ifitm10 (B), and Ago2 (C).
Graphs show mean expression (%) from the paternal allele (blue) and maternal allele (red) C57BL/6 × CastEiJ (BC) and four CastEiJ × C57BL/6 (CB) crosses. Castaneus allele is denoted by a spotted pattern. Standard error of the mean is shown, n=3 or 4. Adam23 and Iftim10 data are normalized for an amplification bias in gDNA. Data are normalized to gDNA.
Figure 6—figure supplement 3.
Figure 6—figure supplement 3.. Allelic bias in Peg3 region.
(A) Peg3 imprinted region. (B–D) Allelic bias (%) in Smim17 (A), Peg3 (B), and Clcn4 (C). Graphs show mean expression (%) from the paternal allele (blue) and maternal allele (red) C57BL/6 x CastEiJ (BC) and four CastEiJ × C57BL/6 (CB) crosses. Castaneus allele is denoted by a spotted pattern. Standard error of the mean is shown, n=3 or 4. Clcn4 data are normalized for an amplification bias in gDNA. Data are normalized to gDNA.
Figure 7.
Figure 7.. Possible mechanisms behind parent-of-origin expression biases in tissues.
(A-D) Scenarios causing biased expression in heterogenous cell populations: bias occurs in every cell in the tissue (A), random imprinting in the subset of cells (B), cell-type specific imprinting (C) or random monoallelic expression that is skewed towards one allele (D). (E-H) Possible Mechanisms behind parent-of-origin biases at the periphery of imprinted domains.

Update of

  • doi: 10.1101/2022.08.21.504536

References

    1. Andergassen D, Dotter CP, Wenzel D, Sigl V, Bammer PC, Muckenhuber M, Mayer D, Kulinski TM, Theussl H-C, Penninger JM, Bock C, Barlow DP, Pauler FM, Hudson QJ. Mapping the mouse Allelome reveals tissue-specific regulation of allelic expression. eLife. 2017;6:e25125. doi: 10.7554/eLife.25125. - DOI - PMC - PubMed
    1. Babak T, Deveale B, Armour C, Raymond C, Cleary MA, van der Kooy D, Johnson JM, Lim LP. Global survey of genomic imprinting by transcriptome sequencing. Current Biology. 2008;18:1735–1741. doi: 10.1016/j.cub.2008.09.044. - DOI - PubMed
    1. Babak T, DeVeale B, Tsang EK, Zhou Y, Li X, Smith KS, Kukurba KR, Zhang R, Li JB, van der Kooy D, Montgomery SB, Fraser HB. Genetic conflict reflected in tissue-specific maps of genomic imprinting in human and mouse. Nature Genetics. 2015;47:544–549. doi: 10.1038/ng.3274. - DOI - PMC - PubMed
    1. Bonthuis PJ, Huang W-C, Stacher Hörndli CN, Ferris E, Cheng T, Gregg C. Noncanonical genomic imprinting effects in offspring. Cell Reports. 2015;12:979–991. doi: 10.1016/j.celrep.2015.07.017. - DOI - PubMed
    1. Cleaton MAM, Edwards CA, Ferguson-Smith AC. Phenotypic outcomes of imprinted gene models in mice: elucidation of pre- and postnatal functions of imprinted genes. Annual Review of Genomics and Human Genetics. 2014;15:93–126. doi: 10.1146/annurev-genom-091212-153441. - DOI - PubMed

Publication types