

Depth-resolved attenuation mapping of the human ovary and fallopian tube using optical coherence tomography
- PMID: 36916760
- PMCID: PMC10656701
- DOI: 10.1002/jbio.202300002
Depth-resolved attenuation mapping of the human ovary and fallopian tube using optical coherence tomography
Abstract
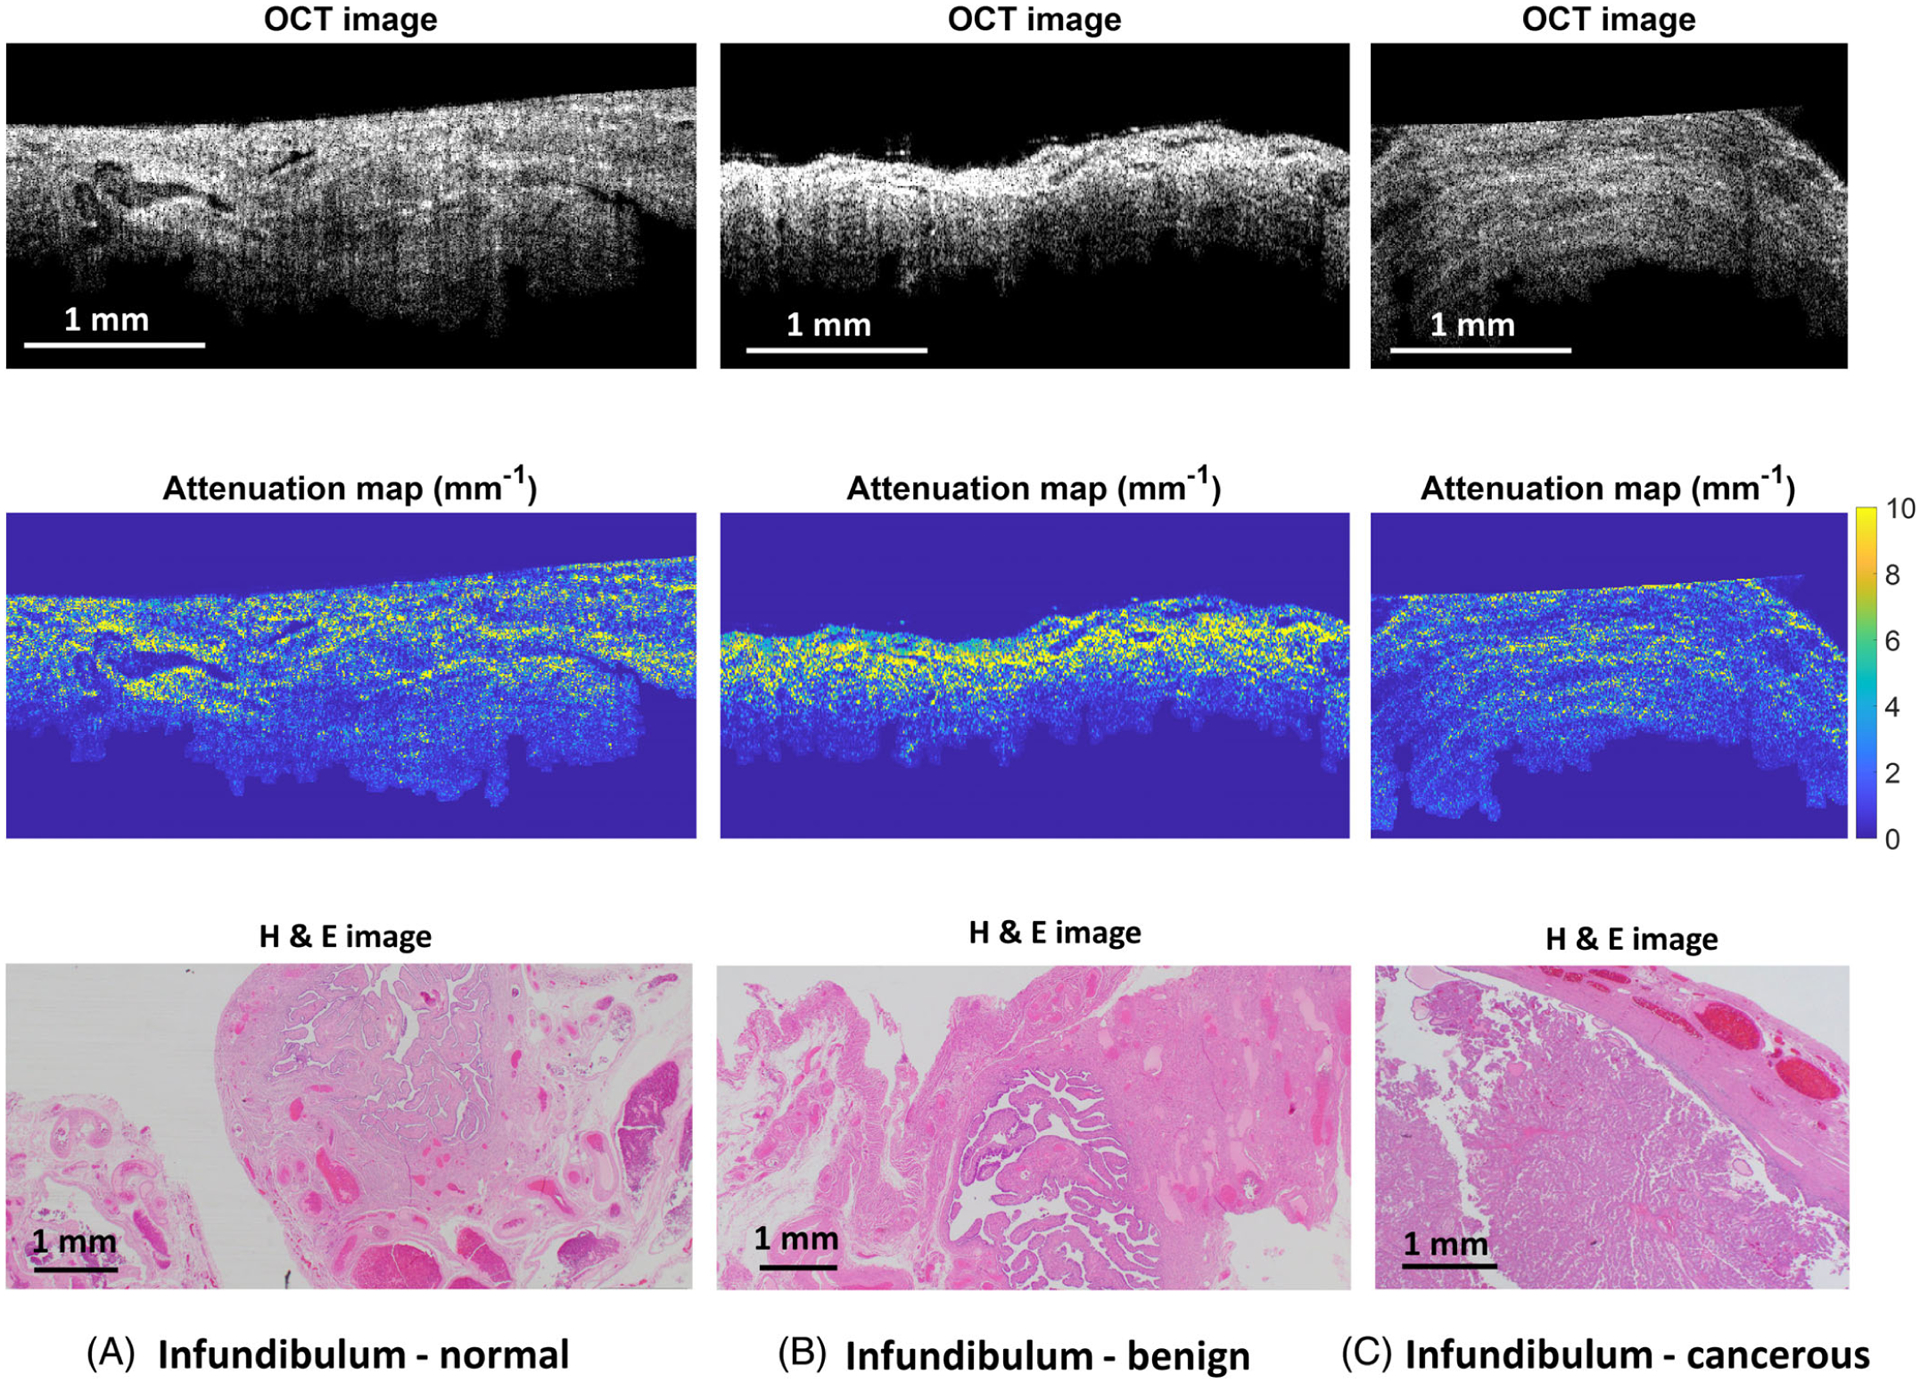
Due to the lack of reliable early-diagnostic tools, most ovarian cancers are diagnosed at late stages. Although optical coherence tomography (OCT) has shown promise for identifying diseased ovaries and fallopian tubes at an earlier stage, previous studies either did not provide quantitative scattering mapping or simply used Beer's law to fit the scattering coefficients of each A-line. In this paper, we calculated the pixel-wise attenuation coefficients of ovaries and fallopian tubes in OCT images. Data from 73 freshly excised human ovaries and fallopian tubes from 36 patients have shown that statistical features are statistically different between cancerous ovaries, infundibula, and fimbriae and normal ones.
Keywords: OCT; cancer assessment; depth-resolved attenuation; fallopian tube; ovary.
© 2023 Wiley-VCH GmbH.
Conflict of interest statement
FUNDING INFORMATION
The authors declare no financial conflict of interest.
CONFLICT OF INTEREST STATEMENT
The authors declare no conflict of interest.
Figures


References
-
- Stott W, Ultrasound Obstet. Gynecol 2018, 52, 286. - PubMed
Publication types
MeSH terms
Grants and funding
LinkOut - more resources
Full Text Sources
Medical
