

How to Critically Appraise and Interpret Systematic Reviews and Meta-Analyses of Diagnostic Accuracy: A User Guide
- PMID: 36916896
- PMCID: PMC10140638
- DOI: 10.1148/radiol.221437
How to Critically Appraise and Interpret Systematic Reviews and Meta-Analyses of Diagnostic Accuracy: A User Guide
Abstract
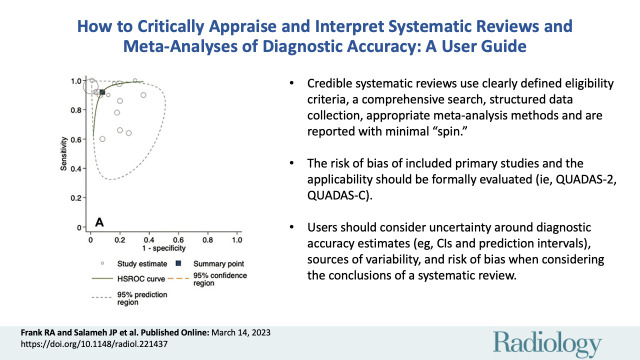
Systematic reviews of diagnostic accuracy studies can provide the best available evidence to inform decisions regarding the use of a diagnostic test. In this guide, the authors provide a practical approach for clinicians to appraise diagnostic accuracy systematic reviews and apply their results to patient care. The first step is to identify an appropriate systematic review with a research question matching the clinical scenario. The user should evaluate the rigor of the review methods to evaluate its credibility (Did the review use clearly defined eligibility criteria, a comprehensive search strategy, structured data collection, risk of bias and applicability appraisal, and appropriate meta-analysis methods?). If the review is credible, the next step is to decide whether the diagnostic performance is adequate for clinical use (Do sensitivity and specificity estimates exceed the threshold that makes them useful in clinical practice? Are these estimates sufficiently precise? Is variability in the estimates of diagnostic accuracy across studies explained?). Diagnostic accuracy systematic reviews that are judged to be credible and provide diagnostic accuracy estimates with sufficient certainty and relevance are the most useful to inform patient care. This review discusses comparative, noncomparative, and emerging approaches to systematic reviews of diagnostic accuracy using a clinical scenario and examples based on recent publications.
© RSNA, 2023.
Conflict of interest statement
Figures

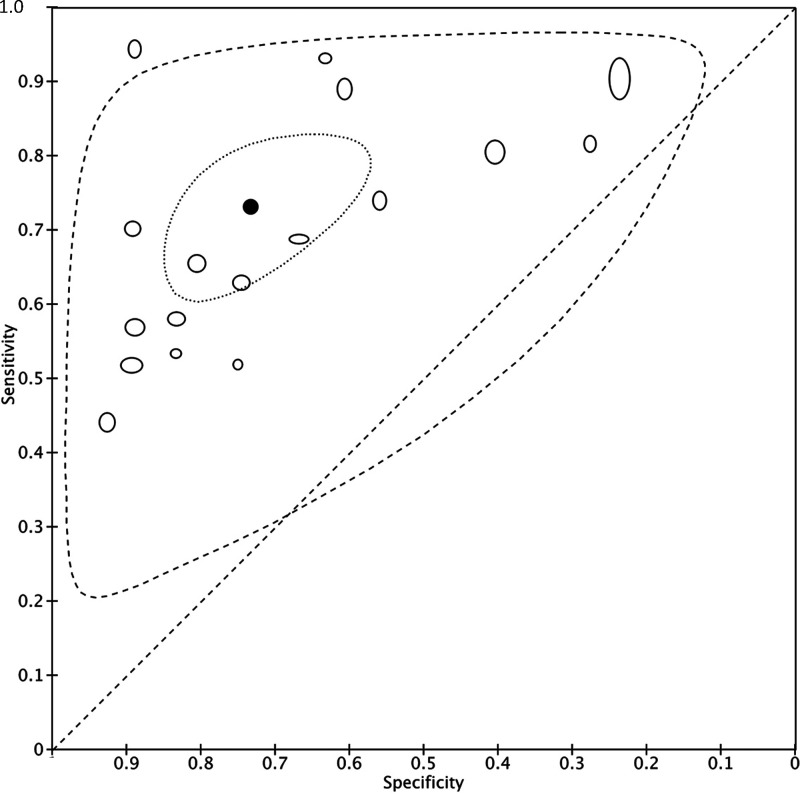
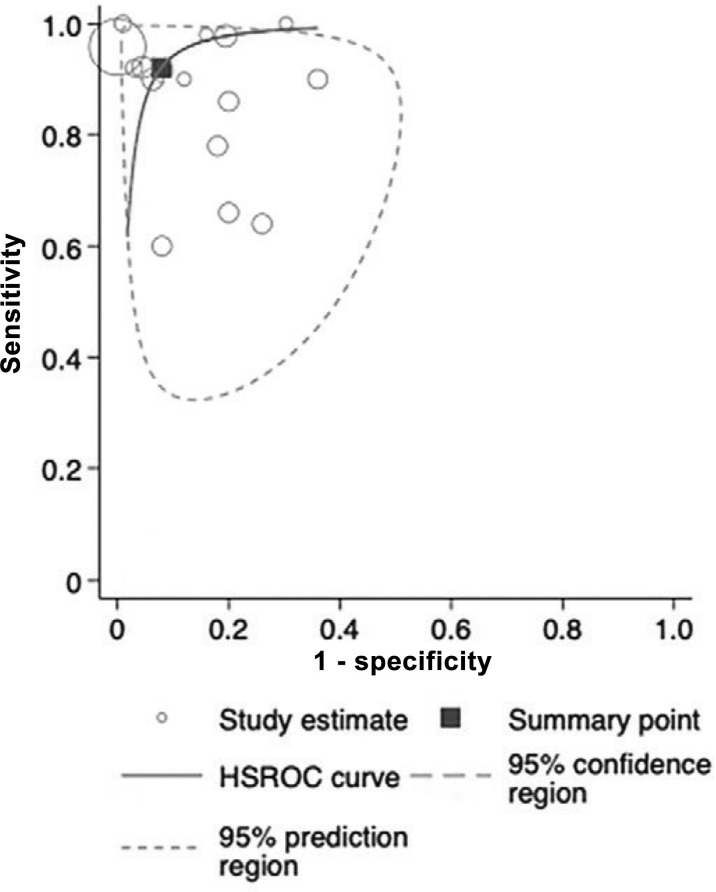
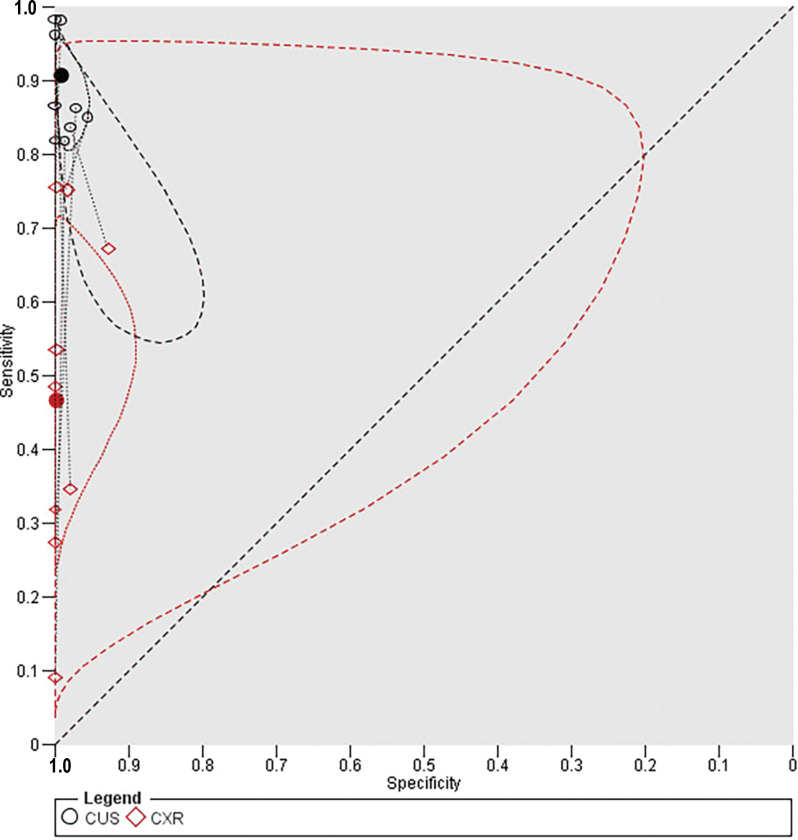
![Examples of summary receiver operating characteristic (ROC) plots.
Published data from Duke et al (24) were re-analyzed by fitting a bivariate
meta-analysis using the lme4 package in R (The R Foundation for Statistical
Computing) (3) to obtain a (A) summary point and a (B) summary curve. Figures
were generated using RevMan software. The open circles represent accuracy
estimates for included primary studies, with the position relative to the y-axis
representing the sensitivity and the position relative to the x-axis
representing the false-positive rate (1 − specificity). Individual study
points are weighted using sample size. In A, the position of the solid black
circle in ROC space represents the summary estimate of sensitivity and
specificity (sensitivity = 0.965 [95% CI: 0.948, 0.977]; specificity = 0.967
[95% CI: 0.949, 0.979]). The dashed circle represents the 95% prediction region,
and the dotted line represents the 95% confidence region. In B, the solid line
represents the hierarchical summary ROC curve. The dashed line denotes an
uninformative ROC curve. Points along this curve correspond to where sensitivity
= 1 − specificity (ie, the true- and false-positive rates are
equal).](https://cdn.ncbi.nlm.nih.gov/pmc/blobs/568f/10140638/d0dd722d1874/radiol.221437.fig3.jpg)
Similar articles
-
The future of Cochrane Neonatal.Early Hum Dev. 2020 Nov;150:105191. doi: 10.1016/j.earlhumdev.2020.105191. Epub 2020 Sep 12. Early Hum Dev. 2020. PMID: 33036834
-
Diagnostic test accuracy: methods for systematic review and meta-analysis.Int J Evid Based Healthc. 2015 Sep;13(3):154-62. doi: 10.1097/XEB.0000000000000061. Int J Evid Based Healthc. 2015. PMID: 26355602
-
A methodological review of how heterogeneity has been examined in systematic reviews of diagnostic test accuracy.Health Technol Assess. 2005 Mar;9(12):1-113, iii. doi: 10.3310/hta9120. Health Technol Assess. 2005. PMID: 15774235 Review.
-
How to read a systematic review and meta-analysis and apply the results to patient care: users' guides to the medical literature.JAMA. 2014 Jul;312(2):171-9. doi: 10.1001/jama.2014.5559. JAMA. 2014. PMID: 25005654
-
Critical Appraisal of a Systematic Review: A Concise Review.Crit Care Med. 2022 Sep 1;50(9):1371-1379. doi: 10.1097/CCM.0000000000005602. Epub 2022 Jul 18. Crit Care Med. 2022. PMID: 35853198 Review.
Cited by
-
SSR white paper: guidelines for utilization and performance of direct MR arthrography.Skeletal Radiol. 2024 Feb;53(2):209-244. doi: 10.1007/s00256-023-04420-6. Epub 2023 Aug 11. Skeletal Radiol. 2024. PMID: 37566148 Free PMC article. Review.
-
Global view of haematolymphoid tumor classifications and their application in low- and middle-income countries.Histopathology. 2025 Jan;86(1):6-16. doi: 10.1111/his.15340. Epub 2024 Oct 17. Histopathology. 2025. PMID: 39420576 Review.
References
-
- Salameh JP , Bossuyt PM , McGrath TA , et al. . Preferred reporting items for systematic review and meta-analysis of diagnostic test accuracy studies (PRISMA-DTA): explanation, elaboration, and checklist . BMJ 2020. ; 370 : m2632 . - PubMed
-
- Frank RA , McInnes MDF , Levine D , et al. . Are Study and Journal Characteristics Reliable Indicators of “Truth” in Imaging Research? Radiology 2018. ; 287 ( 1 ): 215 – 223 . - PubMed
-
- Higgins JPT , Thomas J . Chandler J , et al. , eds. Cochrane Handbook for Systematic Reviews of Interventions version 6.0 . (updated July 2019). Cochrane, 2019. https://training.cochrane.org/handbook .
-
- Patsopoulos NA , Analatos AA , Ioannidis JP . Relative citation impact of various study designs in the health sciences . JAMA 2005. ; 293 ( 19 ): 2362 – 2366 . - PubMed
Publication types
MeSH terms
LinkOut - more resources
Full Text Sources
