. 2023 Jun;114(6):2400-2413.
doi: 10.1111/cas.15785. Epub 2023 Apr 18.

TIP60 is required for tumorigenesis in non-small cell lung cancer

Affiliations

TIP60 is required for tumorigenesis in non-small cell lung cancer

Daisuke Shibahara et al. Cancer Sci. 2023 Jun.

Abstract

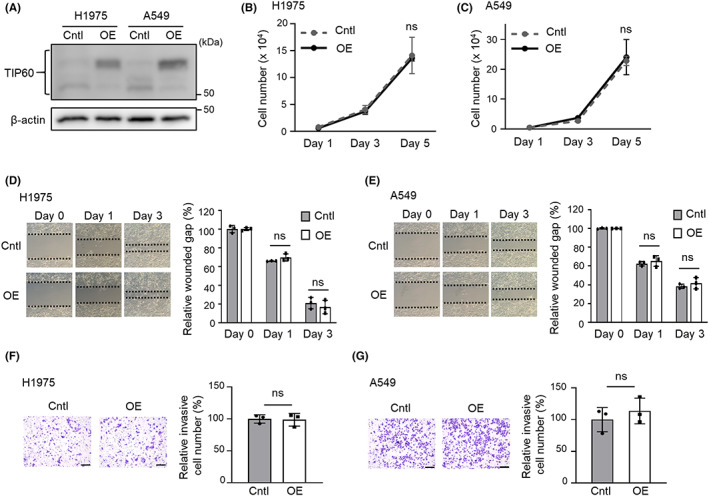
Histone modifications play crucial roles in transcriptional activation, and aberrant epigenetic changes are associated with oncogenesis. Lysine (K) acetyltransferases 5 (TIP60, also known as KAT5) is reportedly implicated in cancer development and maintenance, although its function in lung cancer remains controversial. Here we demonstrate that TIP60 knockdown in non-small cell lung cancer cell lines decreased tumor cell growth, migration, and invasion. Furthermore, analysis of a mouse lung cancer model with lung-specific conditional Tip60 knockout revealed suppressed tumor formation relative to controls, but no apparent effects on normal lung homeostasis. RNA-seq and ChIP-seq analyses of inducible TIP60 knockdown H1975 cells relative to controls revealed transglutaminase enzyme (TGM5) as downstream of TIP60. Investigation of a connectivity map database identified several candidate compounds that decrease TIP60 mRNA, one that suppressed tumor growth in cell culture and in vivo. In addition, TH1834, a TIP60 acetyltransferase inhibitor, showed comparable antitumor effects in cell culture and in vivo. Taken together, suppression of TIP60 activity shows tumor-specific efficacy against lung cancer, with no overt effect on normal tissues. Our work suggests that targeting TIP60 could be a promising approach to treating lung cancer.

Keywords: KAT5; TGM5; TIP60; artemisinin; lung cancer.


Conflict of interest statement

SSK reports research support from Boehringer Ingelheim, Johnson & Johnson, MiRXES, and Taiho Therapeutics, as well as personal fees (honoraria) from Boehringer Ingelheim, Bristol Meyers Squibb, and Takeda Pharmaceuticals, all outside the submitted work. HW reports a personal fee (honorarium) from AstraZeneca outside the submitted work. DBC reports receiving consulting fees and honoraria from Takeda/Millennium Pharmaceuticals, AstraZeneca, Pfizer, Blueprint Medicines, and Janssen, institutional research support from Takeda/Millennium Pharmaceuticals, AstraZeneca, Pfizer, Merck Sharp and Dohme, Merrimack Pharmaceuticals, Bristol Myers Squibb, Clovis Oncology, Spectrum Pharmaceuticals, Tesaro and Daiichi Sankyo, and consulting fees from Teladoc and Grand Rounds by Included Health, all outside the submitted work. No other conflict of interest is reported.

Figures

FIGURE 1
FIGURE 1
TIP60 is expressed at lower levels in lung cancer lines and clinical lung tumor tissues than in normal. (A) TIP60 expression in various human tissues in the GTEx dataset. Expression values are shown as transcripts per million (TPM) and presented as a violin plot for each tissue type. Violin plots are shown as median and 25th and 75th percentiles; points are displayed as outliers if they are above or below 1.5 times the interquartile range. (B) Immunoblot showing four TIP60 splice variant isoforms at varying levels in several lung cancer lines and in the immortalized normal alveolar cell line (BEAS‐2B). Isoforms 2 and 3 are also known as the α form and β form, respectively. Immunoblot data are representative of three independent experiments. (C) Comparative analysis of TCGA adenocarcinoma dataset showing lower TIP60 expression in lung tumor (n = 517) than in normal lung tissues (n = 59). Boxes show medians with upper and lower quartiles, and whiskers represent minimum and maximum values. For comparative analysis, the p‐value was calculated using the unpaired two‐tailed Welch's t‐test.
FIGURE 2
FIGURE 2
TIP60 overexpression does not alter tumor progression. (A) Immunoblot showing TIP60 overexpression efficiency in H1975 and A549 cells. Cntl; mock‐transfected cells, OE; TIP60‐overexpressing cells. Blots show representative images. (B, C) Cell growth assay in control or H1975 (B) and A549 (C)‐OE cells. Data are the mean ± SD of triplicates from one experiment and are representative of three independent experiments. (D, E) Wound healing assay showing no significant difference in migration activities between TIP60 OE H1975 (D) and A549 (E) cells versus the corresponding control cells. Images of wounded cell monolayers are representative of three independent experiments. Data are the mean ± SD of triplicates from one experiment and are representative of three independent experiments. (F, G) Transwell invasion assay showing no significant difference in invasion activities between TIP60 OE H1975 (F) and A549 (G) cells versus corresponding control cells. Images of invasive cells are representative of two independent experiments. Data are the mean ± SD of three invasive cell number/field from one experiment and are representative of two independent experiments. Scale bars: 200 μm. The p‐value was calculated using the unpaired two‐tailed Welch's t‐test. ns; not significant.
FIGURE 3
FIGURE 3
TIP60 knockdown inhibits tumor growth, migration, and invasion activities. (A, B) Immunoblot showing TIP60 knockdown efficiency in H1975 (A) or A549 (B) shTIP60‐1 and shTIP60‐2 cells. After 72 h of doxycycline treatment (0.5 μg/mL), proteins were subjected to immunoblot. All blots show representative images. (C, D) TIP60 knockdown inhibits cell growth in H1975 (C) or A549 (D) shTIP60‐2 cells. Cell numbers were determined on days 1, 3, and 5 after doxycycline (0.5 μg/mL) addition. Data are the mean ± SD of triplicates from one experiment and are representative of three independent experiments. (E, F) H1975 (E) or A549 (F) shTIP60‐2 cells show a decreased migration compared with the control cells. Wound gaps (day 0) were made after 24 h of doxycycline treatment and overnight serum starvation. Images of wounded cell monolayers are representative of three independent experiments. Data are the mean ± SD of triplicates from one experiment and are representative of three independent experiments. (G, H) Transwell invasion assay showing significant difference in invasion activities between H1975 (G) or A549 (H) shTIP60‐2 cells versus the corresponding control cells. Images of invasive cells are representative of three independent experiments. Data are the mean ± SD of three invasive cell number/field from one experiment and are representative of three independent experiments. Scale bars: 200 μm. The p‐value was calculated using the unpaired two‐tailed Welch's t‐test. *p < 0.05. ns; not significant.
FIGURE 4
FIGURE 4
Tip60 knockout lung cancer model mice show no tumor formation in the lung. (A) PCR of genomic DNA to confirm the genotypes of homozygous Tip60 knockout (F/F), heterozygous Tip60 knockout (F/wt), or wild‐type (wt/wt) mice, as well as the EGFR transgene: I, CCSP‐rtTA/Cre/Tip60 F/wt , II, EGFR TL /CCSP‐rtTA/Cre/Tip60 wt/wt , III, EGFR TL /CCSP‐rtTA/Cre/Tip60 F/wt , and IV, EGFR TL /CCSP‐rtTA/Cre/Tip60 F/F . (B, C) Appearance and weight of lungs in each mouse group: I (n = 14), II (n = 13), III (n = 24), IV (n = 14). Data are the mean ± SD. The p‐value was calculated using one‐way ANOVA followed by the Tukey–Kramer multiple‐comparison test. **p < 0.005. ns; not significant. (D, E) Hematoxylin and eosin staining (D) and magnetic resonance imaging (E) in mouse groups indicated above. Note that no tumors are seen in Tip60 knockout mice. Images are representative, and white arrows indicate tumors. Scale bars: 200 μm.
FIGURE 5
FIGURE 5
TGM5 is a candidate gene downstream of TIP60 and may contribute to tumor progression. (A, B) Scatter plots (A) and number of DEGs (B) showing that, relative to control cells, H1975‐shTIP60‐1, and shTIP60‐2 cells exhibit a greater number of downregulated than upregulated genes. (C) Hierarchical clustering analysis of DEGs showing consistent expression changes in pairwise comparisons of H1975 shTIP60‐1 and shTIP60‐2 cells relative to control cells. (D) Venn diagram showing numbers of differential genes between ChIP‐seq (pink circle) and RNA‐seq (blue circle). In total, 13 genes were identified as overlapping. (E) ChIP‐seq signals at the TGM5 gene locus showing decreased enrichment for H4 acetylation in shTIP60‐1 and shTIP60‐2 relative to control cells (in a blue rectangle). (F) Kaplan–Meier survival analysis of lung adenocarcinoma showing poor prognosis of patients in the TGM5 high expression group. Data were extrapolated from TCGA. The p‐value was determined using the log‐rank test. (G) Immunoblot showing efficacy of siTIP60 knockdown or TIP60 overexpression and changes of TGM5 expression in H1975 and A549 cells. Cells were transiently transfected with TIP60 siRNA or control siRNA for 72 h and then immunoblotted. All blots show representative images, and analysis of TGM5/β‐actin was calculated using ImageJ software. (H, I) qPCR (H) and immunoblot (I) showing efficacy of TGM5 knockdown by siRNA in H1975 cells. H1975 cells were transfected with siRNA pools specific for TGM5 mRNA or non‐targeting control for 72 h, and then subjected to qPCR and immunoblot. qPCR data are the mean ± SD of triplicates from one experiment and are representative of three independent experiments. Blots show representative images, and analysis of TGM5/β‐actin was calculated using ImageJ software. (J) Cell growth assay of H1975 TGM5 knockdown or control cells. (K, L) Wound healing assay showing suppressed migration of H1975 TGM5 knockdown compared with control cells. Wound gaps (day 0) were made after transfection with TGM5 siRNA. Images of wounded cell monolayers are representative of three independent experiments. Data relevant to relative wound gaps are the mean ± SD of triplicates from one experiment and are representative of three independent experiments. The p‐value was calculated using the unpaired two‐tailed Welch's t‐test. *p < 0.05 and **p < 0.005.
FIGURE 6
FIGURE 6
Artemisinin suppresses tumor progression by downregulating TIP60. (A) Connectivity map of TIP60 showing five compounds ranked by relative scores. (B) Immunoblot showing dose‐dependent TIP60 downregulation by artemisinin treatment. At each concentration, cells were treated for 72 h with artemisinin before proteins were subjected to immunoblot. Blots show representative images, and analysis of TIP60/β‐actin was calculated using ImageJ software. (C) Dose inhibition curves and SDs of artemisinin‐treated H1975, A549, and BEAS‐2B cells. (D) Viability assay showing that artemisinin treatment decreases cell viability. Cells were incubated for 72 h with artemisinin (300 μM) or DMSO (control) prior to determination of cell viability. (E) Immunoblot showing a change in TIP60 and TGM5 expression following artemisinin treatment of control (Cntl) or TIP60 overexpressing (OE) H1975 and A549 cells. Cells were treated 72 h with artemisinin (300 μM) and then immunoblotted. Blots show representative images, and analyses of TIP60/β‐Actin and TGM5/β‐actin were calculated using ImageJ software. (F) Changes in caspase‐3/7 activity following artemisinin treatment of control or H1975 and A549‐OE cells. Cells were incubated for 24 h with artemisinin (300 μM) prior to the analysis of caspase‐3/7 activity, which was normalized to cell number. Data are the mean ± SD of triplicates from one experiment and are representative of two independent experiments. (G, H) Analysis of tumor volume change and tumor volume in mouse xenograft tumor models harboring control or A549‐OE cells. Nude mice bearing A549 Cntl or A549‐OE cells (10 tumors/5 mice per group) were treated with vehicle or artemisinin (200 mg/kg orally once daily) for 28 days. Mice were monitored for changes in tumor volume. Data are presented as the mean percentage change in tumor volume ± SEM. The p‐value was calculated using the unpaired two‐tailed Welch's t‐test. *p < 0.05 and **p < 0.005. ns; not significant.
FIGURE 7
FIGURE 7
TH1834 inhibits tumor progression by downregulating TIP60 enzymatic activity. (A) Immunoblot showing dose‐dependent downregulation of acetylated histone H4 and TGM5 by TH1834 treatment. At each concentration, cells were treated for 48 h with TH1834 before proteins were subjected to immunoblot. Blots show representative images. (B) TH1834 treatment inhibits cell growth in H1975 or A549 cells. Cell numbers were determined on days 1, 3, and 5 after TH1834 (80 μM) or DMSO addition. Data are the mean ± SD of triplicates from one experiment and are representative of three independent experiments. (C, D) Wound healing assay showing suppressed migration of H1975 (C) or A549 (D) cells treated with TH1834 (80 μM) relative to those cells treated with DMSO. Images of wounded cell monolayers are representative of three independent experiments. Data relevant to relative wound gaps are the mean ± SD of triplicates from one experiment and are representative of three independent experiments. (E, F) Transwell invasion assay showing the significant difference in invasion activities between H1975 (E) or A549 (F) cells treated with TH1834 (80 μM) versus the corresponding cells treated with DMSO. Images of invasive cells are representative of three independent experiments. Data relevant to relative invasive cell number are the mean ± SD of three invasive cell number/field from one experiment and are representative of three independent experiments. (G, H) Analysis of tumor volume change (G) and tumor volume (H) in mouse xenograft tumor models harboring A549 cells. Nude mice bearing A549 cells (8–10 tumors/4 or 5 mice per group) were treated with vehicle or TH1834 (10 mg/kg intraperitoneally once daily five times a week) for 21 days. Mice were monitored for changes in tumor volume. Data are presented as the mean percentage change in tumor volume ± SEM. The p‐value was calculated using the unpaired two‐tailed Welch's t‐test. *p < 0.05 and **p < 0.005. ns; not significant.
FIGURE 8
FIGURE 8
Model for the role of TIP60 in lung cancer.

References

    1. Siegel RL, Miller KD, Fuchs HE, Jemal A. Cancer statistics, 2021. CA Cancer J Clin. 2021;71:7‐33. - PubMed
    1. Verdone L, Agricola E, Caserta M, Di Mauro E. Histone acetylation in gene regulation. Brief Funct Genomic Proteomic. 2006;5:209‐221. - PubMed
    1. Sapountzi V, Logan IR, Robson CN. Cellular functions of TIP60. Int J Biochem Cell Biol. 2006;38:1496‐1509. - PubMed
    1. Squatrito M, Gorrini C, Amati B. Tip60 in DNA damage response and growth control: many tricks in one HAT. Trends Cell Biol. 2006;16:433‐442. - PubMed
    1. Tang Y, Luo J, Zhang W, Gu W. Tip60‐dependent acetylation of p53 modulates the decision between cell‐cycle arrest and apoptosis. Mol Cell. 2006;24:827‐839. - PubMed

MeSH terms