

Mitochondrial morphology controls fatty acid utilization by changing CPT1 sensitivity to malonyl-CoA
- PMID: 36917141
- PMCID: PMC10233380
- DOI: 10.15252/embj.2022111901
Mitochondrial morphology controls fatty acid utilization by changing CPT1 sensitivity to malonyl-CoA
Abstract
Changes in mitochondrial morphology are associated with nutrient utilization, but the precise causalities and the underlying mechanisms remain unknown. Here, using cellular models representing a wide variety of mitochondrial shapes, we show a strong linear correlation between mitochondrial fragmentation and increased fatty acid oxidation (FAO) rates. Forced mitochondrial elongation following MFN2 over-expression or DRP1 depletion diminishes FAO, while forced fragmentation upon knockdown or knockout of MFN2 augments FAO as evident from respirometry and metabolic tracing. Remarkably, the genetic induction of fragmentation phenocopies distinct cell type-specific biological functions of enhanced FAO. These include stimulation of gluconeogenesis in hepatocytes, induction of insulin secretion in islet β-cells exposed to fatty acids, and survival of FAO-dependent lymphoma subtypes. We find that fragmentation increases long-chain but not short-chain FAO, identifying carnitine O-palmitoyltransferase 1 (CPT1) as the downstream effector of mitochondrial morphology in regulation of FAO. Mechanistically, we determined that fragmentation reduces malonyl-CoA inhibition of CPT1, while elongation increases CPT1 sensitivity to malonyl-CoA inhibition. Overall, these findings underscore a physiologic role for fragmentation as a mechanism whereby cellular fuel preference and FAO capacity are determined.
Keywords: CPT1; fatty acid oxidation; fission; fusion; mitochondrial dynamics.
© 2023 The Authors. Published under the terms of the CC BY 4.0 license.
Conflict of interest statement
O.S.S is a co‐founder and SAB member of Enspire Bio LLC, Senergy‐Bio and Capacity‐Bio, and when this study was conducted, he was serving as a consultant to LUCA‐Science, IMEL, Epirium, Johnson & Johnson, Pfizer, and Stealth Biotherapeutics. M.L. is a co‐founder of Enspire Bio LLC.
Figures
- A
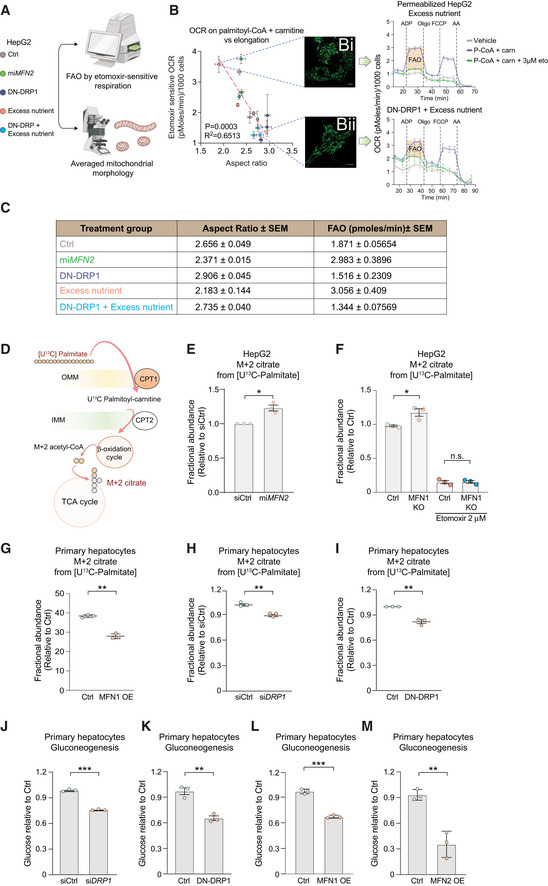
Experimental design to assess the relationship between FAO and mitochondrial morphology in HepG2 cells.
- B
Quantification of correlation between mitochondrial length (aspect ratio, AR) and FAO. FAO was determined based on etomoxir‐sensitive OCR stimulated by palmitoyl‐CoA and carnitine in permeabilized HepG2 cells in the presence of ADP. n = 3 biological replicates with 6 technical replicates. AR data are from n = 3 independent biological replicates. For each condition, the mean from 20 to 50 cells analyzed per experiment are indicated. Representative confocal TMRE images of mitochondria and OCR traces are shown for cells cultured in excess nutrient conditions in the absence (Bi) or presence of DN‐DRP1 (Bii). Vehicle denotes an absence of substrates. Scale bar in (Bi, Bii): 10 μm. Data represent means ± SEM.
- C
Mean values of mitochondrial AR and FAO capacity from independent biological replicates and aggregated values across the indicated experimental conditions measured as in (B). Data represent means ± SEM, n = 3, t‐test.
- D
Schematic of stable isotope tracing analysis to measure FAO using [U‐13C16] palmitate.
- E–I
Fractional abundance of m + 2 citrate from [U‐13C16] palmitate following forced mitochondrial fragmentation in miMFN2 (E) and MFN1 KO HepG2 cells (F) or following forced mitochondrial elongation via MFN1 OE (G), siDRP1 (H) or DN‐DRP1 (I) in primary hepatocytes. Data represent means ± SEM, n = 3 independent biological replicates, t‐test. *P < 0.05, **P < 0.01.
- J–M
Gluconeogenesis assessed by glucose production in response to lactate and pyruvate in primary mouse hepatocytes following DRP1 knockdown (J), expression of DN‐DRP1 (K), MFN1 OE (L), or MFN2 OE (M). Data represent means ± SD, n = 3 independent biological replicates, t‐test. **P < 0.01, ***P < 0.001.
- A
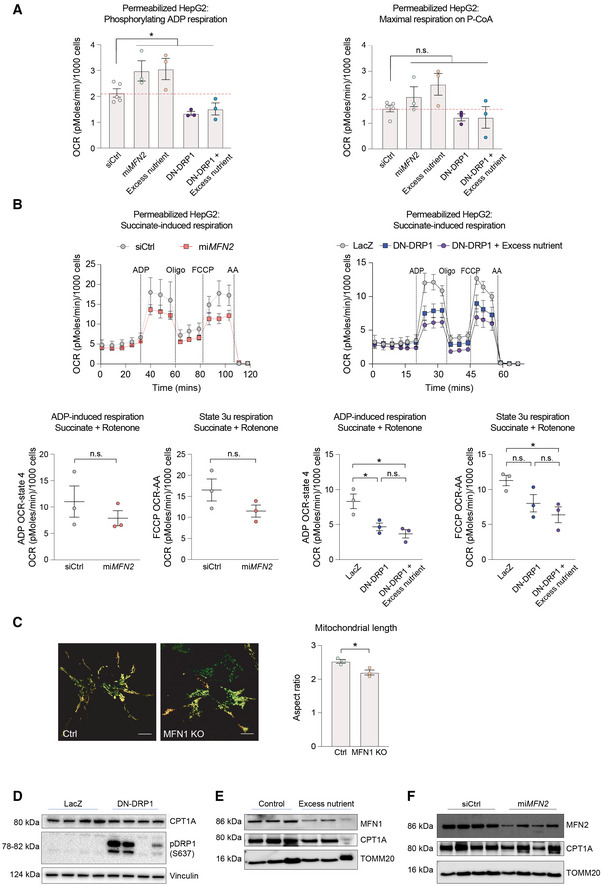
Quantification of phosphorylating ADP and maximal respiration induced by palmitoyl‐CoA in permeabilized HepG2 cells. n = 5 independent biological replicates for siCtrl and n = 3 independent biological replicates with six technical repeats for all other perturbations. Data represent means ± SEM, t‐test. *P < 0.05.
- B
Succinate‐induced respiration in permeabilized HepG2 cells. n = 3 biological replicates with six technical repeats. Data represent means ± SEM, t‐test. *P < 0.05.
- C
Representative images of MFN1 KO HepG2 cells and quantification of mitochondrial length. Scale bar: 10 μm. Data represent means ± SEM, n = 3, t‐test. *P < 0.05.
- D–F
Quantification of CPT1 protein expression in HepG2 cells following expression of DN‐DRP1 (D), excess nutrient treatment (E), or miMFN2 (F).
- A
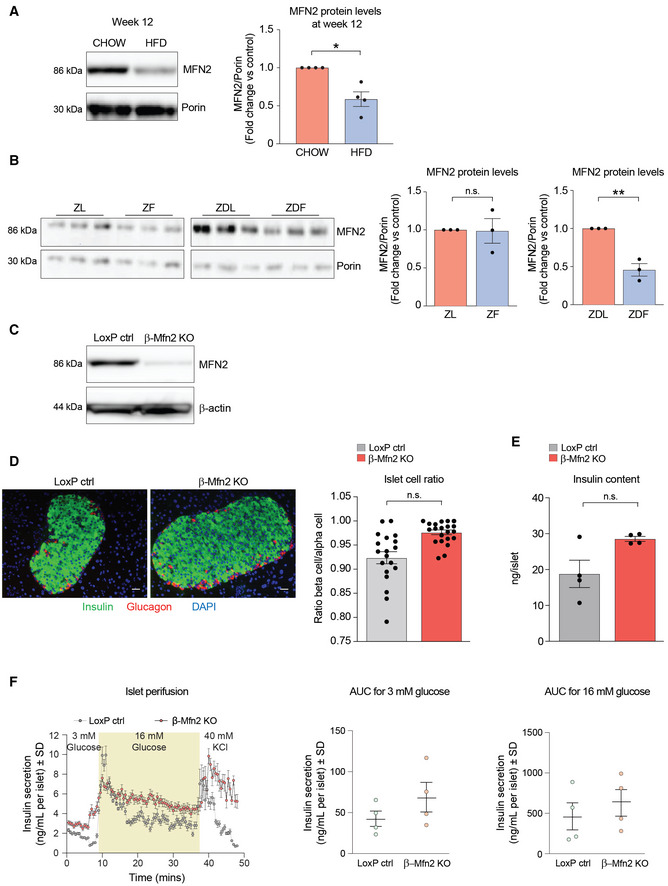
Representative western blot showing MFN2 protein levels in islets derived from n = 4 male C57BL/6J mice fed on CHOW or HFD for 12 weeks. Porin serves as loading control. Immunoblots were quantified by ImageJ. Data represent means ± SEM t‐test. *P < 0.05.
- B
MFN2 protein levels in islets derived from 8‐week‐old Zucker Lean (ZL), Zucker Fatty (ZF), Zucker Diabetic Lean (ZDL), and Zucker Diabetic Fatty (ZDF) rats. The ZF rat is a model of human obesity displaying phenotypes of hyperlipidemia and hypertension. The ZDF rat models diabetes, displaying hyperglycemia, hyperlipidemia, and hypertension although the ZDF rat strain are less obese than the ZF, they are more insulin resistant. The ZDL rat model is hyperglycemic but not hyperlipidemic. Islet protein lysates were analyzed from n = 3 rats per group and immunoblots were quantified using ImageJ. Data represent means ± SEM t‐test. **P < 0.01. n.s, nonsignificant.
- C
Validation of Mfn2 deletion in β‐Mfn2KO islets by western blot analysis compared to control LoxP islets with β‐actin serving as loading control. Any residual MFN2 protein in islet lysates is attributed to non‐β‐cell types in β‐Mfn2KO islets.
- D
Representative images of immunohistochemical analyses of pancreatic sections from LoxP control and β‐Mfn2KO mice, where β‐ and α‐cells are stained with anti‐insulin (green) and anti‐glucagon (red) antibodies, respectively. Nuclei are stained with DAPI (blue). A total of 45 sections (LoxP control n = 21 and β‐Mfn2KO mice n = 24) were similarly analyzed and images were subsequently quantified for ratios of β‐ to α‐cells in the two genotypes, t‐test. n.s, nonsignificant. Scale bar: 75 μm.
- E
Insulin content in LoxP control and β‐Mfn2KO islets derived from n = 4 mice per group; technical replicates of six islets from each animal are shown. Data represent means ± SEM, t‐test. n.s, nonsignificant.
- F
Quantification of dynamic insulin secretion in islet perifusion assays using LoxP control and β‐Mfn2KO islets derived from n = 4 mice per group. β‐Mfn2KO islets show a slow rising first phase secretion that remains significantly higher during the exposure to high glucose, whereas the normal response of an islet at high glucose is a sharp peak that eventually decreases to basal levels. Subsequent exposure to 40 mM KCl caused a similar excursion in insulin secretion in both genetic groups, although β‐Mfn2KO islets continued to secrete at a higher rate, overall confirming the changes in insulin secretory behavior seen in static incubation assays in Fig 2G. Data represent means ± SD, AUC denotes area under the curve.
- A
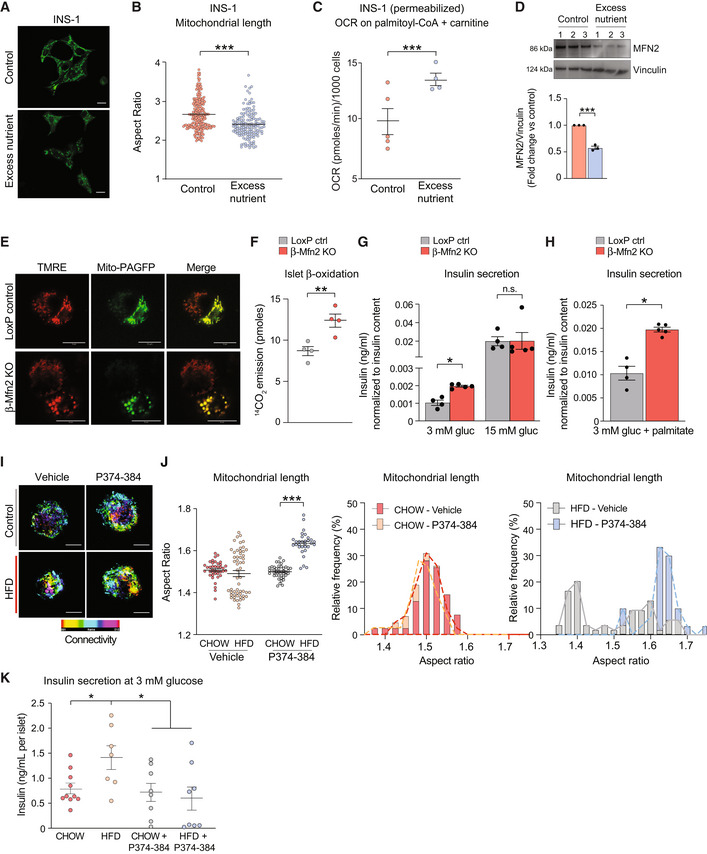
Representative confocal images of mitochondria in INS‐1 cells cultured under control or excess nutrient conditions (20 mM glucose and 0.4 mM palmitate) and subsequently stained with MitoTracker Green (green). Scale bar: 10 μm.
- B
Quantification of mitochondrial length by aspect ratio in INS‐1 cells under control and excess nutrient conditions as in (A). Data represent means ± SEM, n = 219 cells from control and n = 148 cells from excess nutrient condition were analyzed, t‐test. ***P < 0.001.
- C
FAO assessed by OCR stimulated by palmitoyl‐CoA and carnitine in permeabilized INS‐1 in the presence of ADP. Data represent means ± SEM, n = 4 independent biological replicates (six technical replicates each n), t‐test. ***P < 0.001.
- D
MFN2 protein levels in INS‐1 cells cultured under control and excess nutrient conditions as in (A) assessed by western blotting. Vinculin serves as loading control. Protein lysates from n = 3 experiments were analyzed and quantified by ImageJ, data represent means ± SEM, t‐test. ***P < 0.001.
- E
Representative confocal images of β‐cells (GFP positive) and non‐β‐cells (GFP negative) in dispersed islets from LoxP control and β‐Mfn2KO mice. Mitochondria are labeled with TMRE (red) and mito‐PAGFP (green) driven by the insulin promoter. Mitochondrial fragmentation is only evident in the β‐Mfn2KO samples. Scale bar: 10 μm.
- F
FAO (β‐oxidation) in LoxP control and β‐Mfn2KO islets assessed by 14C‐CO2 production from 14C‐U‐labeled palmitate. Data represent means ± SEM, n = 4 mice per genotype with 100 islets analyzed per condition in each experiment. Data represent means ± SEM, t‐test. **P < 0.01.
- G
Averaged insulin secretion values at nonstimulatory (3 mM) and stimulatory (15 mM) glucose concentrations in LoxP control and β‐Mfn2KO islets derived from n = 4 and n = 5 mice, respectively. Data represent means ± SEM, t‐test. *P < 0.05. n.s, nonsignificant.
- H
Fatty acid‐stimulated insulin secretion in LoxP control and β‐Mfn2KO islets derived from n = 4 and n = 5 mice and stimulated with 0.4 mM palmitate and 3 mM glucose. Data represent means ± SEM, t‐test. *P < 0.05.
- I
Confocal images of mitochondria in dispersed islets from CHOW‐ or HFD‐fed mice with or without the MFN2 agonist peptide MFN2‐TAT‐P374‐384 (P374‐384) to increase mitochondrial fusion (connectivity). Mitochondria are stained with GPR75 and connectivity and length are presented as maximum projections. Scale bar: 10 μm.
- J
Quantification and distribution of mitochondrial length in response to vehicle or P374‐384 treatment of all islets derived from n = 4 CHOW‐ or HFD‐fed mice. Vehicle data are from n = 39 CHOW islets and n = 55 HFD islets. P374‐384 data are from n = 55 CHOW islets and n = 31 HFD islets. Data in the panel on the left represent means ± SEM, t‐test. ***P < 0.001.
- K
Insulin secretion at nonstimulatory glucose concentrations in islets derived from n = 4 CHOW‐ or HFD‐fed wild‐type mice and subsequently treated with P374‐384. Data represent means ± SEM with 2–3 islets analyzed per mouse in each treatment group, t‐test. *P < 0.05.
- A
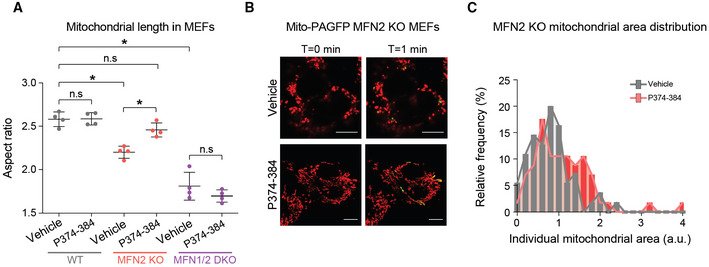
Quantification of mitochondrial length in response to P374‐384 treatment in mouse embryonic fibroblasts (MEFs) from the indicated genotypes. Data represent means ± SEM, n = 4 independent experiments with 30–50 cells analyzed per experiment, t‐test. *P < 0.05, n.s, nonsignificant.
- B
Representative confocal images of mitochondria in MFN2 KO MEFs treated with vehicle or P374‐384 and labeled with TMRE (red) and mito‐PAGFP (green). Enhanced fusion was identified by 2‐photon‐mediated photoconversion of PAGFP. Scale bar: 10 μm.
- C
Quantification of mitochondrial area in MFN2 KO MEFs treated with vehicle (gray) or P374‐384 (red). Data are from n = 4 independent experiments with 30–50 cells analyzed per experiment.
- A
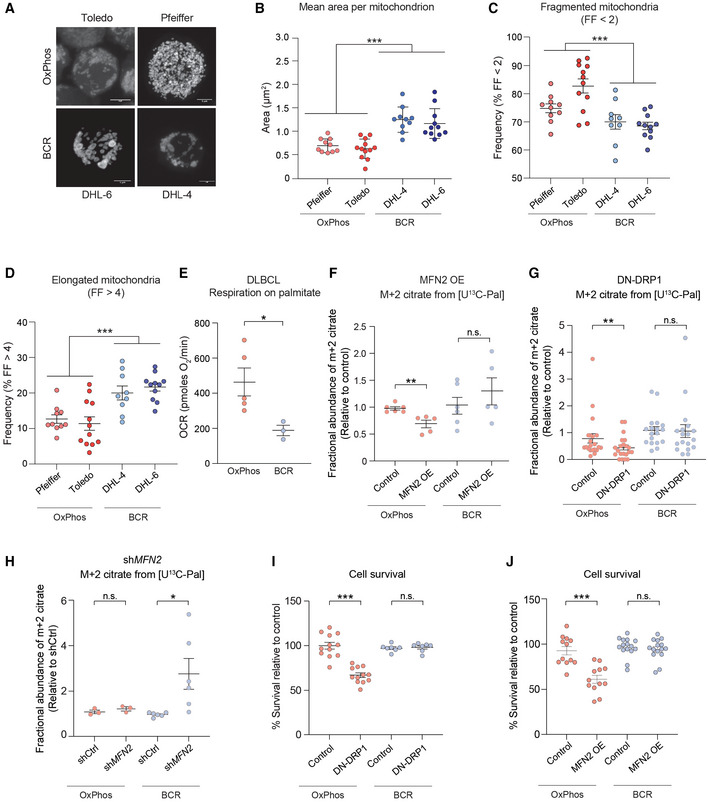
Representative 3D reconstructed images of OxPhos‐DLBCL (Toldeo and Pfeiffer) and BCR‐DLBCL (DHL‐6 and DHL‐4) cell lines labeled with MitoTracker Green. Scale bar: 10 μm.
- B
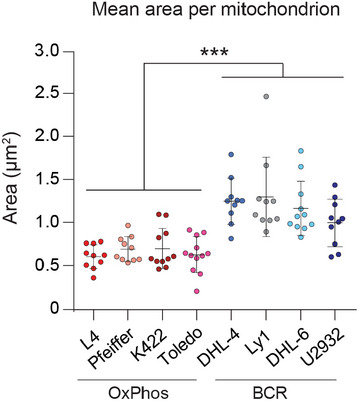
Average area of individual mitochondria in OxPhos‐ (red) and BCR‐DLBCL (blue) cell lines labeled as in (A). Data represent means ± SEM with n = 10–12 cells analyzed per cell line, unpaired t‐test with Welch's correction. ***P < 0.001.
- C
Frequency of fragmented mitochondria as defined by a form factor (FF) of < 2 in cells from the same experiments as in (A) and (B). Data represent means ± SEM with n = 10–12 cells analyzed per cell line, unpaired t‐test with Welch's correction. ***P < 0.001.
- D
Frequency of elongated mitochondria as defined by a form factor (FF) of > 4 in cells from the same experiments as above (A) and (B). Data represent means ± SEM with n = 10–12 cells analyzed per cell line, unpaired t‐test with Welch's correction. ***P < 0.001.
- E
Palmitate‐induced OCR in DLBCL cell lines. Individual data points are from n = 5 and n = 3 independent cell lines per OxPhos‐ and BCR‐DLBCL subtypes, respectively. Data represent means ± SEM, t‐test. *P < 0.05.
- F–H
Fractional abundance of m + 2 citrate from [U‐13C16] palmitate in OxPhos‐ and BCDR‐DLBCL subtypes following forced mitochondrial elongation in response to MFN2 OE (F) or DN‐DRP1 (G) and following forced mitochondrial fragmentation by MFN2 knockdown (H). Data represent means ± SEM and are cumulative data points from multiple individual experiments using independent cell lines for each DLBCL subtype as follows: n = 6 independent biological replicates in (F) using two independent cell lines per each DLBCL subtype, n = 21 independent biological replicates in (G) using five independent OxPhos‐ and four independent BCR‐DLBCL cell lines, n = 3–6 independent biological replicates in (H) using three independent OxPhos‐ and two independent BCR‐DLBCL cell lines, t‐test. *P < 0.05, **P < 0.01, n.s, nonsignificant.
- I, J
Cell viability in OxPhos‐ and BCR‐DLBCLs expressing DN‐DRP1 (I) or MFN2 (J). Data represent means ± SEM from four independent OxPhos‐DLBCL cell lines in triplicate and 4–5 independent BCR‐DLBCL cell lines in duplicate (I) or triplicate (J), t‐test. ***P < 0.001, n.s, nonsignificant.
- A
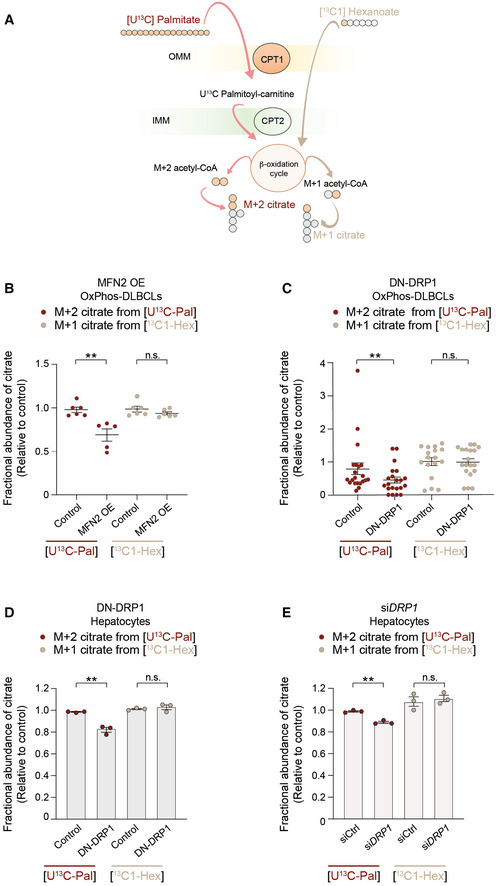
Schematic representation of an isotope tracing strategy to distinguish long‐chain versus short‐chain FAO [U‐13C16] palmitate and [13C1] hexanoate, respectively.
- B, C
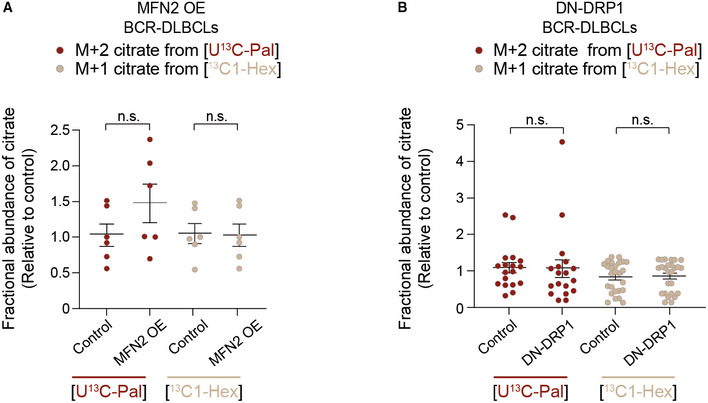
Fractional abundance of m + 2 citrate from [U‐13C16] palmitate (LCFAO) compared with m + 1 citrate from [13C1] hexanoate (SCFAO) following forced mitochondrial elongation by MFN OE (B) or DN‐DRP1 (C) in OxPhos‐DLBCLs. Data represent means ± SEM and are cumulative data points from multiple individual experiments using independent cell lines as follows: n = 5–6 independent biological replicates in (B) using two independent OxPhos‐DLBCL cell lines, n = 17–21 independent biological replicates in (C) using five independent OxPhos‐DLBCL cell lines, t‐test. **P < 0.01, n.s, nonsignificant. The [U‐13C16] palmitate arm of these experiments is the same as shown in Fig 3F and G.
- D, E
Fractional abundance of m + 2 citrate from [U‐13C16] palmitate (LCFAO) compared with m + 1 citrate from [13C1] hexanoate (SCFAO) following forced mitochondrial elongation by DN‐DRP1 (D) or DRP1 knockdown (E) in primary hepatocytes. Data represent means ± SEM, n = 3 mice, t‐test. **P < 0.01, n.s, nonsignificant.
- A, B
Fractional abundance of m + 2 citrate from [U‐13C16] palmitate (LCFAO) compared with m + 1 citrate from [13C1] hexanoate (SCFAO) following forced mitochondrial elongation by MFN OE (A) or DN‐DRP1 (B) in BCR‐DLBCLs. Data represent means ± SEM and are cumulative data points from multiple individual experiments using independent cell lines as follows: n = 3–4 individual experiments in (A) using two independent BCR‐DLBCL cell lines, n = 5 individual experiments in (B) using four independent BCR‐DLBCL cell lines, t‐test. n.s, nonsignificant. The [U‐13C16] palmitate arm of these experiments is the same as shown in Fig 3F and G.
- A
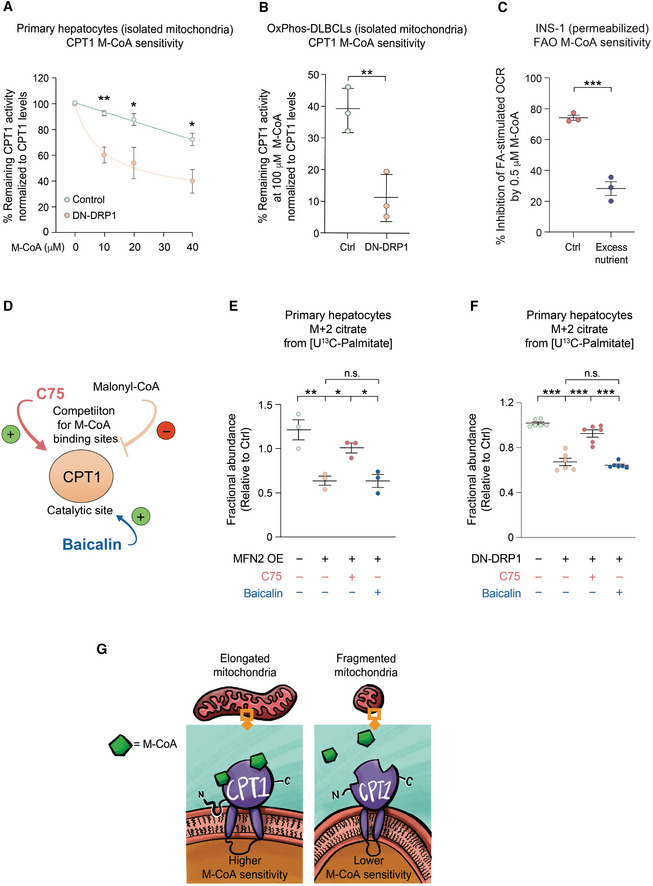
CPT1 activity in the presence of increased malonyl‐CoA (M‐CoA) measured in mitochondria‐enriched heavy membrane fractions isolated from control and DN‐DRP1‐expressing primary mouse hepatocytes. Enzyme activity was normalized to CPT1 protein levels in individual experiments. Data represent means ± SD, n = 3 independent biological replicates, t‐test. *P < 0.05, **P < 0.01.
- B
CPT1 activity in the presence of 100 μM M‐CoA measured in mitochondria‐enriched heavy membrane fractions isolated from control and DN‐DRP1‐expressing OxPhos‐DLBCLs. Enzyme activity was normalized to CPT1 protein levels in individual experiments. Data represent means ± SD, n = 3 individual experiments from one OxPhos‐DLBCL cell line, t‐test. **P < 0.01.
- C
Inhibition of FA‐dependent OCR in the presence of ADP and 0.5 μM M‐CoA in permeabilized INS‐1 cells cultured under control and excess nutrient conditions as in Fig 2A. Data represent means ± SEM, n = 3, t‐test. ***P < 0.001.
- D
Schematic depicting two independent pharmacologic mechanisms of CPT1 activation; competition for M‐CoA binding site by C75 and targeting the catalytic site by baicalin.
- E, F
Differential capacity of C75 and baicalin to rescue FAO in primary hepatocytes following forced mitochondrial elongation by MFN2 OE (E) or DN‐DRP1 (F). The effect of these CPT1 activators on fractional abundance of m + 2 citrate was assessed in [U‐13C16] palmitate tracing studies. Data represent means ± SEM, n = 3 independent biological replicates, one‐way ANOVA. *P < 0.05, **P < 0.01, ***P < 0.001, n.s, nonsignificant.
- G
Schematic representation of proposed mechanism, whereby mitochondrial morphology regulates FAO through modulating CPT1 sensitivity to malonyl‐CoA.
- A, B
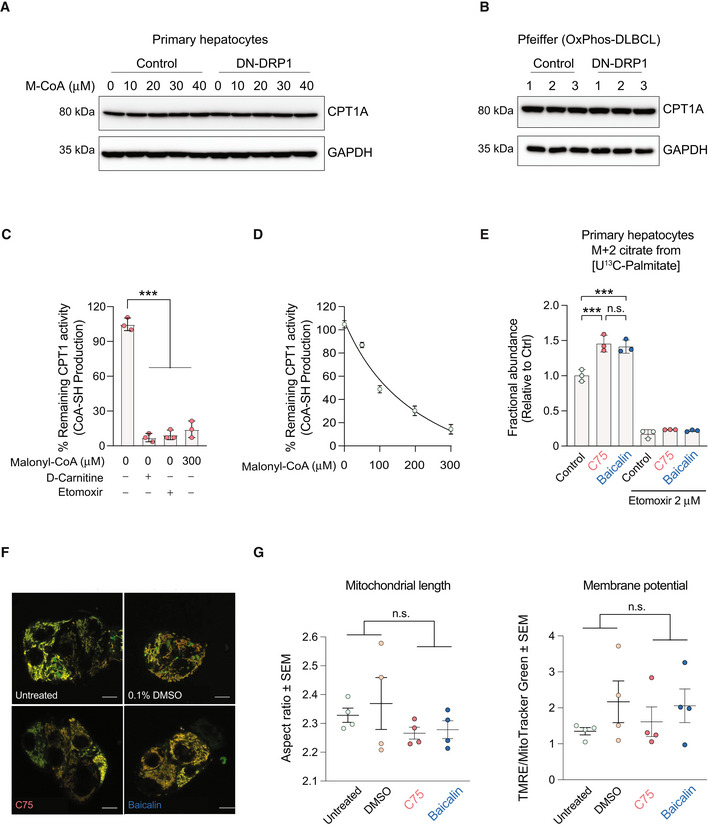
Quantification of CPT1 protein expression in primary hepatocytes (A) and the OxPhos‐DLBCL cell line Pfeiffer (B) following expression of DN‐DRP1 and varying concentrations of malonyl‐CoA.
- C
CPT1 activity in the absence or presence of 2 μM etomoxir, 0 μM palmitoyl‐CoA, and 0 and 300 μM M‐CoA measured in mitochondria‐enriched heavy membrane fractions isolated from control primary hepatocytes. Enzyme activity was normalized to CPT1 protein levels in individual experiments. Data represent means ± SD, n = 3 individual experiments from primary hepatocytes, t‐test. ***P < 0.001.
- D
Full titration curve of CPT1 activity in the presence of increasing malonyl‐CoA (M‐CoA) concentrations measured in mitochondria‐enriched heavy membrane fractions isolated from control primary mouse hepatocytes. Enzyme activity was normalized to CPT1 protein levels in individual experiments. Data represent means ± SD, n = 3.
- E
Fractional abundance of m + 2 citrate from [U‐13C16] palmitate in primary hepatocytes treated with C75 and baicalin in the absence or presence of 2 μM etomoxir. Data represent means ± SD, n = 3 individual experiments from primary hepatocytes, t‐test. ***P < 0.001.
- F, G
Representative confocal images (F) and quantification (G) of mitochondrial morphology and membrane potential of mitochondria in HepG2 cells treated with vehicle, C75, or baicalin and labeled with TMRE (red) and MitoTracker Green (green). Data represent means ± SEM, n = 4 independent biological replicates, 20 cells imaged per independent experiment, t‐test. Scale bar: 10 μm.
References
-
- Aoun M, Feillet‐Coudray C, Fouret G, Chabi B, Crouzier D, Ferreri C, Chatgilialoglu C, Wrutniak‐Cabello C, Cristol JP, Carbonneau MA et al (2012) Rat liver mitochondrial membrane characteristics and mitochondrial functions are more profoundly altered by dietary lipid quantity than by dietary lipid quality: effect of different nutritional lipid patterns. Br J Nutr 107: 647–659 - PubMed
-
- Bach D, Naon D, Pich S, Soriano FX, Vega N, Rieusset J, Laville M, Guillet C, Boirie Y, Wallberg‐Henriksson H et al (2005) Expression of Mfn2, the Charcot‐Marie‐tooth neuropathy type 2A gene, in human skeletal muscle effects of type 2 diabetes, obesity, weight loss, and the regulatory role of tumor necrosis factor α and Interleukin‐6. Diabetes 54: 2685–2693 - PubMed
-
- Baron AD, Brechtel G, Edelman SV (1989) Effects of free fatty acids and ketone bodies on in vivo non‐insulin‐mediated glucose utilization and production in humans. Metabolism 38: 1056–1061 - PubMed
-
- Bieber LL, Abraham T, Helmrath T (1972) A rapid spectrophotometric assay for carnitine palmitoyltransferase. Anal Biochem 50: 509–518 - PubMed
MeSH terms
Substances
Grants and funding
LinkOut - more resources
Full Text Sources
Other Literature Sources
Miscellaneous
