. 2023 Apr 24;8(8):e166044.
doi: 10.1172/jci.insight.166044.

Plasmin and plasminogen prevent sepsis severity by reducing neutrophil extracellular traps and systemic inflammation

Affiliations

Plasmin and plasminogen prevent sepsis severity by reducing neutrophil extracellular traps and systemic inflammation

Juliana P Vago et al. JCI Insight. .

Abstract

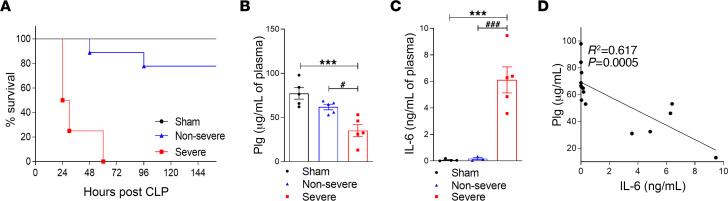
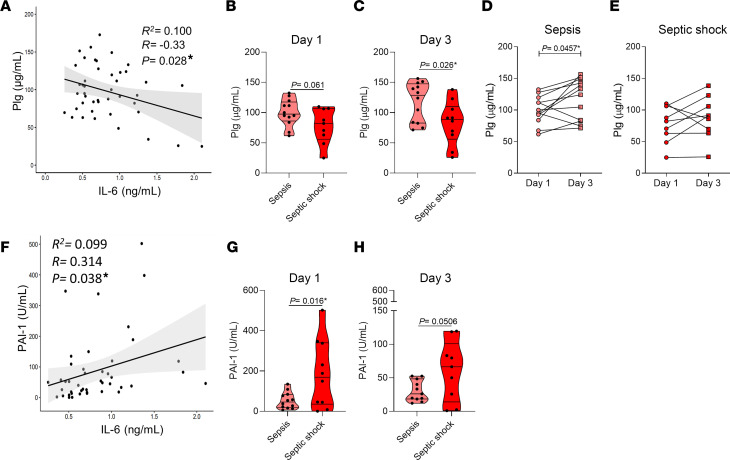
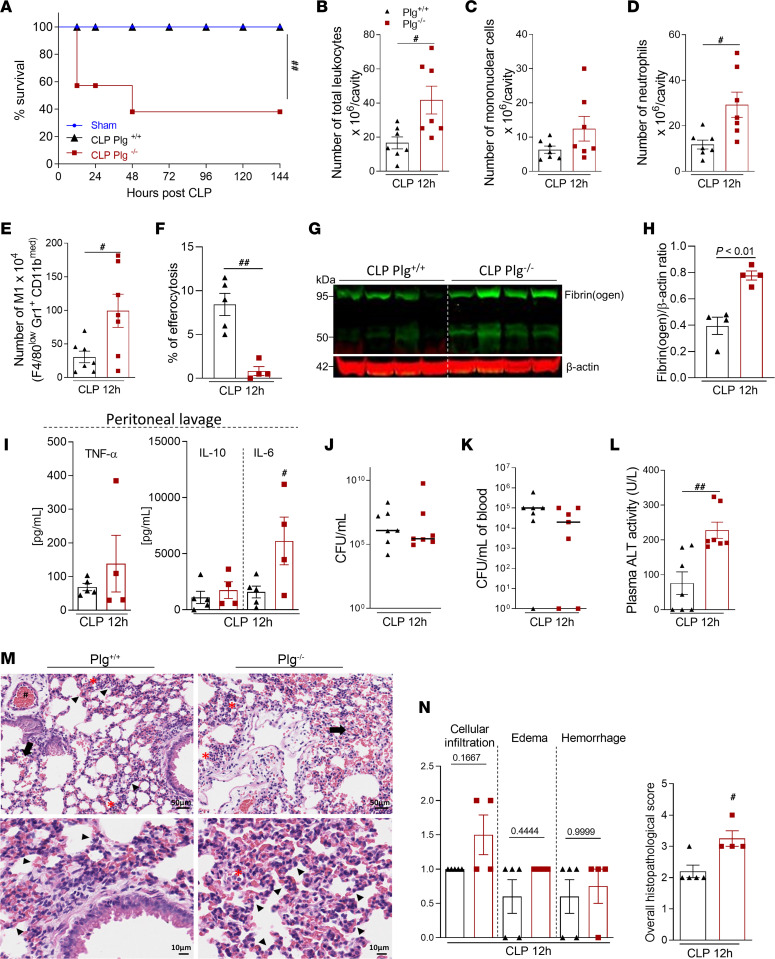
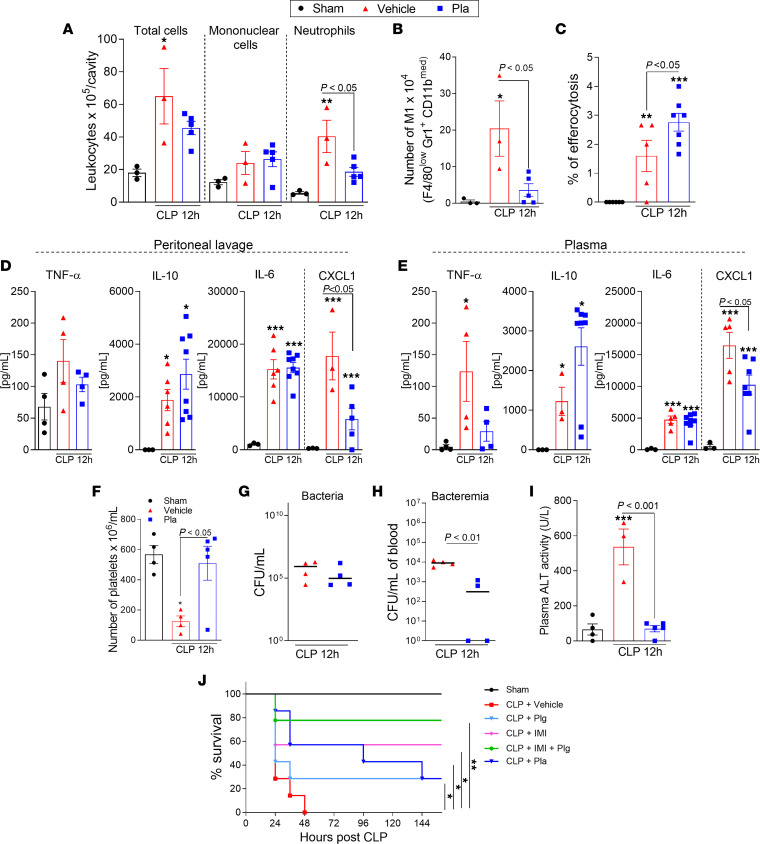
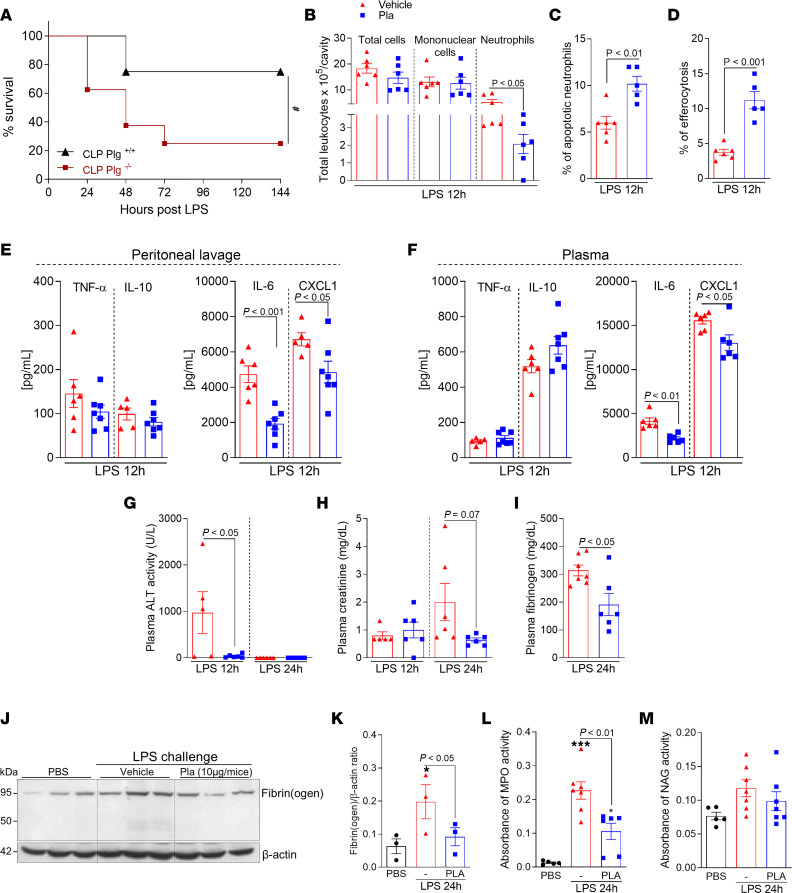
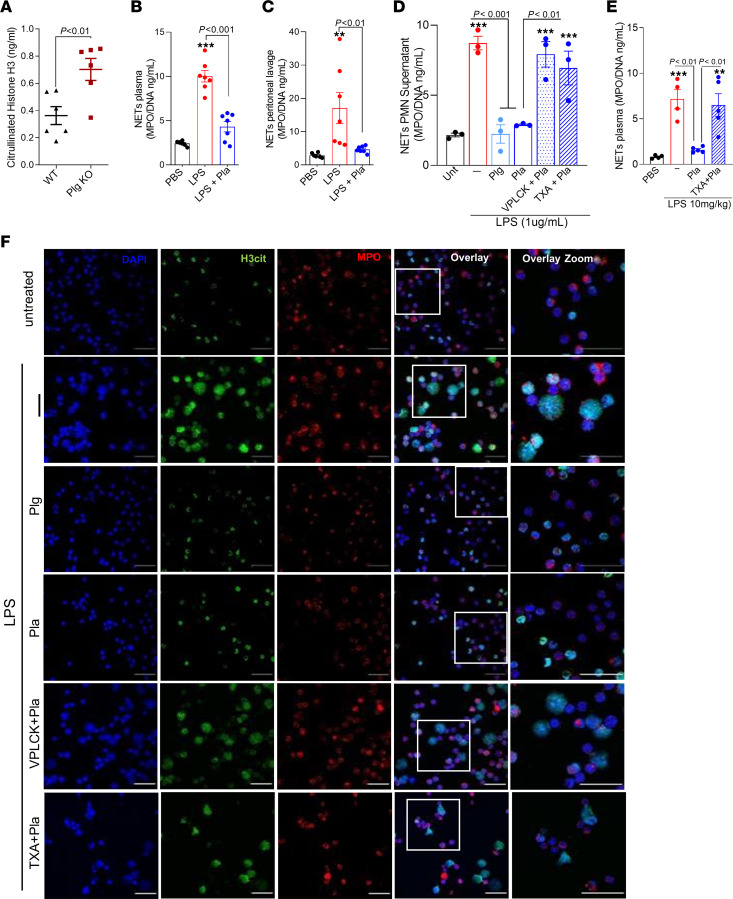
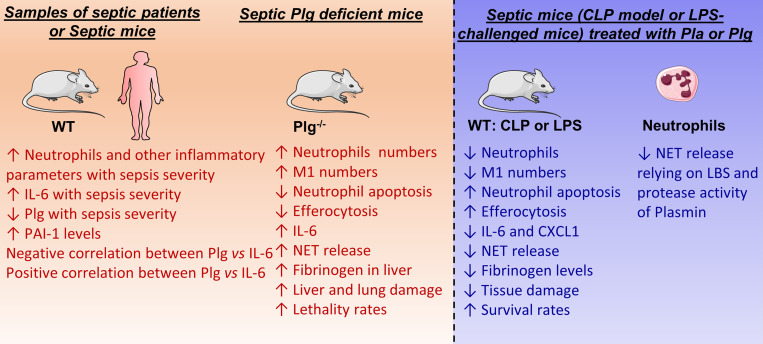
Sepsis is a lethal syndrome characterized by systemic inflammation and abnormal coagulation. Despite therapeutic advances, sepsis mortality remains substantially high. Herein, we investigated the role of the plasminogen/plasmin (Plg/Pla) system during sepsis. Plasma levels of Plg were significantly lower in mice subjected to severe compared with nonsevere sepsis, whereas systemic levels of IL-6, a marker of sepsis severity, were higher in severe sepsis. Plg levels correlated negatively with IL-6 in both septic mice and patients, whereas plasminogen activator inhibitor-1 levels correlated positively with IL-6. Plg deficiency render mice susceptible to nonsevere sepsis induced by cecal ligation and puncture (CLP), resulting in greater numbers of neutrophils and M1 macrophages, liver fibrin(ogen) deposition, lower efferocytosis, and increased IL-6 and neutrophil extracellular trap (NET) release associated with organ damage. Conversely, inflammatory features, fibrin(ogen), and organ damage were substantially reduced, and efferocytosis was increased by exogenous Pla given during CLP- and LPS-induced endotoxemia. Plg or Pla protected mice from sepsis-induced lethality and enhanced the protective effect of antibiotics. Mechanistically, Plg/Pla-afforded protection was associated with regulation of NET release, requiring Pla-protease activity and lysine binding sites. Plg/Pla are important host-protective players during sepsis, controlling local and systemic inflammation and collateral organ damage.

Keywords: Bacterial infections; Infectious disease; Plasmin.


Conflict of interest statement

Conflict of interest: The authors have declared that no conflict of interest exists.

Figures

Figure 1
Figure 1. Evaluation of the survival rates and levels of Plg and IL-6 in plasma of mice after severe and nonsevere sepsis.
C57BL/6J mice were subjected to severe (18G needle) and nonsevere (30G needle) CLP. (A) The survival rates (n = 6 mice) were monitored for 6 days. (B and C) The levels of Plg (B) and IL-6 (C) were measured in plasma by ELISA 12 hours after CLP. (D) The correlation between plasma Plg and IL-6 levels was evaluated by Pearson’s coefficients. Results are shown as the mean ± SEM of at least 5 mice per group. The experiments were performed 3 times with similar results. ***P < 0.001 when comparing sham with severe CLP groups. #P < 0.05 or ###P < 0.001 when comparing severe and nonsevere sepsis groups (1-way ANOVA with post hoc Newman-Keuls).
Figure 2
Figure 2. Assessment of Plg levels and PAI-1 in serum of patients with sepsis and septic shock.
Blood samples of patients with sepsis were centrifuged and serum levels of Plg, IL-6, and PAI-1 were measured by ELISA. (A and F) The association between these analytes was evaluated by correlation (Pearson’s coefficient, R) and regression analyses (R2). (B, C, G, and H) Plg and PAI-1 levels in patients with sepsis (n = 12) and septic shock (n = 10) were evaluated on day 1 (B and G) and day 3 (C and H) by unpaired 2-tailed Student’s t tests. (D and E) Sequential behavior of Plg levels on days 1 and 3 was evaluated in patients with sepsis (D) and patients with septic shock (E) by paired 2-tailed Student’s t test. *P < 0.05. Outliers were removed from the graphs when detected. Of note, Plg levels in patients with sepsis were measured in serum. Plg levels in both plasma and serum are similar, with serum displaying 16% less Plg than plasma, as previously described (75). Nonetheless, we found consistently high levels of Plg in serum samples from patients with sepsis in our study.
Figure 3
Figure 3. Assessment of survival rates and inflammatory parameters in Plg–/– mice and their WT littermates during nonsevere sepsis.
(A) Plg+/+ and Plg–/– mice were subjected to nonsevere (30G needle) CLP. The survival rates (n = 6 mice) were monitored for 6 days. In another set of experiments (n = 4–7), cells present in the peritoneal cavity were harvested 12 hours after CLP. (B–D) The number of total cells (B), mononuclear cells (C), and neutrophils (D) were evaluated by counting cytospin slides stained with May–Grünwald–Giemsa. (E) The number of M1 (F4/80low GR1+ CD11bmed) macrophages was determined by flow cytometry. (F) The percentage of efferocytosis was determined by morphological counting of cytospin slides treated with May–Grünwald–Giemsa stain. (G) Expression of fibrinogen in the liver was determined by Western blotting with anti–β-actin used as the loading control. (H) Densitometric analysis from Western blotting gels is also represented. (I) The levels of TNF, IL-10, and IL-6 were quantified by ELISA in cell-free peritoneal lavages. (J and K) The peritoneal fluid (J) and blood (K) samples were plated in brain–heart infusion medium for the analysis of bacterial load. (L) ALT activity was measured from plasma samples. (M) Representative slides of H&E-stained lungs of Plg+/+ and Plg–/– mice are shown. Bottom row: Higher-magnification images (scale bar: 10 μm) of the micrographs in the Upper row (scale bar: 50 μm). (N) Histopathological score (maximum score = 5) evaluated focal hemorrhage (arrow), edema (arrowhead), vascular hyperemia (#), and inflammatory infiltrate (*). Results are shown as the mean ± SEM or median of 4–7 mice per group. The experiments were performed 2 times with similar results. #P < 0.05 and ##P < 0.01 when comparing Plg+/+ and Plg–/– mice by log-rank test (survival curves), unpaired 2-tailed Student’s t test or Mann-Whitney U test. Outliers were removed from the graphs when detected.
Figure 4
Figure 4. Effect of Pla treatment on inflammatory parameters and survival rates during severe sepsis induced by CLP.
WT C57BL/6J mice (n = 4–8) were subjected to severe (18G needle) CLP and then treated with Pla (10 μg/mouse i.p.) 3 hours later. Cells present in the peritoneal cavity were harvested 12 hours after CLP. (A and C) The number of total cells, mononuclear cells, and neutrophils (A), and frequency of efferocytosis (C) were evaluated by counting cytospin slides treated with May–Grünwald–Giemsa stain. (B) The number of M1 (F4/80low GR1+ CD11bmed) macrophages were determined by flow cytometry. (D and E) The levels of TNF, IL-10, IL-6, and CXCL1 were quantified in cell-free peritoneal lavages (D) and plasma (E), respectively, by ELISA. (F) Platelets counted from blood samples. (G and H)The peritoneal fluid (G) and blood (H) samples were plated in brain–heart infusion medium for the analysis of bacterial load. (I) ALT activity was measured from plasma. Results are shown as the mean ± SEM or median of 4–8 mice per group. The experiments were performed 3 times with similar results. *P < 0.05, **P < 0.01, or ***P < 0.001 when comparing the sham group with the CLP group by 1-way ANOVA with post hoc Newman-Keuls (multiple groups) or unpaired 2-tailed Student’s t test (when comparing 2 groups). P values are indicated in the graphs when comparing vehicle with Pla-treated mice. Outliers were removed from the graphs when detected. In the survival experiments, C57BL/6J mice (n = 7) were subjected to severe (18G needle) CLP and treated with Pla (10 μg/mouse, i.p.), Plg (10 μg/mouse, i.p.), imipenem (IMI; 30 mg/kg, i.p.), or a combination of both (Plg 10 μg/mouse i.p. + IMI 30 mg/k, i.p.) after 3 and 12 hours of sepsis induction. (J) The survival rates were monitored for 6 days. The experiment was performed 2 times with similar results. *P < 0.05 when comparing vehicle-treated mice with Pla-, Plg-, or IMI-treated mice. **P < 0.01 when comparing vehicle-treated mice with Plg- + IMI-treated mice by log-rank test.
Figure 5
Figure 5. Effect of Plg depletion on lethality and of Pla treatment on inflammatory parameters during endotoxemia induced by LPS.
Plg+/+ and Plg–/– mice were subjected to an i.p. injection of LPS (10 mg/kg). (A) The survival rates (n = 8 mice) were monitored for 6 days. #P < 0.05 when comparing Plg+/+ and Plg–/– mice by log-rank test (survival curves). WT C57BL/6J mice were subjected to an i.p. injection of LPS (10 mg/kg) and then treated with Pla (10 μg/mouse i.p.) 3 hours later. Cells present in the peritoneal cavity were harvested 12 hours after LPS injection. (BD) The number of total cells, mononuclear cells, and neutrophils (B), percentage of apoptotic neutrophils (C), and efferocytosis (D) were evaluated by counting cytospin slides treated with May–Grünwald–Giemsa stain. (E and F) The levels of TNF, IL-10, IL-6, and CXCL-1 were quantified in cell-free peritoneal lavages (E) and plasma (F), by ELISA. (G–I) The ALT activity (G), and creatinine (H) and fibrinogen (I) levels were measured in plasma. (J) Expression of fibrin(ogen) in the liver was determined by Western blotting (n = 3) with anti–β-actin used as loading control. (K) Densitometric analysis is also represented. (L and M) MPO (L) and NAG (M) activities were measured in the liver homogenates. Results are shown as the mean ± SEM of 5–7 mice per group. The experiments were performed 3 times with similar results. *P < 0.05, ***P < 0.001 when comparing PBS-injected mice with LPS-injected mice. P values are indicated in the graphs when comparing vehicle with Pla-treated mice by 1-way ANOVA with post hoc Newman-Keuls (multiple groups) or unpaired 2-tailed Student’s t test (when comparing 2 groups). Outliers were removed from the graphs when detected.
Figure 6
Figure 6. Effects of Plg and Pla on NETs release in vivo and in vitro.
(A) Plg+/+ and Plg–/– mice (n = 6) were subjected to nonsevere (30G needle) CLP and the plasma levels of H3cit were determined by ELISA. WT C57BL/6J mice (n = 4–7) were subjected to an i.p. injection of LPS (10 mg/kg) and then treated with Pla (10 μg/mouse i.p.) 3 hours later. (B and C) NETs release (MPO/DNA) in plasma (B) and peritoneal lavages (C) was determined 12 hours after LPS injection. Bone marrow neutrophils obtained from C57BL/6J mice were pretreated with Plg (4 μg/mL), Pla (4 μg/mL), or with Pla preincubated with the inhibitors (D-Val-Phe-Lys chloromethyl ketone [VPLCK] 22.5 nM or TXA 0.1 M) by 1 hour before stimulation with ultrapure LPS (1 μg/mL) for an additional 4 hours. (D) Quantification of NETs release (MPO/DNA) in supernatant. (E) WT C57BL/6J mice were subjected to an i.p. injection of LPS (10 mg/kg) and then treated with Pla (10 μg/mouse, i.p.) 3 hours later. TXA (100 mg/kg, i.p.) was injected 30 minutes before Pla. Plasma was collected 12 hours after LPS injection for NETs release (MPO/DNA) measurement by ELISA. **P < 0.01, ***P < 0.001 when comparing untreated (Unt) or PBS-injected mice with LPS-stimulated or injected and treated groups. P values are indicated in the graphs when comparing CLP-WT versus CLP-KO mice (unpaired 2-tailed Student’s t test) or vehicle with Pla-treated mice/cells by 1-way ANOVA with post hoc Newman-Keuls (multiple groups). Outliers were removed from the graphs when detected. (F) Representative fluorescence images of NETs stained for DNA (DAPI, blue), H3cit (green), and MPO (red) are shown. Scale bar: 50 μm at ×630 magnification.
Figure 7
Figure 7. Summary of the main findings of Plg/Pla in sepsis from our in vivo and in vitro studies.
LBS, lysine binding sites.

References

    1. Liu V, et al. Hospital deaths in patients with sepsis from 2 independent cohorts. JAMA. 2014;312(1):90–92. doi: 10.1001/jama.2014.5804. - DOI - PubMed
    1. Hotchkiss RS, Karl IE. The pathophysiology and treatment of sepsis. N Engl J Med. 2003;348(2):138–150. doi: 10.1056/NEJMra021333. - DOI - PubMed
    1. Doerschug KC, et al. Impairments in microvascular reactivity are related to organ failure in human sepsis. Am J Physiol Heart Circ Physiol. 2007;293(2):H1065–H1071. doi: 10.1152/ajpheart.01237.2006. - DOI - PubMed
    1. Foley JH, Conway EM. Cross talk pathways between coagulation and inflammation. Circ Res. 2016;118(9):1392–1408. doi: 10.1161/CIRCRESAHA.116.306853. - DOI - PubMed
    1. Iffah R, Gavins FNE. Thromboinflammation in coronavirus disease 2019: the clot thickens. Br J Pharmacol. 2022;179(10):2100–2107. doi: 10.1111/bph.15594. - DOI - PMC - PubMed

Publication types