Case Reports
. 2023 Aug 1;146(8):3513-3527.
doi: 10.1093/brain/awad086.

A homozygous POLR1A variant causes leukodystrophy and affects protein homeostasis

Affiliations
Case Reports

A homozygous POLR1A variant causes leukodystrophy and affects protein homeostasis

Doriana Misceo et al. Brain. .

Abstract

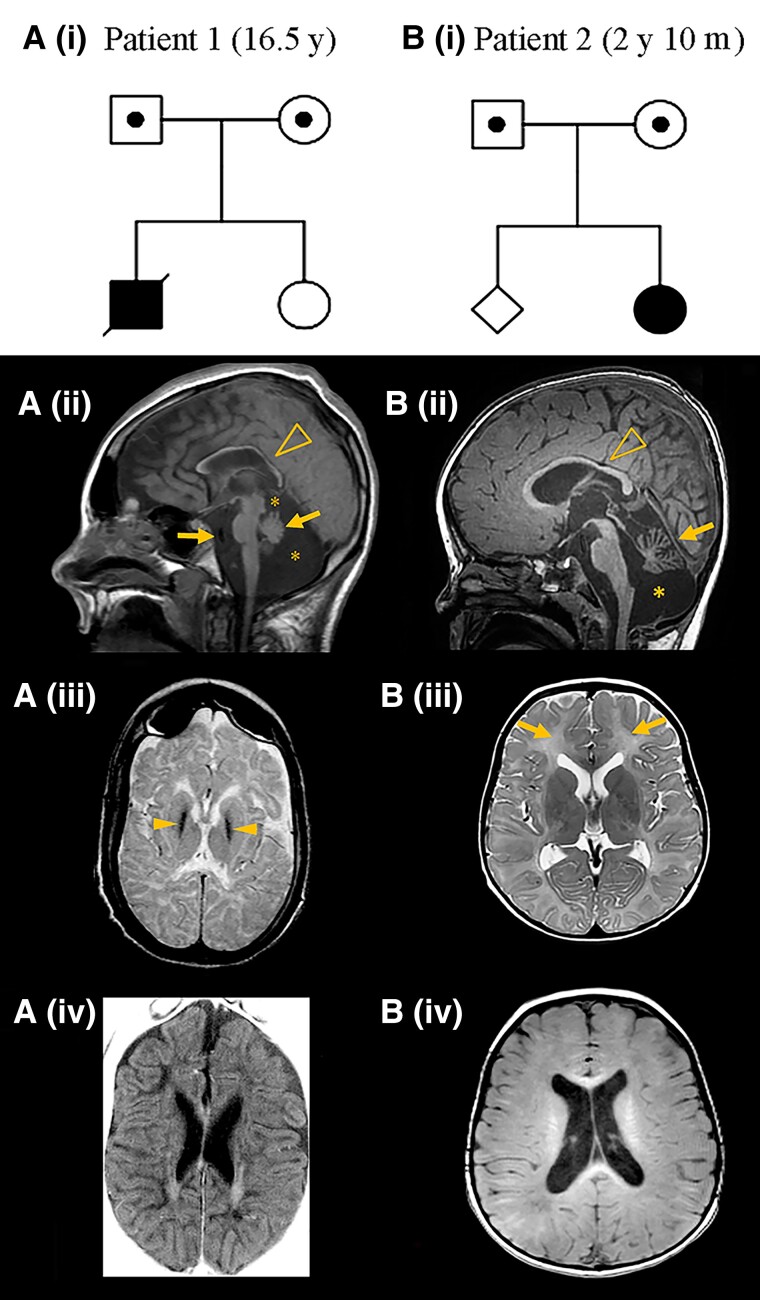
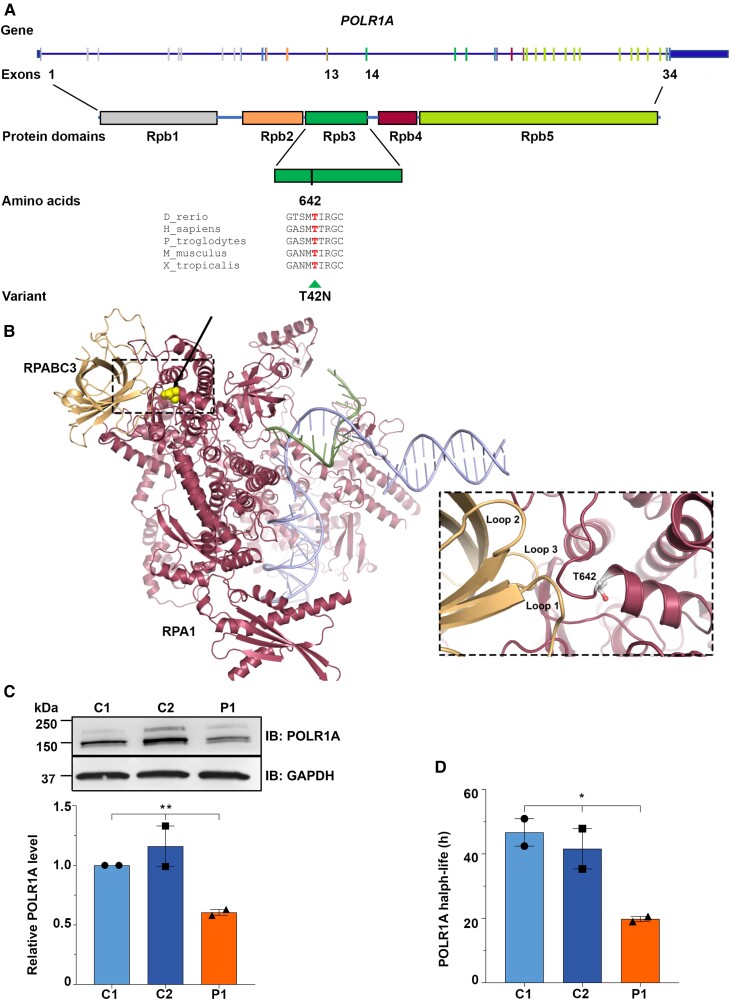
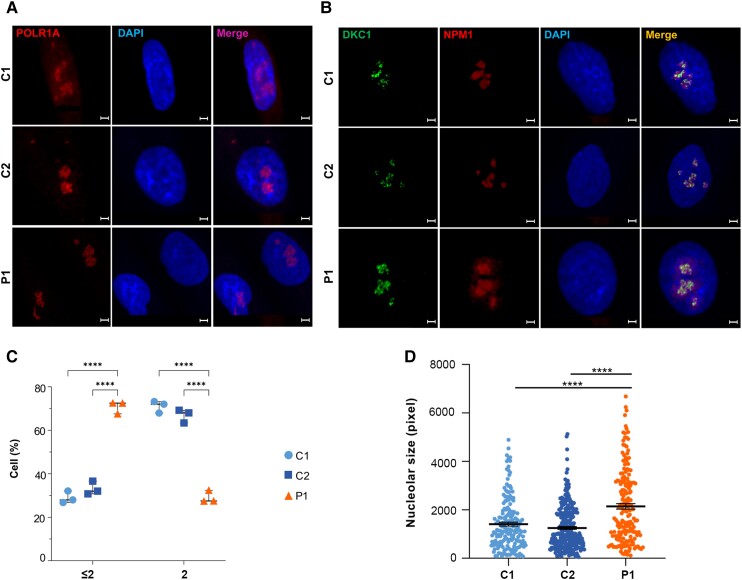
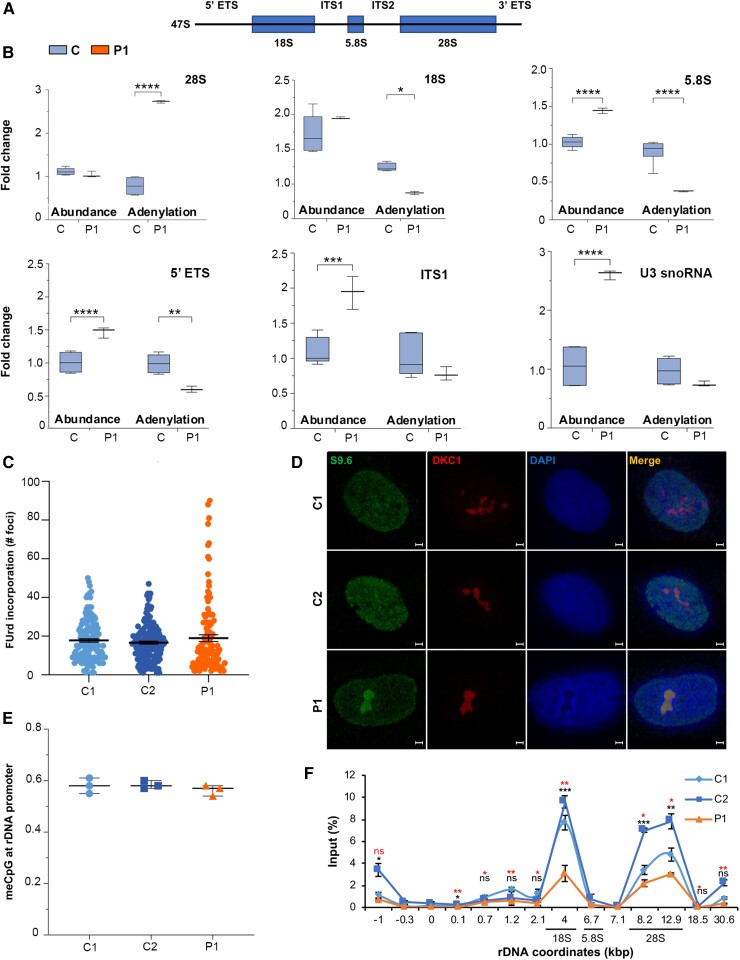
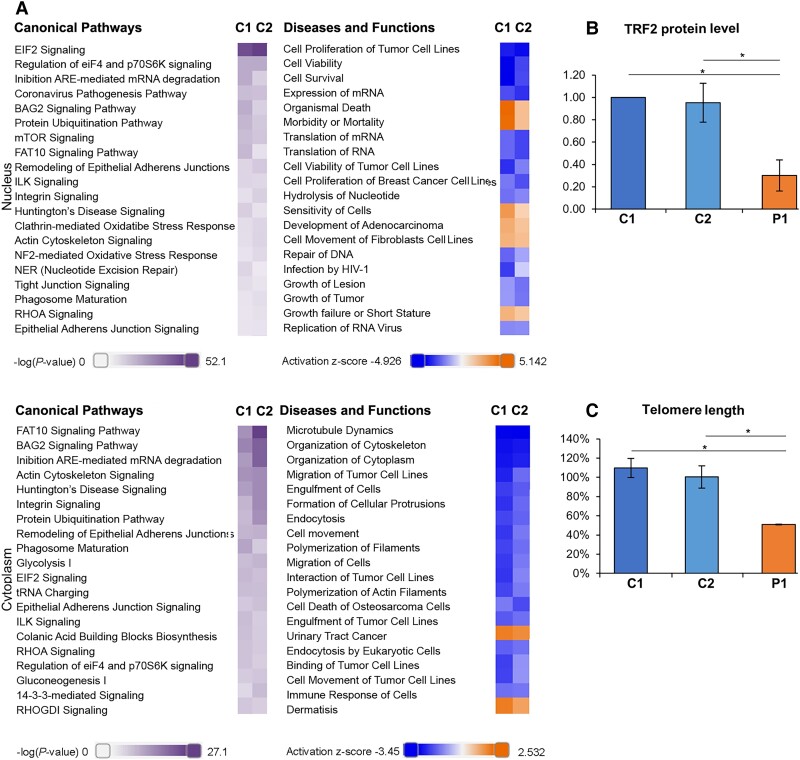
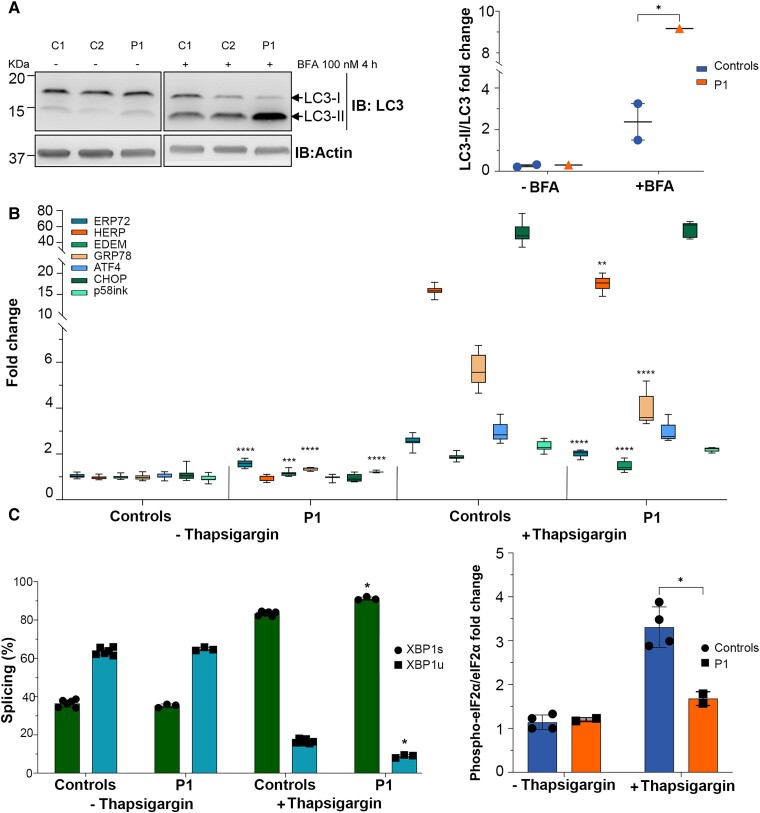
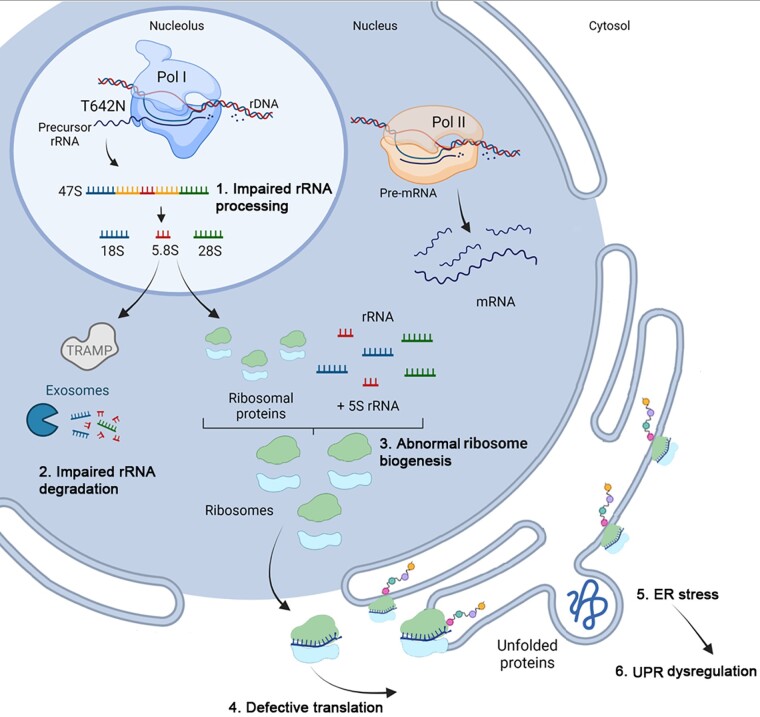
RNA polymerase I transcribes ribosomal DNA to produce precursor 47S rRNA. Post-transcriptional processing of this rRNA generates mature 28S, 18S and 5.8S rRNAs, which form the ribosomes, together with 5S rRNA, assembly factors and ribosomal proteins. We previously reported a homozygous variant in the catalytic subunit of RNA polymerase I, POLR1A, in two brothers with leukodystrophy and progressive course. However, the disease mechanism remained unknown. In this report, we describe another missense variant POLR1A NM_015425.3:c.1925C>A; p.(Thr642Asn) in homozygosity in two unrelated patients. Patient 1 was a 16-year-old male and Patient 2 was a 2-year-old female. Both patients manifested neurological deficits, with brain MRIs showing hypomyelinating leukodystrophy and cerebellar atrophy; and in Patient 1 additionally with hypointensity of globi pallidi and small volume of the basal ganglia. Patient 1 had progressive disease course, leading to death at the age of 16.5 years. Extensive in vitro experiments in fibroblasts from Patient 1 documented that the mutated POLR1A led to aberrant rRNA processing and degradation, and abnormal nucleolar homeostasis. Proteomics data analyses and further in vitro experiments documented abnormal protein homeostasis, and endoplasmic reticulum stress responses. We confirm that POLR1A biallelic variants cause neurodegenerative disease, expand the knowledge of the clinical phenotype of the disorder, and provide evidence for possible pathological mechanisms leading to POLR1A-related leukodystrophy.

Keywords: POLR1A; myelin; neurodegeneration; rRNA; ribosome.


Conflict of interest statement

The authors report no competing interests.

Figures

Figure 1
Figure 1
Family pedigrees, POLR1A variant segregation and brain MRI of patients. [A(i) and B(i)] The POLR1A variant status is indicated as homozygous (filled symbols) and heterozygous (dotted symbols) in the pedigrees. Age of the patient at MRI examination is indicated in parenthesis. [A(ii)] Midline sagittal T1-weighted image shows a thin corpus callosum (arrowhead), a small cerebellum (arrow), prominent cisterns (asterisks), mild scalloping of the occipital bone, decreased pontine area, thin medulla oblongata and enlarged retroclival CSF space (arrow). [A(iii)] Axial T2-weighted image shows marked hypointensity of the globi pallidi (arrowheads). Basal ganglia and thalami have a small volume. [A(iv)] Axial T1-weighted image shows enlarged lateral ventricles and subarachnoid spaces with a reduced volume of white matter, as well as hypointensity of the supratentorial white matter, suggesting hypomyelination with some residual T1 hyperintensity parallel to the lateral ventricles. [B(ii)] Midline sagittal T1-weighted image shows a mildly thin corpus callosum (arrowhead), a small cerebellum (arrow) and an enlarged cisterna magna (asterisk), with additional evidence of cerebellar atrophy. [B(iii)] shows diffusely elevated T2 signal in the entire supratentorial white matter (arrows), suggesting hypomyelination. Size and signal of the basal ganglia and thalami are normal. [B(iv)] T1 signal was hyperintense in the central white matter, hypointense in the parietooccipital white matter and isointense to the cortex in most of the remaining white matter, with some areas of hyperintensity in the subcortical white matter.
Figure 2
Figure 2
Schematic representation of POLR1A and the encoded protein, in silico analysis of POLR1A T642N and expression of mutant POLR1A. (A) Schematic drawing of POLR1A (NM_015425.6) and the encoded protein with domains (NP_056240.2) showing the position of the variant T642N in exon 14 detected in homozygosity in patients. Phylogenetic analyses showed high evolutionary conservation of T642, suggesting that this residue is essential for the function of the protein. POLR1A is shown as a blue line and the vertical bars depict the exons. Exons have the same colours as the encoded functional domains. (B) POLR1A model (raspberry red) in association with nascent RNA (green) and DNA (light blue) molecules. On the left, interaction with RPABC3 subunit (orange) is shown. The position of the variant is yellow (indicated by the arrow). The inset shows RPABC3 loops 1–3 that are all close to the T642 position in POLR1A. (C) Representative immunoblot (top) and relative quantification of POLR1A protein (bottom) in cells from Patient 1 (P1) and controls (C1 and C2). GAPDH was used as loading control. (D) Histogram showing POLR1A half-life as measured by CHX time course. (C and D) *P ≤ 0.05, **P ≤ 0.01 (two-tailed Student's t-test).
Figure 3
Figure 3
Immunofluorescence studies on fibroblasts from Patient 1 showed that POLR1A T642N maintained its nucleolar localization but presented defective nucleolar homeostasis. (A) Staining of POLR1A (in red, left column) and of the nucleus (in blue, middle column) shows that POLR1A localized to the nucleolus in fibroblasts from Patient 1 (P1) and controls (C1 and C2). Scale bars = 5 µm. (B) Identification of the nucleoli using the nucleolar markers DKC1 (green, first column from left) and NPM1 (red, second column from left). Scale bars = 5 µm. (C) Quantification of the number of nucleoli (≤2 or >2) per fibroblast. Fibroblasts from Patient 1 showed an increased fraction of cells with ≤2 nucleoli as well as a lower fraction of cells with >2 compared to controls. Bars indicate mean ± SD. *P ≤ 0.05 (two-tailed Student's t-test). (D) Total nucleolar size determined by boundaries of NPM1 immunostaining. Bars indicate mean ± SEM for n > 30 cells per cell type. ****P ≤ 0.0001 (two-tailed Student's t-test).
Figure 4
Figure 4
rRNA processing anomalies in cells expressing POLR1A T642N. (A) Schematic representation of 47S pre-rRNA primary transcript. (B) Quantification of immature and mature rRNA (abundance and polyadenylation) products and U3 snoRNA levels measured by qPCR. cDNA was synthesized with random or oligo(dT) primers. Relative abundance was measured using cDNA synthesized with random primers while adenylation frequency was estimated as the ratio of oligo(dT)-primed cDNA to random-primed cDNA. (C) Nucleolar transcription as measured by quantification of FUrd incorporation in the newly synthesized rRNA molecules. Box plot showing FUrd incorporation measured as number of FUrd foci per cell in Patient 1 (P1) compared to controls (C1 and C2). Data are shown as the number of foci per cell. (D) Immunofluorescence images showing accumulation of RNA:DNA hybrids (S9.6, in green, first column from left) in the nucleoli of Patient 1. DKC1 (in red, second column from left) was used as nucleolar marker. Scale bars = 5 µm. (E) Methyl CpG analyses at −59 CpG island at rDNA promoter. (F) RNA polymerase I I occupancy analysis on rDNA as measured by ChIP. Lower row of P-value (asterisks in red) comparison of C1 to P1; upper row of P-value (asterisks in black) comparison of C2 to P1; ns = not significant. (B and F) *P ≤ 0.05, **P ≤ 0.01, ***P ≤ 0.001, ****P ≤ 0.0001 (two-tailed Student's t-test).
Figure 5
Figure 5
POLR1A T642N showed increased ER stress and reduced telomere homeostasis. (A) IPA analysis of the proteomics data from fibroblasts of Patient 1 and controls showing the top 20 Canonical pathways (left) and Diseases and Functions categories (right) dysregulated in Patient 1 versus controls (C1 and C2) in the nuclear proteome (Nucleus) and in the cytoplasmic proteome (Cytoplasm). Lilla scale bar = −log(P-value); orange-blue scale bar = Activation z-score. For example: orange indicates that a Diseases and Functions category is more active in patient compared to controls. See also Supplementary Table 4. (B) Quantification of TRF2 expression levels as measured by western assay in Patient 1 and control cells. (C) Quantification of telomere length as measured by qPCR. (B and C) Mean ± SD, *P ≤ 0.05 (two-tailed Student's t-test).
Figure 6
Figure 6
POLR1A T642N led to increased autophagy and UPR stress. (A) Representative immunoblot for LC3-I and LC3-II (left) and quantification of the autophagic flux as ratio LC3-II/LC3-I (right). β-Actin was used as loading control. (B) Fold changes depicting the activation of UPR pathway. Thapsigargin was used as positive control for the UPR activation. ERP72 (PDIA4), HERP (HERPUD1), EDEM (EDEM1), GRP78 (HSPA5), ATF4 (ATF4), CHOP (DDIT3) and p58ink (DNAJC3) levels are shown (the HGNC name of each protein is shown within parentheses). (C) Histogram showing the splicing ratio of XBP1 mRNA in P1 and control fibroblasts after treatment with thapsigargin. XBP1s = spliced; XBP1u = unspliced. (D) Quantification of phospho-eiF2α/eiF2α ratio as measured by western blotting in P1 and control cells treated with thapsigargin. (BD) Mean ± SD, *P ≤ 0.05, **P ≤ 0.01, ***P ≤ 0.001, ****P ≤ 0.0001 (two-tailed Student's t-test, patient versus controls).
Figure 7
Figure 7
The cartoon illustrates the suggested cascade of events in cells expressing POLR1A T642N based on the in vitro studies. The steps in the cascade are labelled 1 to 7. 1. RNA polymerase I with the mutated POLR1A subunit produces rRNA precursors that will undergo abnormal processing and 2. impaired rRNA degradation, which was documented by altered levels of mature and immature rRNA species, and their polyadenylated forms, in fibroblasts from Patient 1 compared to controls. 3. Abnormal rRNA mature species will possibly lead to abnormal ribosome biogenesis. 4. This in turn will cause nucleolar stress and defective translation. The nucleolar stress was documented in fibroblasts from Patient 1 by the presence of a reduced number of nucleoli per cell, which also were enlarged. 5. Defective translation was probably the cause of ER stress induction. 6. ER stress dysregulated the UPR pathways. In fact, protein levels of several UPR pathway components were found to be significantly different in cells from Patient 1 compared to the controls, both in resting condition and after thapsigargin-induced ER stress.

References

    1. Barba-Aliaga M, Alepuz P, Pérez-Ortín JE. Eukaryotic RNA polymerases: The many ways to transcribe a gene. Front Mol Biosci. 2021;8:663209. - PMC - PubMed
    1. Kopp K, Gasiorowski JZ, Chen D, et al. Pol I transcription and pre-rRNA processing are coordinated in a transcription-dependent manner in mammalian cells. Mol Biol Cell. 2007;18:394–403. - PMC - PubMed
    1. Weaver KN, Watt KE, Hufnagel RB, et al. Acrofacial Dysostosis, Cincinnati Type, a mandibulofacial dysostosis syndrome with limb anomalies, is caused by POLR1A dysfunction. Am J Hum Genet. 2015;96:765–774. - PMC - PubMed
    1. Shenoy RD, Shetty V, Dheedene A, et al. Phenotypic and molecular heterogeneity in mandibulofacial dysostoses: A case series from India. Cleft Palate Craniofac J. 2021;59:1346–1351. - PubMed
    1. Kara B, Köroğlu C, Peltonen K, et al. Severe neurodegenerative disease in brothers with homozygous mutation in POLR1A. Eur J Hum Genet. 2017;25:315–323. - PMC - PubMed

Publication types