. 2023 Mar 21;120(12):e2220320120.
doi: 10.1073/pnas.2220320120. Epub 2023 Mar 14.

Functional SARS-CoV-2 cross-reactive CD4+ T cells established in early childhood decline with age

Affiliations

Functional SARS-CoV-2 cross-reactive CD4+ T cells established in early childhood decline with age

Marion Humbert et al. Proc Natl Acad Sci U S A. .

Erratum in

Abstract

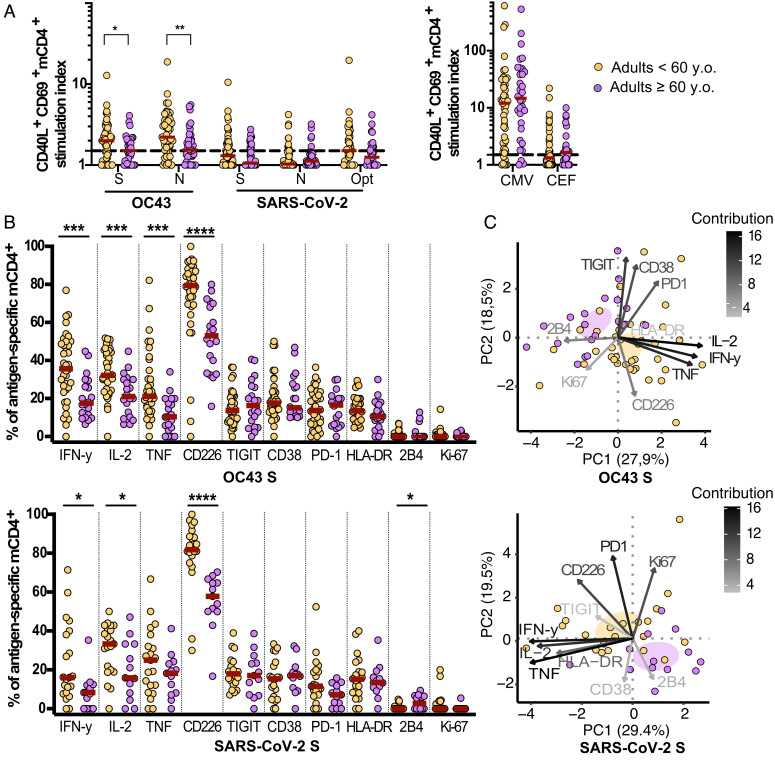
Pre-existing SARS-CoV-2-reactive T cells have been identified in SARS-CoV-2-unexposed individuals, potentially modulating COVID-19 and vaccination outcomes. Here, we provide evidence that functional cross-reactive memory CD4+ T cell immunity against severe acute respiratory syndrome coronavirus 2 (SARS-CoV-2) is established in early childhood, mirroring early seroconversion with seasonal human coronavirus OC43. Humoral and cellular immune responses against OC43 and SARS-CoV-2 were assessed in SARS-CoV-2-unexposed children (paired samples at age two and six) and adults (age 26 to 83). Pre-existing SARS-CoV-2-reactive CD4+ T cell responses targeting spike, nucleocapsid, and membrane were closely linked to the frequency of OC43-specific memory CD4+ T cells in childhood. The functional quality of the cross-reactive memory CD4+ T cell responses targeting SARS-CoV-2 spike, but not nucleocapsid, paralleled OC43-specific T cell responses. OC43-specific antibodies were prevalent already at age two. However, they did not increase further with age, contrasting with the antibody magnitudes against HKU1 (β-coronavirus), 229E and NL63 (α-coronaviruses), rhinovirus, Epstein-Barr virus (EBV), and influenza virus, which increased after age two. The quality of the memory CD4+ T cell responses peaked at age six and subsequently declined with age, with diminished expression of interferon (IFN)-γ, interleukin (IL)-2, tumor necrosis factor (TNF), and CD38 in late adulthood. Age-dependent qualitative differences in the pre-existing SARS-CoV-2-reactive T cell responses may reflect the ability of the host to control coronavirus infections and respond to vaccination.

Keywords: SARS-CoV-2; T cell specificity; age groups; cross-protection; human coronavirus OC43.


Conflict of interest statement

The authors have organizational affiliations to disclose, K.-J.M. is a consultant with ownership interests at Fate Therapeutics and Vycellix and has research funding from Fate Therapeutics, not related to this work. He has a Royalty agreement with FATE Therapeutics through licensing of intellectual property (IP), not related to this work. K.-J.M. has received honoraria from Oncopeptides, Cytovia and has research funding from Oncopeptides and Merck, not related to this work. E.S. is a paid consultant at Fate Therapeutics, not related to this work. S.A. has received honoraria for lectures and educational events, not related to this work, from Gilead, AbbVie, Merck Sharp & Dohme (MSD), and Biogen, and reports grants from Gilead and AbbVie.

Figures

Fig. 1.
Fig. 1.
Study outline and mapping of T cell responses against OC43 and SARS-CoV-2. (A) Outline of the study design, cohorts, and methodology created with BioRender.com. Cells were stimulated with 20-mer peptides spanning the spike (S), membrane (M), and nucleocapsid (N) proteins from OC43 and SARS-CoV-2, followed by analysis using IFN-γ FluoroSpot and flow cytometry by gating on antigen-specific CD69+ CD40L+ memory (m)CD4+ T cells. Control peptides included optimal MHC-I- and MCH-II-restricted peptides from SARS-CoV-2 (SARS-CoV-2 Opt) and CMV, and a pool combining peptides from CMV, EBV, and flu (CEF). See Materials and Methods for details. (B) Fold change of average spot forming units (average SFU) relative to negative control in blood donors (n = 60) stimulated with OC43 or SARS-CoV-2 peptide megapools. Kruskal–Wallis test with Dunn’s multiple comparison post hoc test. (C) Plasma levels of IgG in blood donors (n = 52) targeting the spike regions 1 (S1) and 2 (S2) and hemagglutinin (HA) of OC43, as well as S1 of 229E, NL63, and HKU1. Kruskal–Wallis test with Dunn’s multiple comparison post hoc test. (D and E) Spearman correlation of CD69+ CD40L+ mCD4+ T cells provided as the stimulation index against OC43 S versus SARS-CoV-2 S (D; n = 60) or anti-OC43-S IgG plasma levels (E; n = 49). The threshold for a positive antigen-specific response, set at 1.5 (dotted line), is indicated. (F) Immunogenic peptides identified by FluoroSpot in blood donors after stimulation with peptide matrix pools and single peptides derived from OC43. Presented as fold change of average SFU compared to negative control, with peptide name and region along the axis (RBD; receptor-binding domain).*, p < 0.05; **, p < 0.01; ***, p < 0.001; ****, p < 0.0001. The threshold for a positive response, set at 2, is shown (dotted line). The median (dark red) is depicted when applicable.
Fig. 2.
Fig. 2.
Qualitative aspects of OC43 and cross-reactive SARS-CoV-2 T cell immunity. (A) Functional profiles of CD69+ CD40L+ mCD4+ T cells. OC43 S, n = 39; SARS-CoV-2 S, n = 22; OC43 N, n = 45; SARS-CoV-2 N, n = 14; SARS-CoV-2 Opt, n = 25; CMV, n = 52. Permutation test. Black represents functional combinations that appear in response to CMV only. (B) IFN-γ+, IL-2+, and TNF+ antigen-specific mCD4+ T cells. Kruskal–Wallis test with Dunn’s multiple comparison post hoc test. (C) Paired comparisons of IFN-γ+, IL-2+, and TNF+ OC43-specific and pre-existing SARS-CoV-2 S-reactive mCD4+ T cells, n = 21. Wilcoxon matched-pairs signed-rank test. (D) Fold change of average spot forming units (average SFU), relative to negative control, acquired by IFN-γ FluoroSpot assay after stimulation with decreasing concentrations of peptides. The black line represents the mean; gray lines represent individual donor responses. The OC43 and SARS-CoV-2 peptide sequences and the reference sequence for each of the other HCoVs are provided. –, represents sequence homology; ., indicates a gap. *, p < 0.05; **, p < 0.01; ***, p < 0.001; ****, p < 0.0001. The median (dark red) is depicted when applicable.
Fig. 3.
Fig. 3.
Cellular and humoral immunity against OC43 and SARS-CoV-2 in 12 mo post-COVID-19 convalescents. (A) Stimulation index of CD69+ CD40L+ mCD4+ T cells in SARS-CoV-2 seronegative blood donors (n = 60) and 12 mo post-COVID-19 convalescents (n = 58, except for OC43 M, n = 9, and SARS-CoV-2 M, n = 14). The dotted line depicts the threshold, set at 1.5, for a positive antigen-specific response. Mann–Whitney test. (B) Functional profiles of identified OC43-specific and SARS-CoV-2-reactive mCD4+ T cells against S in blood donors and 12 mo convalescents. OC43 S (blood donors), n = 39; OC43 S (convalescents), n = 43; SARS-CoV-2 S (blood donors), n = 22; SARS-CoV-2 S (convalescents), n = 56. Permutation test. (C) Plasma levels of IgG targeting SARS-CoV-2 and HCoV-OC43 in mild (n = 34) or severe (n = 24) 12 mo convalescents (S-810, amino acid position 810 in S). Mann–Whitney test. (D) Stimulation index of CD69+ CD40L+ mCD4+ T cells in mild (n = 34) and severe (n = 24) 12 mo convalescents. SARS-CoV-2 S-82 and corresponding OC43 peptide S-92 are immunogenic single peptides identified during epitope mapping. Mann–Whitney test. (E) Spearman correlation between the stimulation index of CD69+ CD40L+ OC43- and SARS-CoV-2-specific mCD4+ T cells against the S region in mild and severe 12 mo convalescents. (F) Function of detected SARS-CoV-2 S-specific mCD4+ T cells in mild (n = 32) and severe (n = 24) 12 mo convalescents. Permutation test. (G) Comparison of IFN-γ+, IL-2+, and TNF+ between SARS-CoV-2 S-specific mCD4+ T cells from mild (n = 32) and severe (n = 24) 12 mo convalescents. Mann–Whitney test. *, p < 0.05; **, p < 0.01; ***, p < 0.001; ****, p < 0.0001. The median (dark red) is depicted when applicable.
Fig. 4.
Fig. 4.
Impact of older age on OC43-specific and pre-existing SARS-CoV-2-reactive T cell immunity. (A) Stimulation index of CD69+ CD40L+ mCD4+ T cells in SARS-CoV-2 seronegative adults <60 y.o. (OC43 S, SARS-CoV-2 S, n = 55; OC43 N, n= 53; SARS-CoV-2 N, n = 54; SARS-CoV-2 Opt, n = 46; CMV, n = 49; CEF, n = 48) and adults ≥60 y.o. (OC43 S, SARS-CoV-2 N, n = 39; OC43 N, SARS-CoV-2 S, n = 38; SARS-CoV-2 Opt, n = 33; CMV, n = 32; CEF, n = 27). The dotted line depicts the threshold for a positive response. Mann–Whitney test. (B) Function and phenotype of identified OC43 S-specific and pre-existing SARS-CoV-2 S-reactive mCD4+ T cells. Mann–Whitney test. (C) Principal component (PC) analysis of functional and phenotypic markers among antigen-specific mCD4+ T cells. OC43 S (<60 y.o.), n = 38; OC43 S (≥60 y.o.), n = 20; SARS-CoV-2 S (<60 y.o.), n = 21; SARS-CoV-2 S (≥60 y.o.), n = 13. *, p < 0.05; **, p < 0.01; ***, p < 0.001; ****, p < 0.0001. The median (dark red) is depicted when applicable.
Fig. 5.
Fig. 5.
Functional and phenotypic markers distinguish T cell responses at ages two and six. (A) Stimulation index of CD69+ CD40L+ mCD4+ T cells in 2 y.o. (n = 17), 6 y.o. (OC43 S, SARS-CoV-2 S, SARS-CoV-2 N, n = 16; OC43 N, n = 15), and adults <60 y.o. (OC43 S, SARS-CoV-2 S, n = 55; OC43 N, n= 53; SARS-CoV-2 N, n = 54). Kruskal–Wallis test with Dunn’s multiple comparison post hoc test. (B) Spearman correlation between the stimulation index of antigen-specific mCD4+ T cells in children. Left panels (blue), 2 y.o.; Right panel (orange), 6 y.o.; OC43 S and SARS-CoV-2 S, OC43 epitope S-92, and corresponding SARS-CoV-2 epitope S-82, OC43 N, and SARS-CoV-2 N. (C) Function and phenotype of OC43 S-specific and SARS-CoV-2 S-reactive mCD4+ T cells in children at ages two and six. OC43 S (2 y.o.), n = 15; OC43 S (6 y.o.), n = 15; SARS-CoV-2 S (2 y.o.), n = 6; SARS-CoV-2 S (6 y.o.), n = 10. Mann–Whitney test. (D) Principal component (PC) analysis of functional and phenotypic markers of OC43-specific and pre-existing SARS-CoV-2-reactive mCD4+ T cells in 2- and 6-y.o. children. OC43 S (2 y.o.), n = 15; OC43 S (6 y.o.), n = 15; SARS-CoV-2 S (2 y.o.), n = 6; SARS-CoV-2 S (6 y.o.), n = 10. *, p < 0.05; **, p < 0.01; ***, p < 0.001; ****, p < 0.0001. The median (dark red) is depicted when applicable.
Fig. 6.
Fig. 6.
Superior function of OC43 S-specific and pre-existing SARS-CoV-2 S-reactive CD4+ T cells in children compared to adulthood. (A) Spearman correlation between age and the stimulation index of antigen-specific CD69+ CD40L+ mCD4+ T cells. OC43 S, n = 110; SARS-CoV-2 S, n = 109. (B) Contour UMAP plot of bulk and antigen-specific mCD4+ T cells from four representative donors from each age group. 6 y.o. (n = 16), adults age < 60 (n = 46), and adults age ≥ 60 (n = 39). (C) UMAP plots of the distribution of antigen-specific mCD4+ T cell populations (color) overlayed over the bulk mCD4+ T cell population (gray). (D) UMAP plots showing the expression of measured markers. (E) Visualization of cell clusters identified by PhenoGraph. (F) Hierarchical clustering heatmap of relative marker expression across each cell cluster from (E). (G) Proportion of cells from each age group and antigen-specific population residing in each cluster from (E).

References

    1. Murray S. M., et al. , The impact of pre-existing cross-reactive immunity on SARS-CoV-2 infection and vaccine responses. Nat. Rev. Immunol. 1–13 (2022), 10.1038/s41577-022-00809-x. - DOI - PMC - PubMed
    1. Grifoni A., et al. , Targets of T cell responses to SARS-CoV-2 coronavirus in humans with COVID-19 disease and unexposed individuals. Cell 181, 1489–1501.e1415 (2020). - PMC - PubMed
    1. Rydyznski Moderbacher C., et al. , Antigen-specific adaptive immunity to SARS-CoV-2 in acute COVID-19 and associations with age and disease severity. Cell 183, 996–1012.e1019 (2020). - PMC - PubMed
    1. Meckiff B. J., et al. , Imbalance of regulatory and cytotoxic SARS-CoV-2-reactive CD4(+) T cells in COVID-19. Cell 183, 1340–1353.e1316 (2020). - PMC - PubMed
    1. Loyal L., et al. , Cross-reactive CD4(+) T cells enhance SARS-CoV-2 immune responses upon infection and vaccination. Science 374, eabh1823 (2021). - PMC - PubMed

Publication types

Substances