. 2023 Mar 21;120(12):e2211522120.
doi: 10.1073/pnas.2211522120. Epub 2023 Mar 14.

Dysregulation of ribosome-associated quality control elicits cognitive disorders via overaccumulation of TTC3

Affiliations

Dysregulation of ribosome-associated quality control elicits cognitive disorders via overaccumulation of TTC3

Ryo Endo et al. Proc Natl Acad Sci U S A. .

Abstract

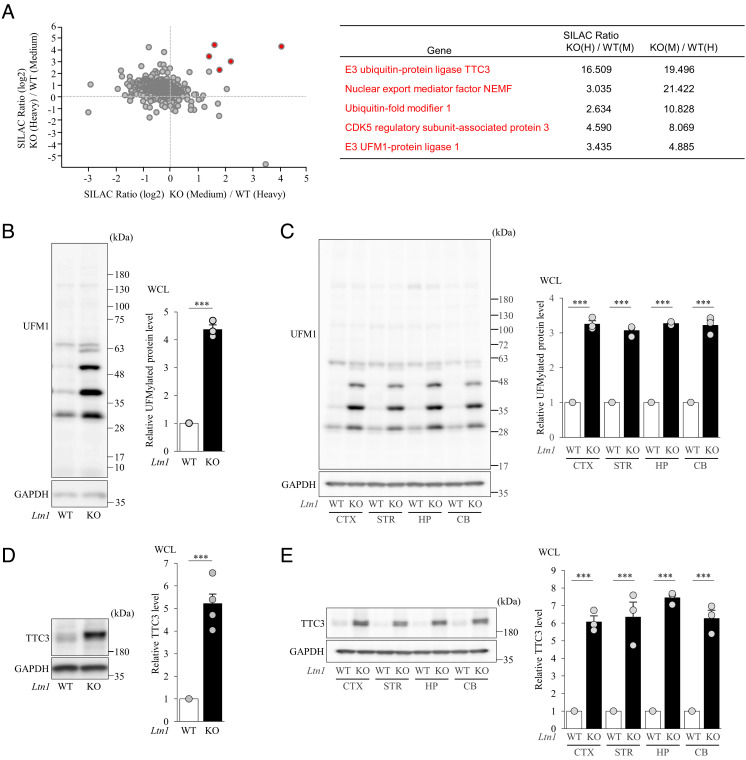
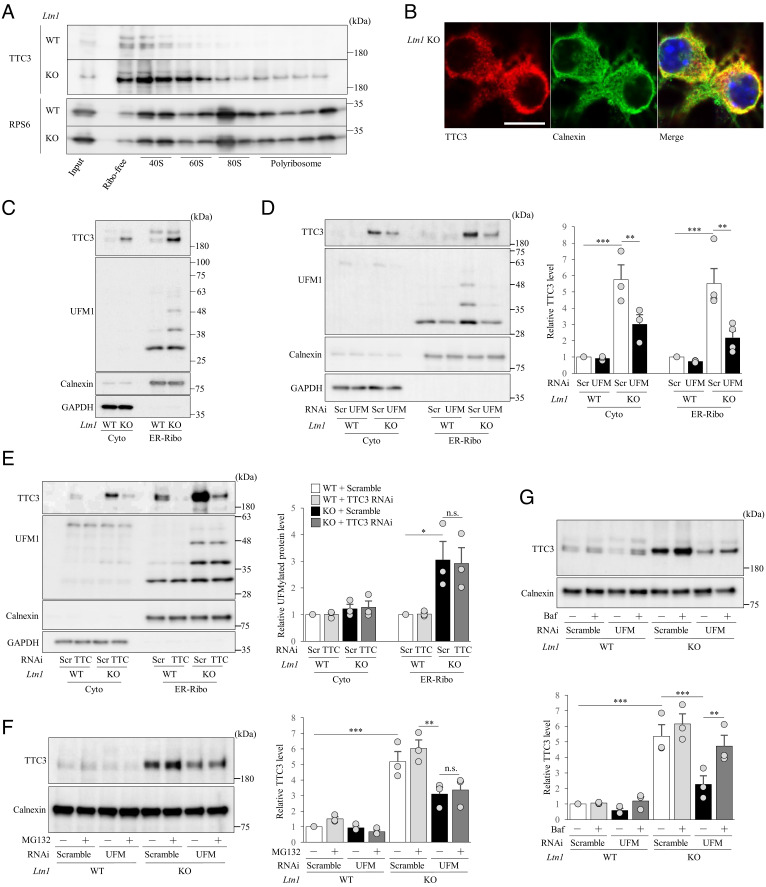
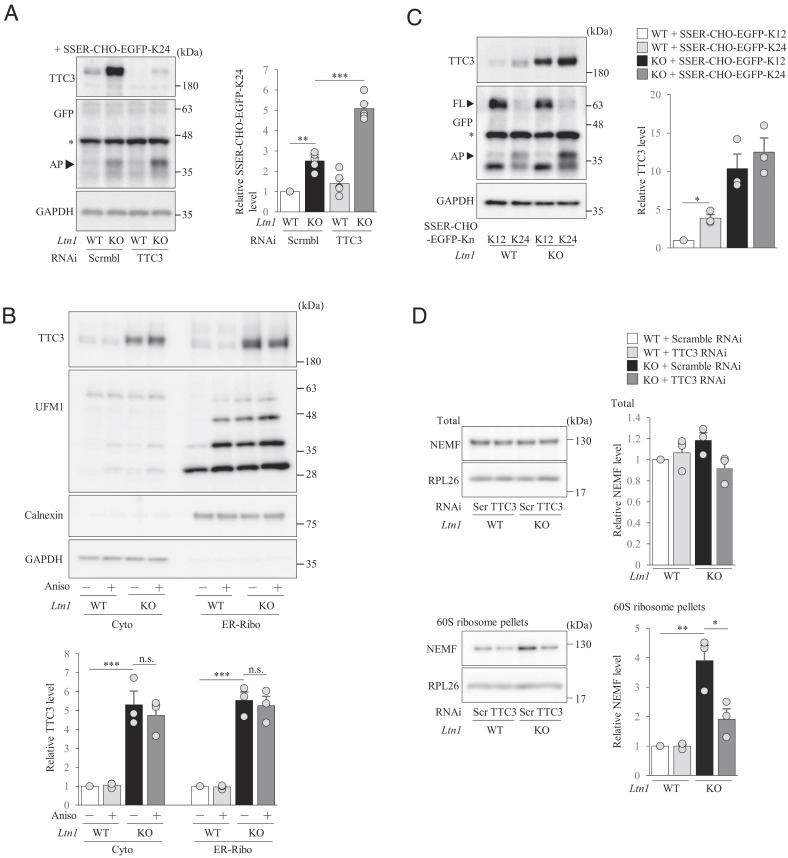
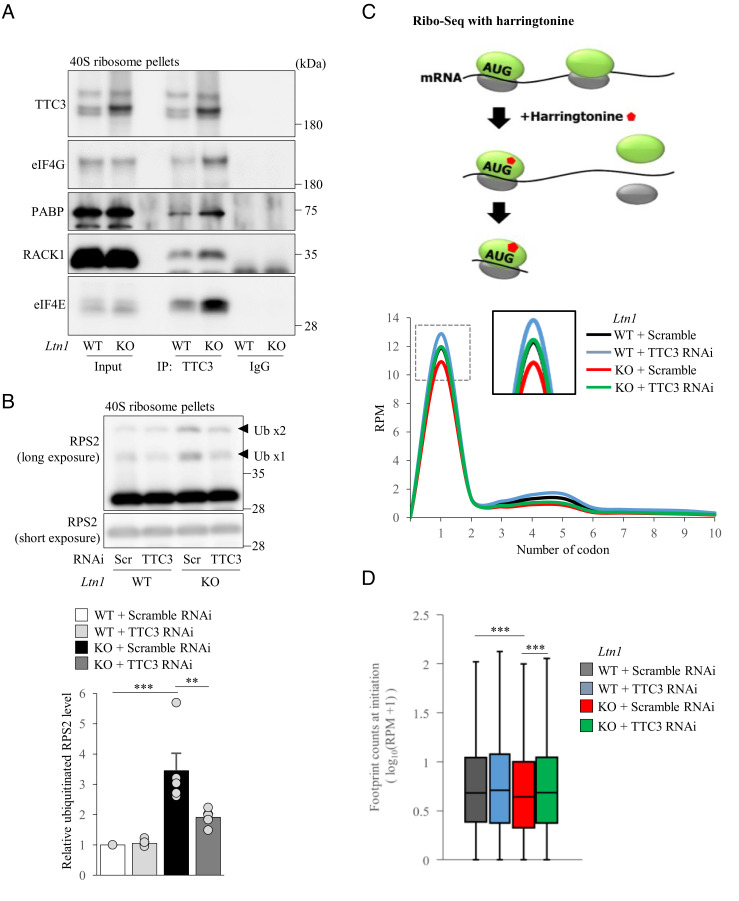
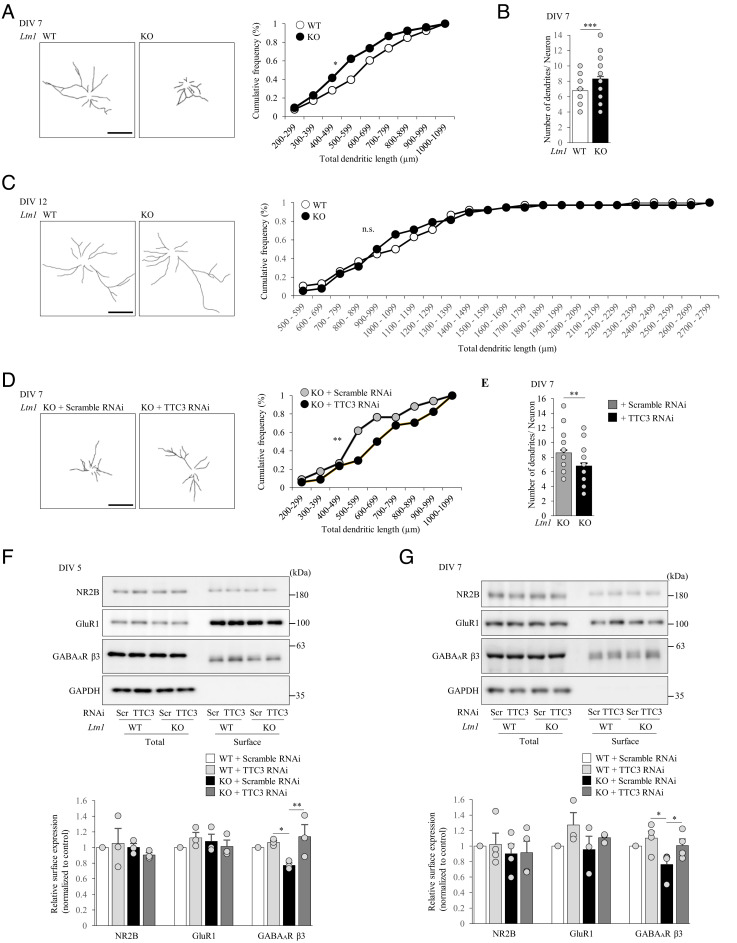
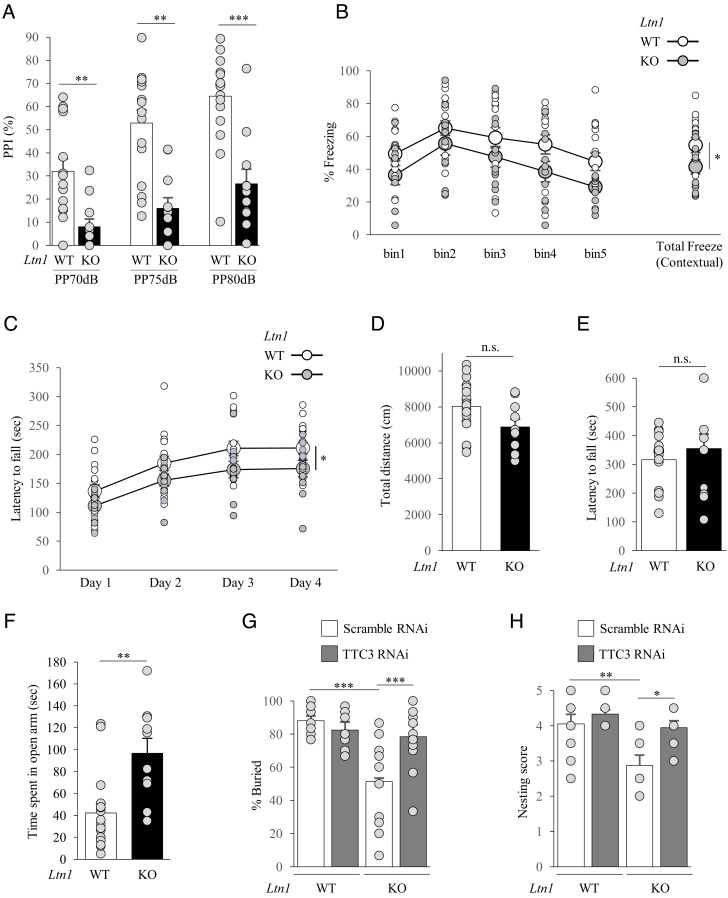
Ribosome-associated quality control (RQC) pathway is responsible for degradation of nascent polypeptides in aberrantly stalled ribosomes, and its defects may lead to neurological diseases. However, the underlying molecular mechanism of how RQC dysfunction elicits neurological disorders remains poorly understood. Here we revealed that neurons with knockout (KO) of ubiquitin ligase LTN1, a key gene in the RQC pathway, show developmental defects in neurons via upregulation of TTC3 and UFMylation signaling proteins. The abnormally enhanced TTC3 protein in Ltn1 KO neurons reduced further accumulation of translationally arrested products by preventing translation initiation of selective genes. However, the overaccumulated TTC3 protein in turn caused dendritic abnormalities and reduced surface-localized GABAA receptors during neuronal development. Ltn1 KO mice showed behavioral deficits associated with cognitive disorders, a subset of which were restored by TTC3 knockdown in medial prefrontal cortex. Together, the overactivated cellular compensatory mechanism against defective RQC through TTC3 overaccumulation induced synaptic and cognitive deficits. More broadly, these findings represent a novel cellular mechanism underlying neuronal dysfunctions triggered by exaggerated cellular stress response to accumulated abnormal translation products in neurons.

Keywords: TTC3; UFMylation; cognitive disorders; ribosome stalling; ribosome-associated quality control.


Conflict of interest statement

The authors declare no competing interest.

Figures

Fig. 1.
Fig. 1.
Quantitative proteomics approach using isolated 60S ribosome subunit fraction identified alterations of TTC3 and UFMylation signaling protein levels in LTN1-deficient neurons. (A) Quantitative proteomics data from isolated 60S ribosome subunit fraction (Left) and the list of candidate proteins with their SILAC scores (Right). (B) UFM1-conjugated proteins in neuronal lysates were detected by western blotting with an anti-UFM1 antibody. The signal intensities of UFMylated proteins were normalized to those of glyceraldehyde 3-phosphate dehydrogenase (GAPDH) and then expressed as the relative ratio of WT neurons (Right) (n = 3, ***P 0.000035, unpaired two-tailed Student’s t test). (C) UFMylated proteins in brain lysates from indicated regions were detected by western blotting. The signal intensities of UFMylated proteins were normalized to those of GAPDH and then expressed as the relative ratio of WT (Right). (n = 3, CTX: ***P 0.000002; STR; ***P 0.000002; HP: ***P 0.0000001; CB: ***P = 0.000098, unpaired two-tailed Student’s t test). (D) Protein level of TTC3 in neuronal lysates was detected by western blotting with an anti-TTC3 antibody. The signal intensities of TTC3 protein were normalized to those of GAPDH and then expressed as the relative ratio of WT neurons (Right) (= 5, ***P = 0.000008, unpaired two-tailed Student’s t test). (E) Protein levels of TTC3 in indicated brain regions were detected by western blotting with an anti-TTC3 antibody, and the signal intensities of TTC3 protein were normalized to those of GAPDH and then expressed as the relative ratio of WT (Right) (n = 3, CTX: ***P 0.00012; STR; ***P 0.0032; HP: ***P 0.00001; CB: ***P = 0.00033, unpaired two-tailed Student’s t test). CTX: cortex, STR: striatum, HP: hippocampus, CB: cerebellum. Throughout the figures, data represent means ± SEM.
Fig. 2.
Fig. 2.
TTC3 is localized in 40S subunits and partially stabilized by UFMylation signal pathway. (A) Ribosome-free (Free), 40S, 60S, 80S monosome and polysome fractions were isolated from cultured cortical neurons by sucrose gradient centrifugation, and TTC3 and RPS6 (control) proteins were detected by western blotting. (B) Endogenous TTC3 was stained with an anti-TTC3 antibody (red), and ER was visualized with an anti-calnexin antibody (green). (Scale bar, 25 μm.) (C) Cytosolic (Cyto) and ER-associated ribosome-enriched (ER-Ribo) fractions were isolated from cultured cortical neurons by the centrifugation method and subjected to western blotting with an anti-TTC3 antibody. Calnexin was detected as an ER-bound ribosome-enriched associated membrane (ER-Ribo) fraction marker, and GAPDH was used as a cytosolic marker. (D) Cultured cortical neurons were infected with lentivirus encoding scramble RNAi or UFM1 RNAi, and cytosolic (Cyto) and ER-bound ribosome-enriched associated membrane (ER-Ribo) fractions were isolated. The signal intensities of TTC3 protein were normalized to those of GAPDH for cytosolic fraction or to calnexin for ER-associated ribosome-enriched fraction and then expressed as the relative ratio of WT neurons infected with scramble RNAi (Right) [Cyto: n = 3, F(3, 6) = 43.7, = 0.0017; ER-Ribo: = 4, F(3, 9) = 21.9, = 0,0002, one-way ANOVA; **< 0.01, ***< 0.001, Bonferroni’s multiple comparison test post hoc]. (E) Cultured cortical neurons were infected with lentivirus encoding scramble RNAi or TTC3 RNAi, and cytosolic (Cyto) and ER-bound ribosome-enriched associated membrane (ER-Ribo) fractions were isolated. TTC3 and UFMylated proteins were detected by western blotting. The signal intensities of TTC3 protein were normalized to those of GAPDH for cytosolic fraction or calnexin for ER-Ribofraction and then expressed as the relative ratio of WT neurons (Right). [n = 3, Cyto: F(3, 6) = 1.59, P = 0.2877; ER-Ribo: F(3, 6) = 10.1, = 0.0093, one-way ANOVA; *< 0.05, Bonferroni’s multiple comparison test post hoc]. (F) Cultured cortical neurons with UFM1 KD were treated with or without 20 μM MG132 for 6 h, and ER-Ribo fraction was isolated. TTC3 was detected by western blotting. The signal intensities of TTC3 protein were normalized to those of calnexin and then expressed as the relative ratio of WT neurons infected with scramble RNAi and without MG132 treatment (Right). [n = 3, F(7, 14) = 41.7, < 0.0001, one-way ANOVA; **< 0.01, ***< 0.001, Bonferroni’s multiple comparison test post hoc]. (G) Cultured cortical neurons infected with indicated lentivirus were treated with or without 200 nM bafilomycin A (Baf) for 6 h, and ER-Ribo fraction was isolated. The signal intensities of TTC3 protein were normalized to those of calnexin and then expressed as the relative ratio of WT neurons infected with scramble RNAi, without Baf treatment (Right) [= 3, F(7, 14) = 43.7, < 0.0001; one-way ANOVA; **< 0.01, ***< 0.001, Bonferroni’s multiple comparison test post hoc]. n.s., not significant. Throughout the figures, data represent means ± SEM.
Fig. 3.
Fig. 3.
TTC3 protein level is increased by an overload of translationally arrested K24 products. (A) Cultured cortical neurons were first infected with lentivirus encoding scramble RNAi or TTC3 RNAi, followed by infection of AAV encoding SSER-CHO-EGFP-K24. Arrested products (AP; indicated by arrowhead) were detected by western blotting using an anti-GFP antibody. The signal intensities of arrested products were normalized to those of GAPDH and then expressed as the relative ratio of WT+Scramble RNAi neurons (Right) [= 5, F(3, 12) = 73.2, P < 0.0001; one-way ANOVA; **P < 0.01, ***P < 0.001, Bonferroni’s multiple comparison test post hoc]. An asterisk indicates non-specific band. (B) Cultured cortical neurons were treated with anisomycin for 4 h, and cyotosolic (cyto) and ER-associated ribosome-enriched (ER-Ribo) fractions were separated. The signal intensities of TTC3 protein were normalized to those of GAPDH for cytosolic fraction or calnexin for ER-associated ribosome-enriched fraction and then expressed as the relative ratio of WT neurons without anisomycin treatment (Bottom). [n = 3, Cyto: F(3, 6) = 34, P = 0.0004; ER-Ribo: F(3, 6) = 87.7, < 0.0001, one-way ANOVA; ***< 0.001, Bonferroni’s multiple comparison test post hoc]. n.s., not significant. (C) Cultured cortical neurons were infected with indicated AAVs and TTC3 were detected by western blotting using anti-TTC3 antibody. Arrested products (AP) and full-length proteins (FL) are indicated by arrowheads. The signal intensities of TTC3 protein were normalized to those of GAPDH and then expressed as the relative ratio of WT neurons infected with control AAVs [= 3, F(3, 6) = 30.1, = 0.0005, one-way ANOVA; *< 0.05, Bonferroni’s multiple comparison test post hoc]. An asterisk indicates non-specific band. (D) Total lysates (Top) or 60S ribosomal fractions (Bottom) were collected from cultured cortical neurons by sucrose gradient centrifugation, and ribosomes were further pelleted down (Bottom) and analyzed by western blotting with indicated antibodies. The signal intensities of NEMF were normalized to those of RPL26 and then expressed as the relative ratio of WT neurons infected with scramble RNAi [Total: n = 3, F(3, 8) = 2.21, P = 0.1649; 60S: n = 3, F(3, 6) = 26.3, P = 0.0008, one-way ANOVA; *P < 0.05, **P < 0.01, Bonferroni’s multiple comparison test post hoc]. Throughout the figures, data represent means ± SEM.
Fig. 4.
Fig. 4.
TTC3 reduces an overload of translationally arrested products by preventing translation initiation. (A) TTC3 was immunoprecipitated from pelleted 40S ribosome subunits, followed by western blotting using indicated antibodies. (B) 40S ribosome subunits pelleted from cultured cortical neurons were analyzed by western blotting with an anti-RPS2 antibody. The signal intensities of ubiquitinated RPS2 (arrowheads) were normalized to those of non-ubiquitinated RPS2 (= 5, F(3, 12) = 16.0, = 0.0002, one-way ANOVA; **P < 0.01, ***P < 0.001, Bonferroni’s multiple comparison test post hoc). (C and D) Ribosome profiling data of harringtonine-treated WT or Ltn1 KO neurons. (C) Metagene analysis of footprint counts in the first ten codons in WT or Ltn1 KO neurons with scramble or TTC3 RNAi. (D) Normalized footprint counts at the translation initiation (ATG) site (= 2.571 × 10−8, Kruskal–Wallis test; ***< 0.001, Bonferroni-corrected Wilcoxon–Mann–Whitney’s multiple comparison test post hoc). Throughout the figures, data represent means ± SEM.
Fig. 5.
Fig. 5.
Dendritic outgrowth and synaptic homeostasis are impaired in Ltn1 KO neurons partially due to the overaccumulation of TTC3 protein. (A) Dendrites of cultured cortical neurons at DIV 7 were stained with an anti-MAP2 antibody. Left panels show representative tracings of dendritic morphology. Total dendritic length was measured (Right) (= 34, *= 0.029, Kolmogorov–Smirnov test). (B) Cultured cortical neurons at DIV 7 were stained with an anti-MAP2 antibody, and the number of dendrites per neuron was counted (= 34 **= 0.001174, unpaired two-tailed Student’s t test). (C) Total dendritic length of neurons at DIV 12 was measured as in (A) (= 38, = 0.7306, Kolmogorov–Smirnov test). (D and E) Cultured cortical Ltn1 KO neurons infected with indicated lentivirus were stained with an anti-MAP2 antibody at DIV 7. (D) Representative tracing of MAP2 positive dendrites is shown (Left). Total dendritic length was measured (Right) (= 30, **= 0.0062, Kolmogorov–Smirnov test). (E) The number of dendrites per neurons was counted (= 30, *= 0.0146, unpaired two-tailed Student’s t test). (F) Surface-localized proteins in cultured cortical neurons at DIV 5 were biotinylated, and the surface-biotinylated proteins were pulled down from 50 μg of total neuronal lysates by streptavidin-conjugated beads, followed by western blotting with indicated antibodies (Left). GAPDH was used as negative controls. The relative amounts of surface-localized proteins are shown (Right) (n = 3, NR2B: F(3, 6) = 0.535, P = 0.6749; GluR1: F(3, 6) = 1.75, = 0.2495; GABAAβ3: F(3, 6) = 5.95, P = 0.0313, one-way ANOVA; *P < 0.05, **< 0.01, Bonferroni’s multiple comparison test post hoc). (G) Surface-localized proteins in cultured cortical neurons at DIV 7 were analyzed as in (F) (NR2B: = 4, F(3, 9) = 0.575, = 0.6458; GluR1: F(3, 8) = 1.40, = 0.6458; GABAAβ3: F(3, 9) = 4.27, = 0.0391, one-way ANOVA; *P < 0.05, Bonferroni’s multiple comparison test post hoc). n.s., not significant. (Scale bars, 100 μm.) Throughout the figures, data represent means ± SEM.
Fig. 6.
Fig. 6.
Ltn1 KO mice show behavioral deficits associated with cognitive disorders partially though overaccumulation of TTC3 protein. (A) In PPI test, Ltn1 KO mice showed a reduced PPI response. PPI values at three different prepulse intensities (70 dB, 75 dB and 80 dB) are shown. n = 17 (WT), n = 11 (Ltn1 KO) (70 dB: P = 0.003; 75 dB: = 0.001; 80 dB: = 0.0006; two-tailed Mann–Whitney test). (B) In contextual fear conditioning test, Ltn1 KO mice spent less time freezing than WT mice. Percent time of freezing during 5 min of the context test is shown. = 17 (WT), = 11 (Ltn1 KO) (= 0.0455; two-tailed Mann–Whitney test). (C) The latency to fall off the rotarod was recorded and Ltn1 KO mice showed impaired motor function. = 17 (WT), = 11 (Ltn1 KO) (= 0.033; two-tailed Mann–Whitney test). (D) Distance traveled in the open field test. = 14 (WT), = 10 (Ltn1 KO). No statistical differences were detected. (= 0.8274; two-tailed Mann–Whitney test). (E) Measurement of forearm grip strength. Grip strength was comparable between the two mice groups. = 14 (WT), = 11 (Ltn1 KO). No statistical differences were detected. (= 0.459; two-tailed Mann–Whitney test). (F) In EPM test, Ltn1 KO mice spent longer time in open arm and showed reduced anxiety. = 17 (WT), = 10 (Ltn1 KO) (= 0.0017; two-tailed Mann–Whitney test). (G and H) AAV encoding scramble or TTC3 RNAi was stereotaxically injected into mouse mPFC. (G) Marble-burying test showed that marble-burying behavior is reduced in Ltn1 KO mice and exhibited a blunted response to the aversive situation that was normalized by KD of TTC3. = 14, 14, 13, 14 for WT + Scramble RNAi, WT + TTC3 RNAi, KO+Scramble RNAi, and KO + TTC3 RNAi, respectively. [F(3,49) = 12.6, < 0.0001, one-way ANOVA; ***< 0.001, Bonferroni’s multiple comparison test post hoc]. (H) Defects in nesting behavior were observed for Ltn1 KO mice that was rescued by KD of TTC3. = 10, 9, 8, 9 for WT + Scramble RNAi, WT + TTC3 RNAi, KO + Scramble RNAi, and KO + TTC3 RNAi, respectively. [F(3, 32) = 7.09, = 0.0009, one-way ANOVA; *< 0.05, **< 0.01, Bonferroni’s multiple comparison test post hoc]. n.s., not significant. Throughout the figures, data represent means ± SEM.

References

    1. Hartl F. U., Protein misfolding diseases. Annu. Rev. Biochem. 86, 21–26 (2017). - PubMed
    1. Hipp M. S., Kasturi R., Hartl F. U., The proteostasis network and its decline in ageing. Nat. Rev. Mol. Cell Biol. 20, 421–435 (2017). - PubMed
    1. Balchin D., Hayer-Hartl M., Hartl F. U., In vivo aspects of protein folding and quality control. Science 353, aac4354 (2016). - PubMed
    1. Brandman O., et al. , A Ribosome-bound quality control complex triggers degradation of nascent peptides and signals translation stress. Cell 151, 1042–1054 (2012). - PMC - PubMed
    1. Joazeiro C. A. P., Mechanisms and functions of ribosome-associated protein quality control. Nat. Rev. Mol. Cell Biol. 20, 368–383 (2019). - PMC - PubMed

Publication types

Substances