. 2023 Mar 13;41(3):620-636.e9.
doi: 10.1016/j.ccell.2023.02.005.

Tumor PD-L1 engages myeloid PD-1 to suppress type I interferon to impair cytotoxic T lymphocyte recruitment

Affiliations

Tumor PD-L1 engages myeloid PD-1 to suppress type I interferon to impair cytotoxic T lymphocyte recruitment

John D Klement et al. Cancer Cell. .

Abstract

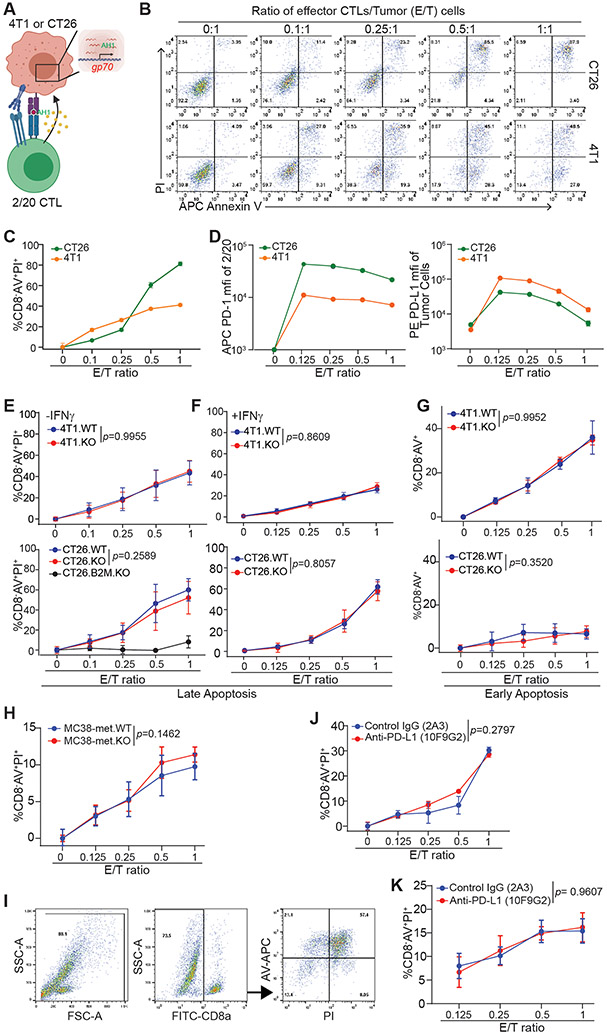
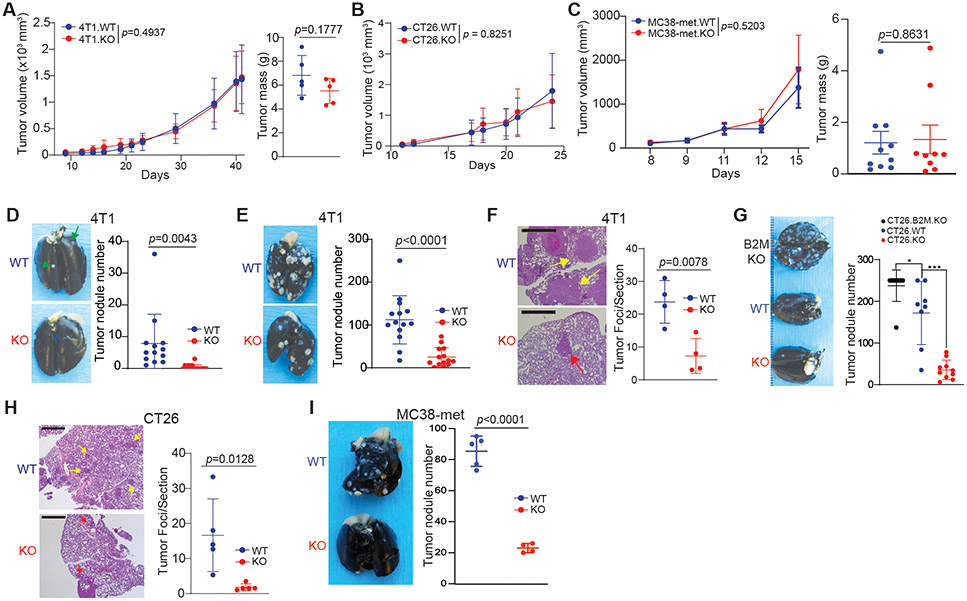
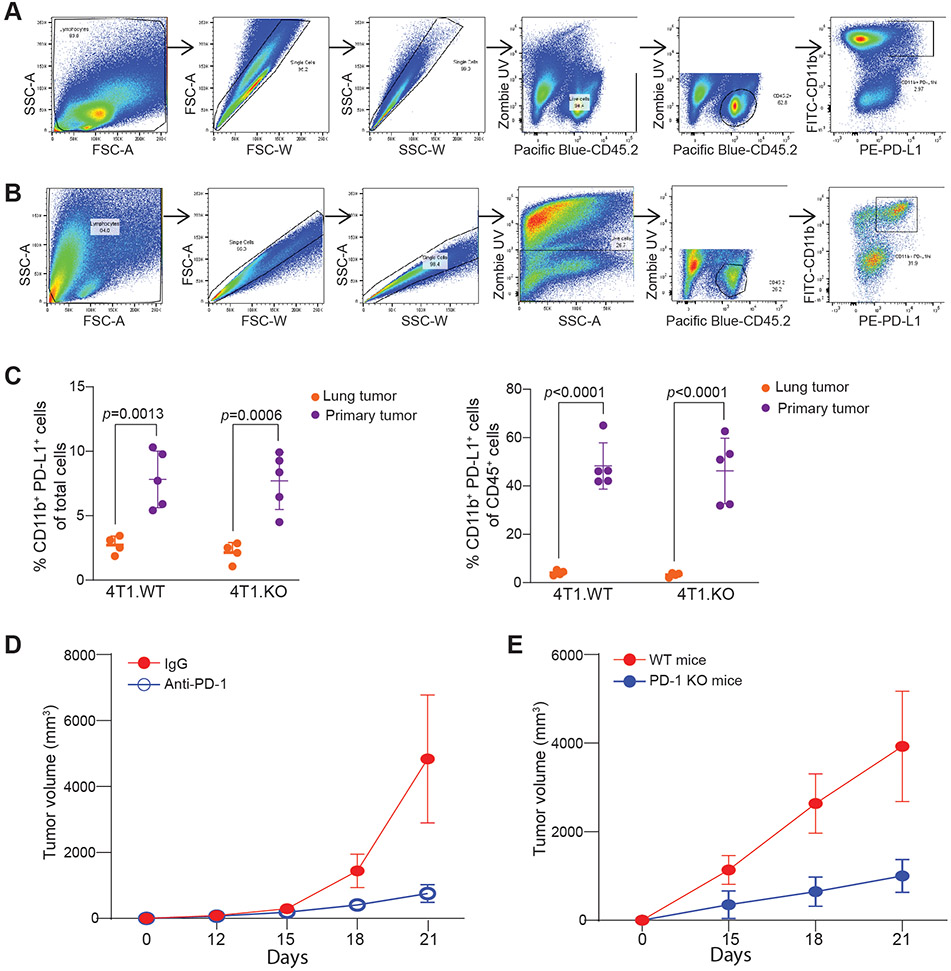
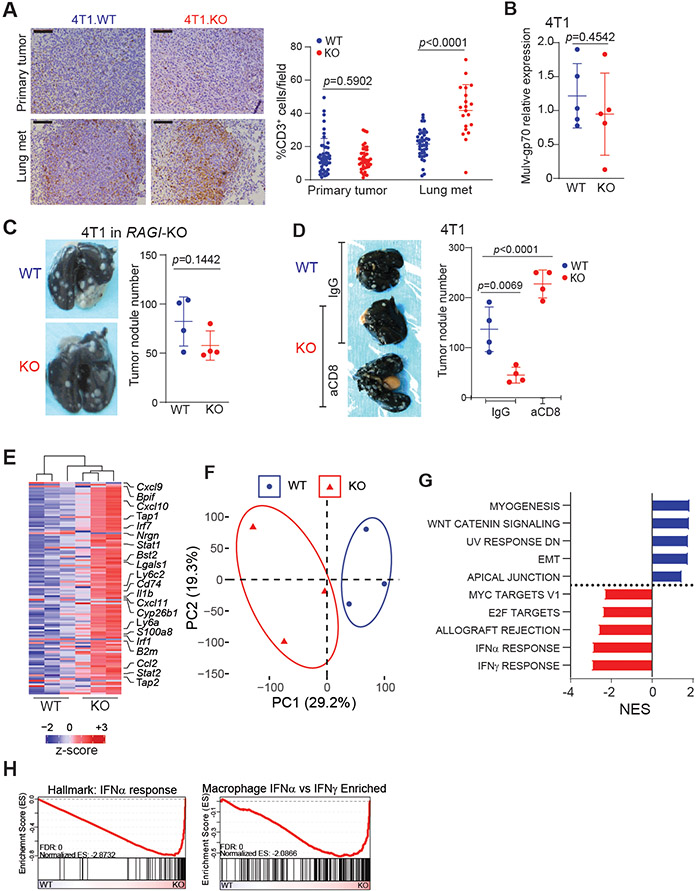
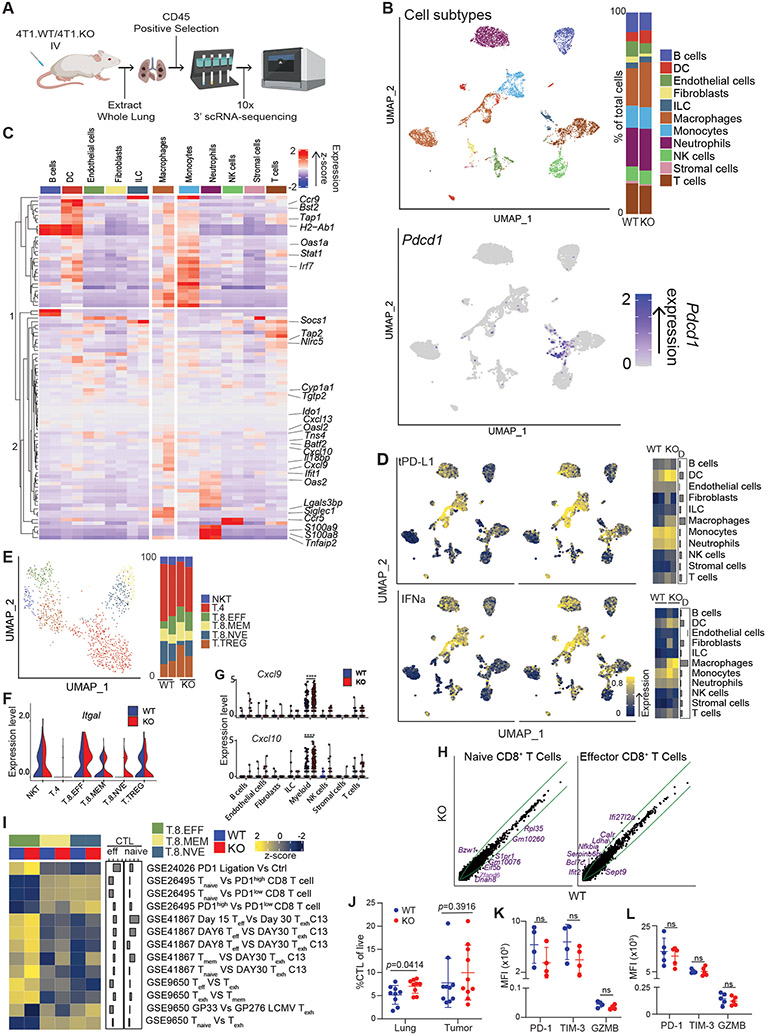
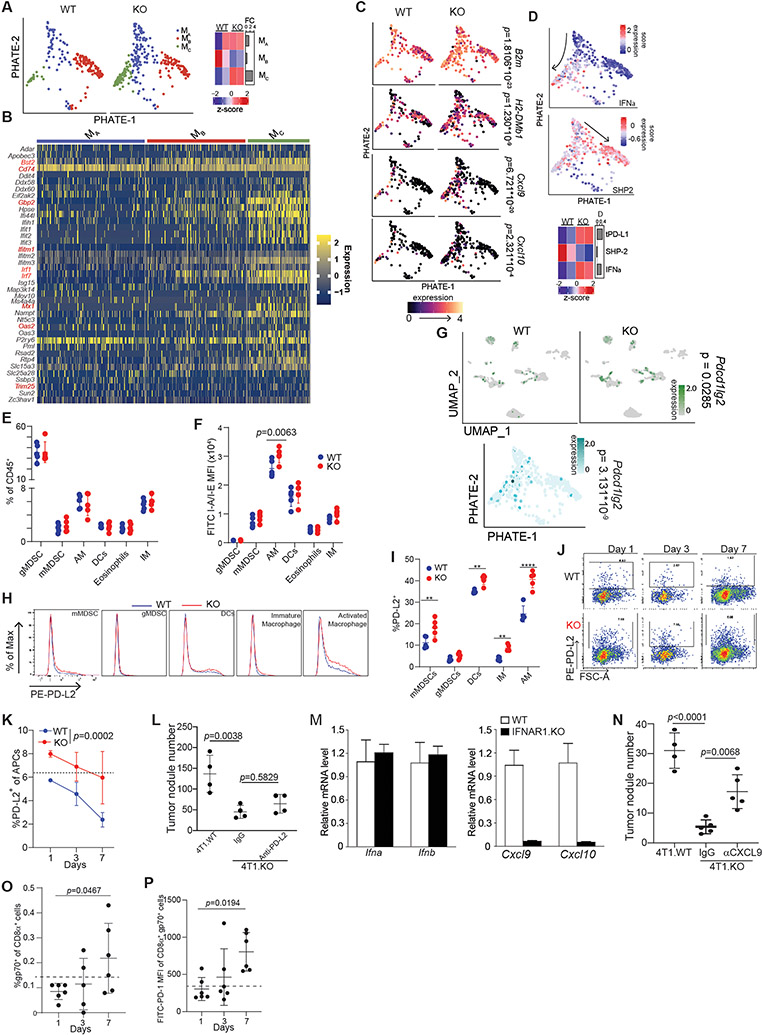
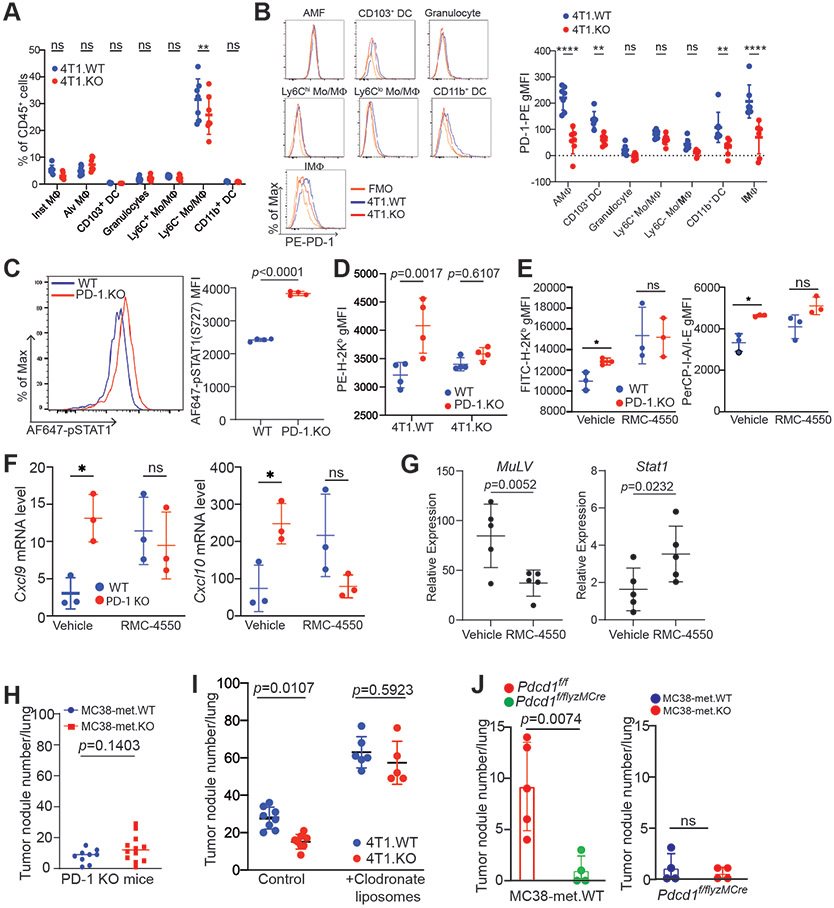
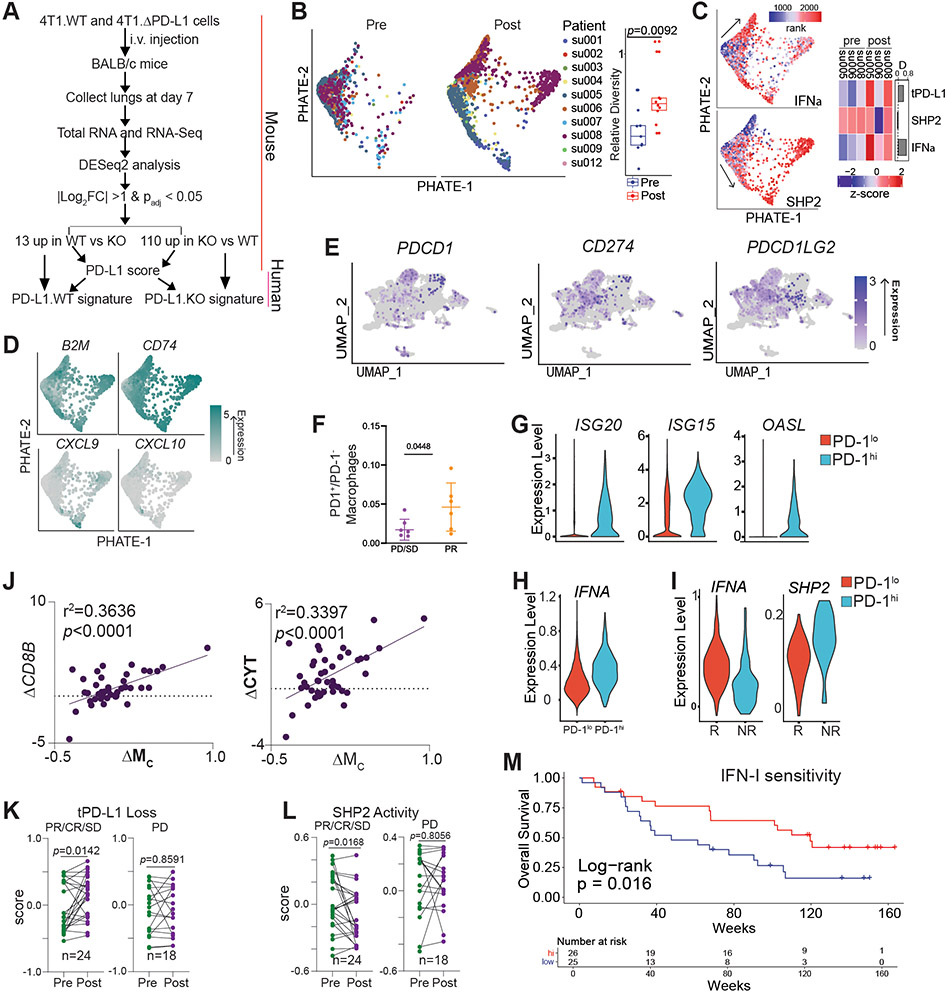
The cellular and molecular mechanisms underlying tumor cell PD-L1 (tPD-L1) function in tumor immune evasion are incompletely understood. We report here that tPD-L1 does not suppress cytotoxic T lymphocyte (CTL) activity in co-cultures of tumor cells and tumor-specific CTLs and exhibits no effect on primary tumor growth. However, deleting tPD-L1 decreases lung metastasis in a CTL-dependent manner in tumor-bearing mice. Depletion of myeloid cells or knocking out PD-1 in myeloid cells (mPD-1) impairs tPD-L1 promotion of tumor lung metastasis in mice. Single-cell RNA sequencing (scRNA-seq) reveals that tPD-L1 engages mPD-1 to activate SHP2 to antagonize the type I interferon (IFN-I) and STAT1 pathway to repress Cxcl9 and impair CTL recruitment to lung metastases. Human cancer patient response to PD-1 blockade immunotherapy correlates with IFN-I response in myeloid cells. Our findings determine that tPD-L1 engages mPD-1 to activate SHP2 to suppress the IFN-I-STAT1-CXCL9 pathway to impair CTL tumor recruitment in lung metastasis.

Keywords: CTL; CXCL9; PD-1; PD-L1; SHP2; immune checkpoint blockade; lung metastasis; type I interferon.


Conflict of interest statement

Declaration of interests The authors declare no competing interests.

Figures

Figure 1.
Figure 1.. tPD-L1 does not confer direct protection from CTL killing.
A. Schematic of co-culture system. B. Representative images of tumor cell apoptosis following co-culture with 2/20 CTLs at indicated ratios for approximately 24 h. Plots are gated on CD8α cells. C. Cell death quantification of target cells (CD8AV+PI+) by flow cytometry following co-culture. N = 3/condition. D. Surface protein expression of PD-1 on 2/20 and PD-L1 on tumor cells following overnight co-culture at indicated Effector/Target (E/T) ratios. N=3/condition. E-F. Cell death after overnight co-culture following no pretreatment (E) or pretreatment with IFNγ (F). N=6/condition. G. Proportion of early apoptotic cells after four hours of co-culture at indicated ratios. H. Cell death of MC38-met derivatives stimulated with OVA peptide (SIINFEKL) after 28 h of co-culture with activated OT-1 cells. N=4/condition. I-K. Gating strategy (I) and cell death of CT26 (J) and 4T1 (K) following co-culture in 2/20 in the presence of indicated neutralizing antibodies. N=4-6/condition. All data shown as mean ± SD. See also Figures S1 and S2.
Figure 2.
Figure 2.. tPD-L1 selectively enhances metastasis independently of primary tumor growth.
A. Tumor growth curves (left) and final mass (right) of 4T1.scramble (4T1.WT, 5x10⁵ cells/mouse) and 4T1.PD-L1-KO (4T1.KO, 5x10⁵ cells/mouse) following orthotopic injection. Representative of three independent experiments. N= 5-15/condition. 2-way ANOVA. B. Tumor growth curve of CT26.scramble (CT26.WT, 1x10⁶ cells/mouse) and CT26.PD-L1.KO (CT26.KO, 1x10⁶ cells/mouse) following subcutaneous injection. N=5/condition. 2-way ANOVA. C. Growth curves (left) and final mass (right) of MC38-met.scramble (MC38-met.WT, 1x10⁶ cells/mouse) and MC38-met.PD-L1.KO (MC38-met.KO, 1x10⁶ cells/mouse) following subcutaneous injection. Representative of two independent experiments. N=10/condition. 2-way ANOVA. D. 4T1.WT and 4T1.KO spontaneous metastasis to the lung following orthotopic injection. N= 5-10/condition, two independent experiments. 2-way ANOVA. E & F. Quantification of 4T1 experimental metastatic foci by visual (E, N=15/condition) and microscopic (F, N=4/condition) inspection. Scale: 1 mm. The arrows point to tumor nodules present on the pleural surface. G & H. CT26.WT and CT26.KO cells were injected intravenously to BALB/c mice. Quantification of CT26 experimental metastatic foci by visual (G, N=10/condition) and microscopic (H, N=5/condition) inspection. Scale: 1 mm. The arrows point to tumor nodules. I. MC38-WT and MC38-met.KO cells were injected intravenously to C57BL/6 mice. Quantification of MC38-met experimental metastatic foci by visual inspection (N=8-9/condition). All data are presented in mean ± SD. See also Figure S3.
Figure 3.
Figure 3.. The primary tumor harbors significant more PD-L1+ myeloid cells than lung metastases.
A-B. Gating strategy of primary tumor (A) and tumor-bearing lungs (B) to analyze myeloid PD-L1+ population. C. 4T1 derivatives were injected orthotopically into the mammary fat pad. Proportion of myeloid PD-L1+ cells in live (left) and immune (right) cell populations from primary tumor or metastasis-bearing lungs. Representative of two independent experiments. N = 5/condition. 2-way ANOVA. D. MC38-met (2.5x10⁵ cells/mouse) was injected subcutaneously into C57BL/6 and treated with PD-1 blockade therapy or control IgG. Tumor volume was measured every 3 days following detection of palpable mass. N=5/condition. E. MC-38-met was injected into C57BL/6 (WT) or Pdcd1−/− mice. Tumor volume was measured every three days following detection of palpable mass. All data represent mean ± SD.
Figure 4.
Figure 4.. Loss of tPD-L1 limits metastasis by amplifying inflammatory and CTL-driven responses.
A. Representative images (left) and quantification (right) of IHC for CD3 protein in the indicated tumor tissues. Pooled from two independent experiments. N=8/condition. Scale: 1mm. B. 4T1.WT and 4T1.KO cells were injected intravenously to BALB/c mice. Lungs were harvested 24 h after tumor cell injection and analyzed by qPCR for gp70 mRNA level. Two independent experiments. N=5/condition. C. Representative image (left) and quantification (right) of experimental metastasis of 4T1 in BALB/c RAGIKO mice (N=4/condition), two independent experiments. D. Representative image (left) and quantification (right) of tumor nodules following CD8 depletion. (N=4/condition). E. Heatmap of top 125 most variably expressed genes detected in lungs colonized by 4T1.WT or 4T1.KO. F. Principal component analysis. G. Top 5 enriched gene signatures from MSigDB Hallmarks signature set in 4T1.WT (blue) or 4T1.KO (red) colonized lungs based on normalized enrichment score (NES). H. Enrichment plot of indicated signatures. All data represent mean ± SD. See also Figure S4.
Figure 5.
Figure 5.. CTL activation and differentiation is independent of tPD-L1.
A. Schematic for scRNA-sequencing of 4T1-colonized lungs. B. UMAP projection (left) and barplot of identities of the subpopulation of the CD45+ cells (right) in 4T1 colonized lungs. C. Heatmap of indicated transcript expression in listed cell populations. For each cell population, left column represents WT expression, while right column represents KO expression. D. Single-cell scoring of tPD-L1 loss (top) and IFNα (bottom) signature. Left plot includes cells derived from WT-colonized lungs, while right column represents KO-colonized lungs. E. UMAP projection of k-means clusters of T Cells (left) and barplot of identities of the subpopulations of T cells (Right). F. Violin plots of indicated transcripts. NKT: NK T cells, T.4: CD4+ T cells, T.8.EFF: Effector CD8+ T cells, T.8.MEM: Memory CD8+ T cells, T.8.NVE: Naïve CD8+ T cells, T.TREG: Treg cells. G. Dot plots of the indicated transcripts in the indicated cell subpopulations. H. Expression of all transcripts in WT (x-axis) and KO (y-axis) T cells of indicated populations. Green lines represent 1.5-fold difference in transcription between populations. I. Expression of exhaustion-associated signatures in each cluster. J. CTL infiltration of primary tumor or lung metastases. N=10/condition K-L. Surface marker expression of CTLs isolated from lung metastases (K) or primary tumor (L). N=5/condition. **** p<0.0001. All data represent mean ± SD. See also Figure S5.
Figure 6.
Figure 6.. tPD-L1 restrains IFN-I-driven myeloid cell activation.
A. PHATE projection of non-alveolar macrophage population (left) and proportion of cells belonging to each cluster (right). B. Dimensional heatmap of top ten most variably expressed ISG genes in each cluster. C-D. Expression of indicated genes (C) and signatures (D) in cells. P-value calculated by Seurat “FindMarkers” function of cluster Mc vs Mb expression. E-F. Myeloid composition (E) and MHC class II expression (F) fourteen days post-colonization. Two independent experiments. N = 3,5/condition. Two-way ANOVA with Sidak’s multiple comparison. G. Differential expression of PD-L2 in lungs colonized by 4T1 WT or PD-L1-KO. H. Representative histograms of PD-L2 surface expression on indicated cell populations after colonization by 4T1 WT (blue) or 4T1 PDL1-KO (red). I. Quantification of % PD-L2+ cells in indicated cell populations. N=5/condition. J-K. Representative plots (J) and quantification (K) of % PD-L2+ antigen-presenting cells (CD45+CD11c+Ly6G) at indicated time points. Results are representative of two independent experiments. Two-way ANOVA. N=3,5/condition. L. 4T1.WT and 4T1.KO cells were injected to mice intravenously. The 4T1.KO mice were then treated with IgG or anti-PD-L2 5 days later every 2 days for 3 times. Shown are quantification of lung tumor nodule number. M. C57BL6 and IFNAR1 KO mice were injected with 100 μg MCA subcutaneously. Tumors were collected and analyzed by qPCR for Cxcl9 and Cxcl10 expression level using β-actin as internal control. N. BALB/c mice were subjected to experimental metastasis model with indicated 4T1 derivatives (5x10⁵ cells/mouse, i.v.). Mice were treated with anti-CXCL9 or control IgG (200ug, i.p) every 3 days. Lungs were harvested and metastatic foci visually quantified. O. & P. Quantification (O) and PD-1 expression (P) of gp70-tetramer+ cells in 4T1 WT or PDL1-KO colonized lungs at indicated timepoints. N=6/condition. Dotted line represents Fluorescence Minus One (FMO) baseline. Results are representative of two independent experiments. Fisher’s Exact Test. ** p<0.01; **** p<0.0001. All data represent mean ± SD. See also Figure S6 and S7.
Figure 7.
Figure 7.. Myeloid PD-1 connects tumor PD-L1 to CTL suppression through suppressing IFN-I signaling following tPD-L1 engagement.
A. Myeloid cell composition in mouse lung fourteen days following injection of indicated 4T1 cell line derivatives. B. Representative histograms (left) and quantification (right) of PD-1 expression on the indicated myeloid cell subsets isolated from 4T1.WT or 4T1.KO colonized lungs fourteen days after injection. N=5/condition. Two-way ANOVA with multiple comparisons. Two independent experiments. C. Mouse bone-marrow-derived macrophages (BMDM) from WT or Pdcd1 KO mice were co-cultured with 4T1.WT or 4T1.KO for two days, and stained intracellularly for STAT1 phosphorylation. Left: Representative histogram. Right: Summary statistics. Data representative of two independent experiments. D. Mouse BMDM from WT B6 or Pdcd1 KO mice were co-cultured with 4T1.WT or 4T1.KO for two days. Surface marker H2Kb expression was analyzed on live CD11b+F4/80+ cells. N = 3-4. Data representative of two independent experiments. E. Mouse BMDM from WT BALB/c mice were co-cultured with 4T1.WT and treated with vehicle (DMSO) or RMC-4550 (1μM) for thirty-six hours, then assayed for cell surface marker expression by flow cytometry. Representative of two independent experiments. F. qPCR of indicated gene targets from RNA harvested from BMDM from WT BALB/c mice that were co-cultured with 4T1.WT and treated with vehicle (DMSO) or RMC-4550 (1μM) for eighteen hours. Representative of two independent experiments. G. Mice were injected with 4T1.WT (i.v., 5x10⁵ cells/mouse) and treated with vehicle or RMC-4550. Lung tissue was harvested at fourteen-days post-injection, and RNA was harvested from cell lysate. qPCR of indicated gene targets. H. MC38-met.WT and MC38-met.KO cells were injected intravenously to Pdcd1 KO mice. Mice were sacrificed 15 days after tumor cell injection. Tumor nodules were quantified. Each dot represents lung tumor nodule number in a mouse. I. 4T1.WT and 4T1. tumor-bearing mice (n=5-8) were treated with control liposomes or clodronate liposomes, respectively, one day prior tumor cell injection. The tumor-bearing mice were treated every 3 days with control or clodronate liposomes for 3 times. Mouse lungs were quantified for tumor nodule numbers. Shown are one of two representative experiments. J. Left panel: MC38-met.WT cells were injected i.v. to WT mice (Pdcd1f/f, n=5) and mice with myeloid cell-specific Pdcd1 deletion (Pdcd1f/f lyzMCre, n=4), respectively. Mice were sacrificed 15 days after tumor cell injection and tumor nodules were quantified. Right panel: MC38-met.WT and MC38-met.KO cells were injected i.v. to mice with myeloid cell-specific Pdcd1 deletion (Pdcd1f/f lyzMCre, n=4 each group). Lung tumor nodules were quantified as in the left panel. All statistical tests performed by Student's T-test or two-way ANOVA with Holm-Sidaks test for multiple comparisons unless otherwise stated, ns: p>0.05; * p<0.05; ** p<0.01; *** p<0.001. All data represent mean ± SD. See also Figure S7.
Figure 8.
Figure 8.. PD-1 blockade releases macrophage interferon signaling and production in human cancer patients.
A. Schematic for generation of tPD-L1 loss genomic signature. B. PHATE projection of metastatic basal cell cancer pre- and post-PD-1 blockade (left) and average cell displacement (see methods) ent (right). Right box plot: top line: 3rd quartile, low line: 1st quartile, middle line: medium. Student’s t test. C. Single cell scoring of indicated signatures (left) and heatmap of sample averages (right). D. Single cell expression of indicated genes, with expression imputed by Rmagic. E. UMAP plot of re-analysis of locally invasive or metastatic human breast cancer patients detailing expression of indicated transcripts. F. Proportion of PD-1+ macrophages in patients with indicated response to atezolizumab therapy. PD: Progressive Disease; SD: Stable Disease; PR: Partial Response. G. Expression of indicated transcripts in PD-1lo(no PDCD1transcript detected) macrophages compared to PD-1hi(PDCD1transcript detected) macrophages. H. Expression of Ifna signature in indicated cell populations. I. Expression of gene signatures in PD-1hi macrophages following treatment with atezolizumab in indicated patient populations. J. Correlation of change in indicated transcripts after nivolumab treatment in metastatic melanoma cohort (BMS038). K. Change in tPD-L1 loss and SHP2 activity signature (BMS038). Paired t-test. L. Correlation between change in indicated signatures pre- and post-nivolumab therapy (BMS038). M. Survival analysis of IFN-I responsive and nonresponsive tumors pre and post PD-1 blockade. Two-sided Log-rank survival test. (BMS038).

References

    1. Dong H, Strome SE, Salomao DR, Tamura H, Hirano F, Flies DB, Roche PC, Lu J, Zhu G, Tamada K, et al. (2002). Tumor-associated B7-H1 promotes T-cell apoptosis: a potential mechanism of immune evasion. Nat Med 8, 793–800. 10.1038/nm730nm730 [pii]. - DOI - PubMed
    1. Hui E, Cheung J, Zhu J, Su X, Taylor MJ, Wallweber HA, Sasmal DK, Huang J, Kim JM, Mellman I, and Vale RD (2017). T cell costimulatory receptor CD28 is a primary target for PD-1-mediated inhibition. Science 355, 1428–1433. 10.1126/science.aaf1292. - DOI - PMC - PubMed
    1. Siddiqui I, Schaeuble K, Chennupati V, Fuertes Marraco SA, Calderon-Copete S, Pais Ferreira D, Carmona SJ, Scarpellino L, Gfeller D, Pradervand S, et al. (2019). Intratumoral Tcf1+PD-1+CD8+ T Cells with Stem-like Properties Promote Tumor Control in Response to Vaccination and Checkpoint Blockade Immunotherapy. Immunity 50, 195–211.e110. 10.1016/j.immuni.2018.12.021. - DOI - PubMed
    1. Tumeh PC, Harview CL, Yearley JH, Shintaku IP, Taylor EJ, Robert L, Chmielowski B, Spasic M, Henry G, Ciobanu V, et al. (2014). PD-1 blockade induces responses by inhibiting adaptive immune resistance. Nature 515, 568–571. 10.1038/nature13954. - DOI - PMC - PubMed
    1. Juneja VR, McGuire KA, Manguso RT, LaFleur MW, Collins N, Haining WN, Freeman GJ, and Sharpe AH (2017). PD-L1 on tumor cells is sufficient for immune evasion in immunogenic tumors and inhibits CD8 T cell cytotoxicity. J Exp Med 214, 895–904. 10.1084/jem.20160801. - DOI - PMC - PubMed

Publication types