. 2023 Apr 19;111(8):1222-1240.e9.
doi: 10.1016/j.neuron.2023.02.019. Epub 2023 Mar 13.

Gasdermin-E mediates mitochondrial damage in axons and neurodegeneration

Affiliations

Gasdermin-E mediates mitochondrial damage in axons and neurodegeneration

Dylan V Neel et al. Neuron. .

Abstract

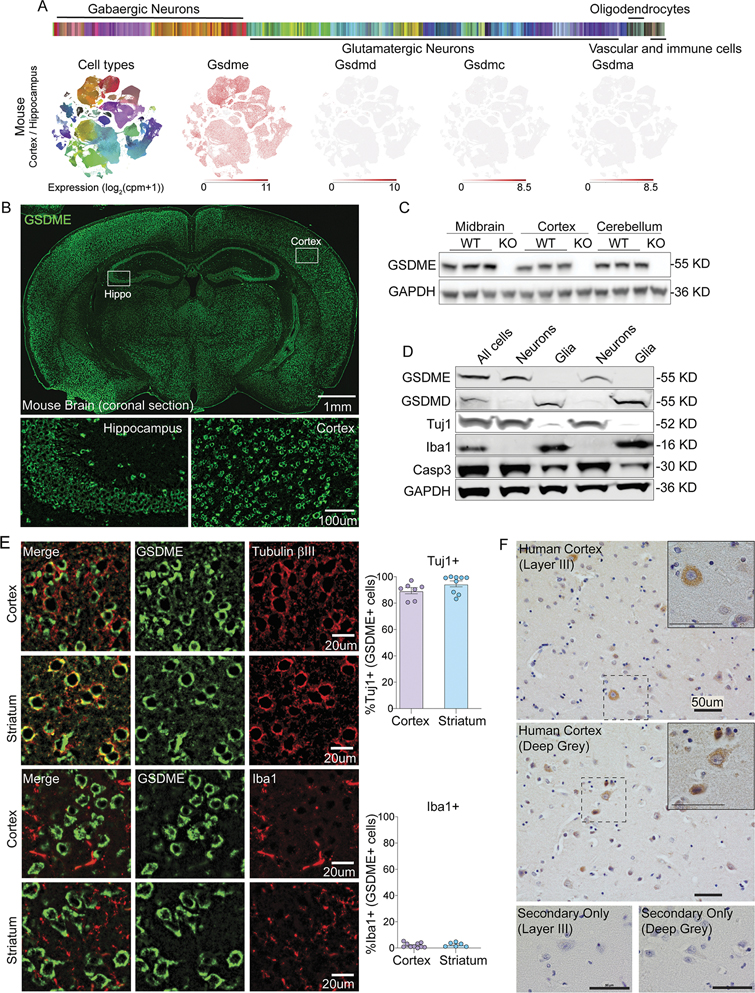
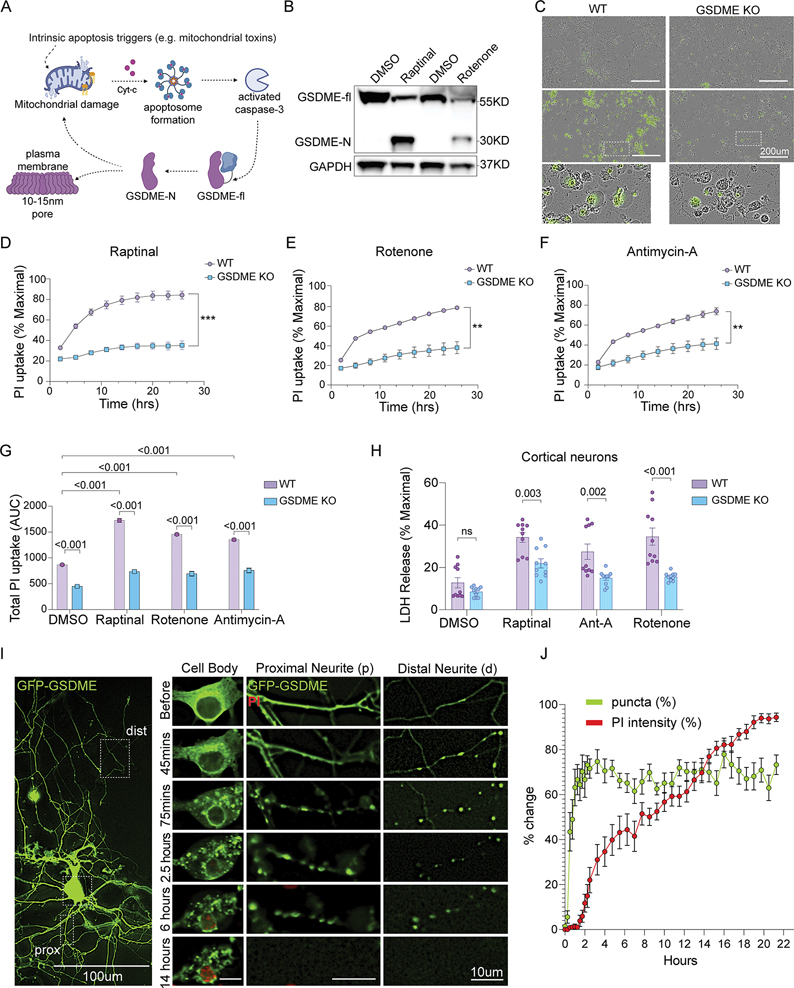
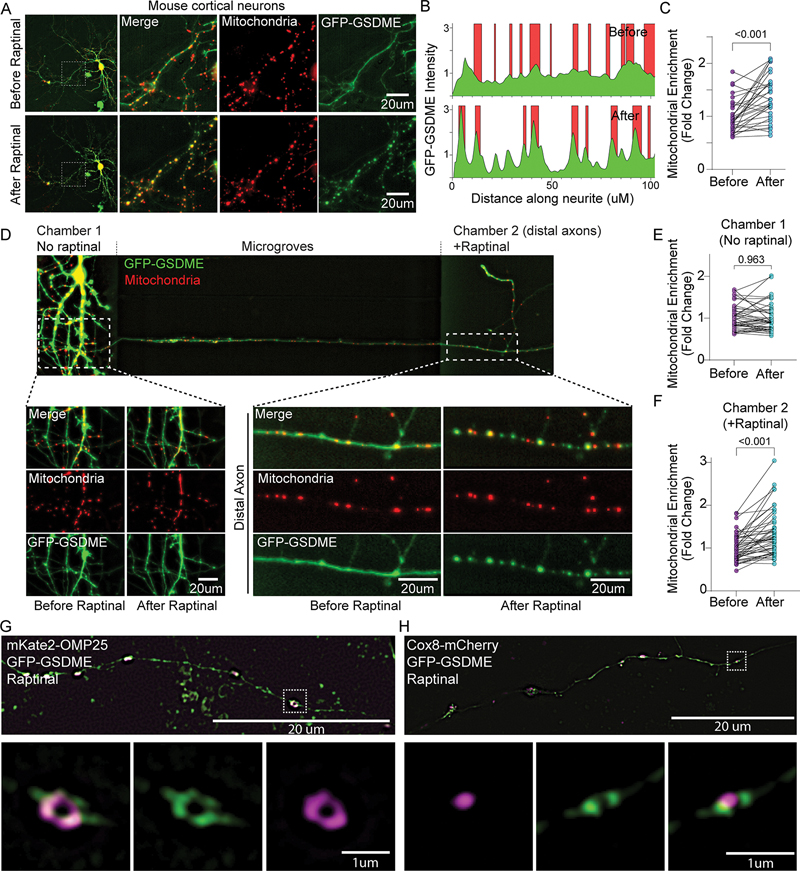
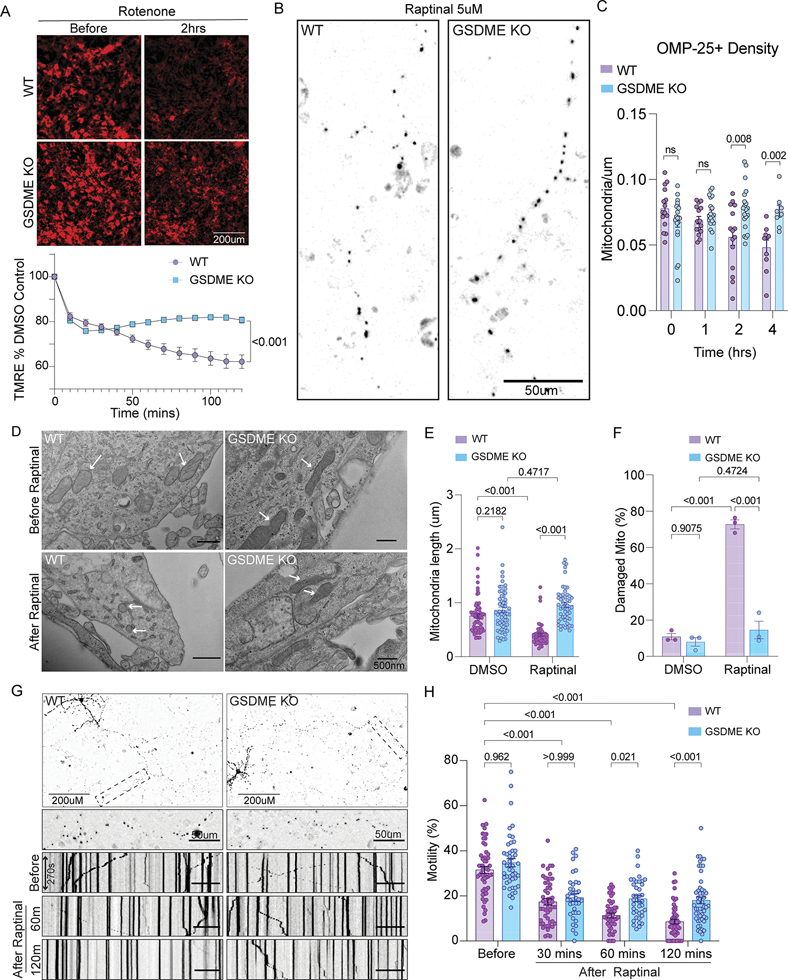
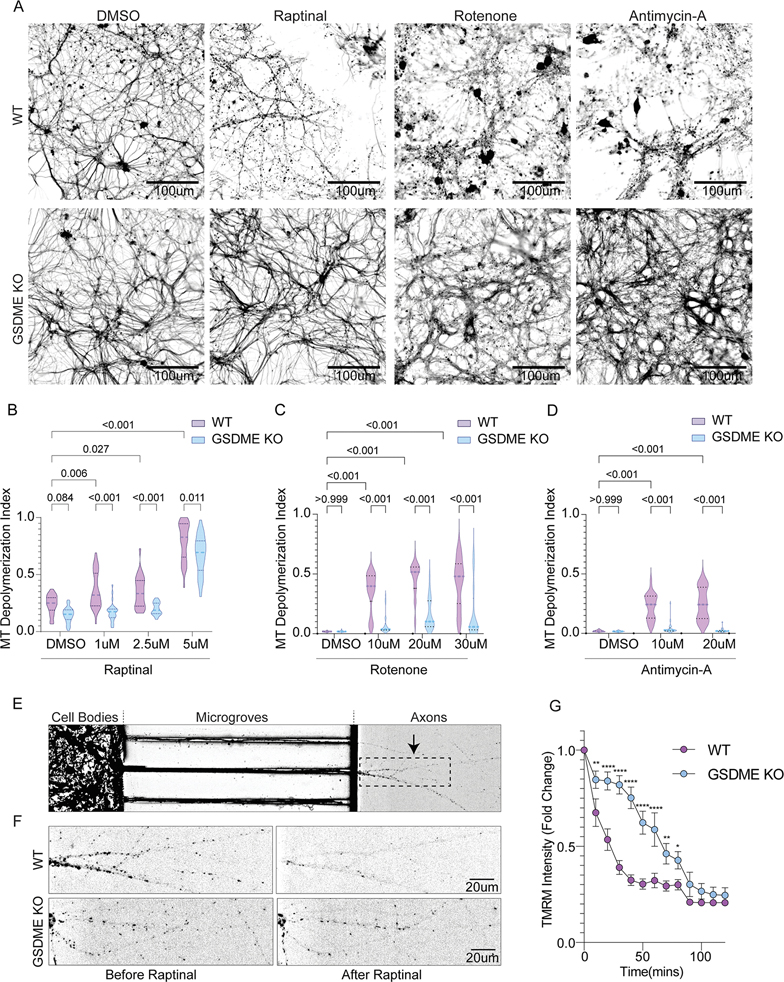
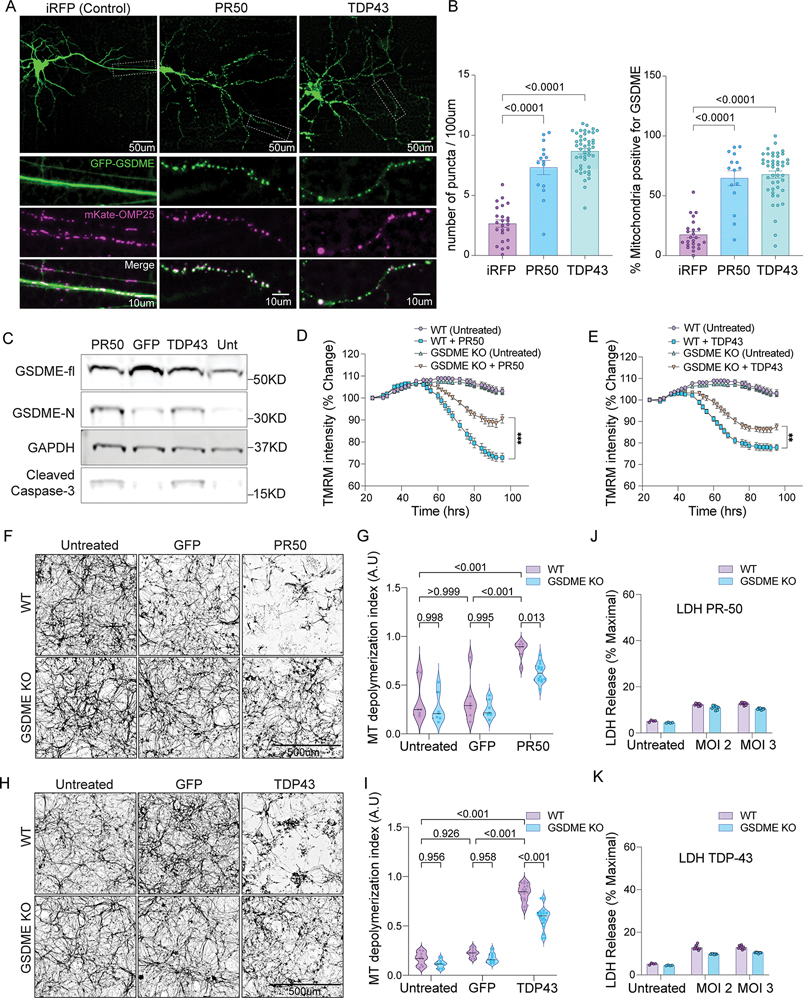
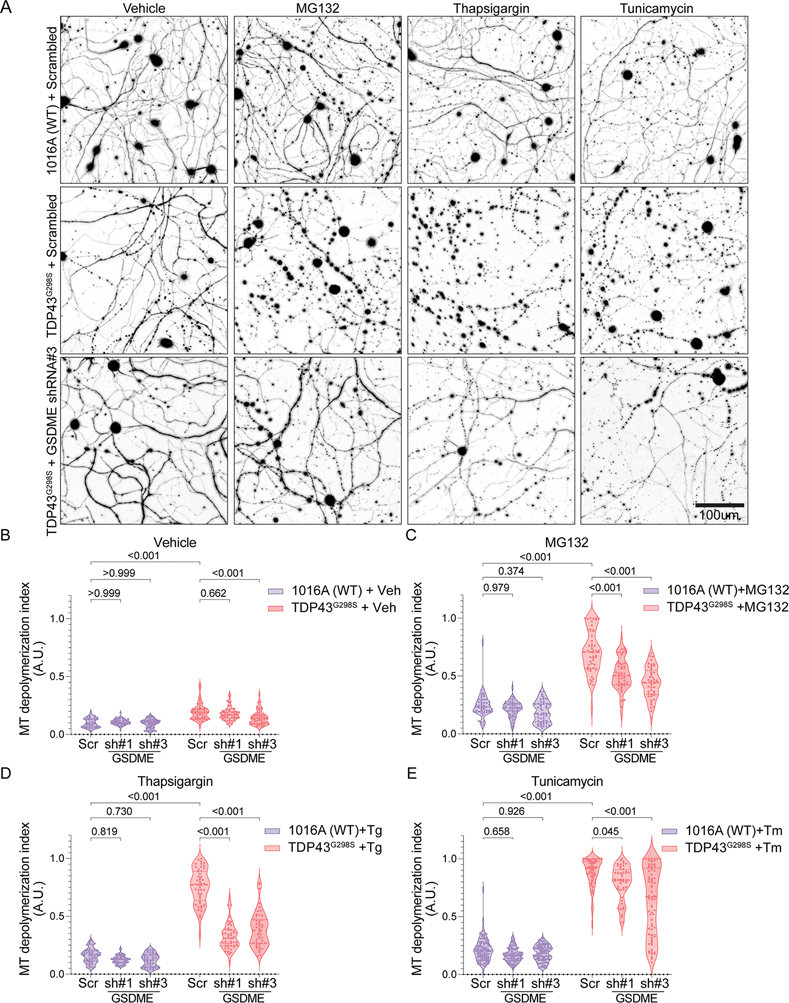
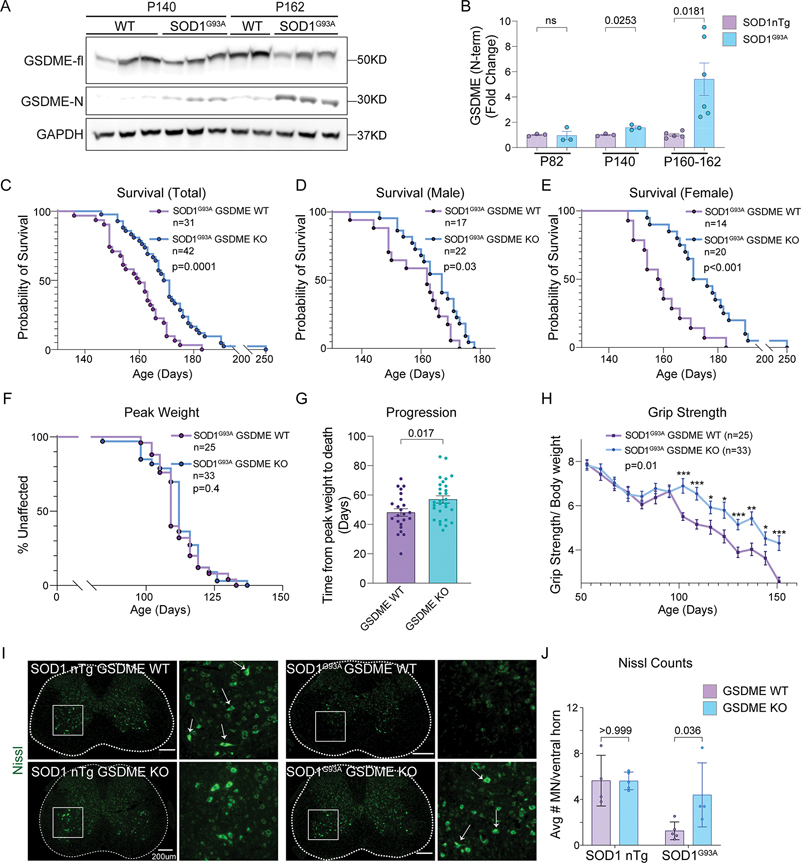
Mitochondrial dysfunction and axon loss are hallmarks of neurologic diseases. Gasdermin (GSDM) proteins are executioner pore-forming molecules that mediate cell death, yet their roles in the central nervous system (CNS) are not well understood. Here, we find that one GSDM family member, GSDME, is expressed by both mouse and human neurons. GSDME plays a role in mitochondrial damage and axon loss. Mitochondrial neurotoxins induced caspase-dependent GSDME cleavage and rapid localization to mitochondria in axons, where GSDME promoted mitochondrial depolarization, trafficking defects, and neurite retraction. Frontotemporal dementia (FTD)/amyotrophic lateral sclerosis (ALS)-associated proteins TDP-43 and PR-50 induced GSDME-mediated damage to mitochondria and neurite loss. GSDME knockdown protected against neurite loss in ALS patient iPSC-derived motor neurons. Knockout of GSDME in SOD1G93A ALS mice prolonged survival, ameliorated motor dysfunction, rescued motor neuron loss, and reduced neuroinflammation. We identify GSDME as an executioner of neuronal mitochondrial dysfunction that may contribute to neurodegeneration.

Keywords: ALS; FTD; axon degeneration; cell death; gasdermins; innate immunity; mitochondria; neurodegeneration; neuroimmunology; pyroptosis.


Conflict of interest statement

Declaration of interests I.M.C. receives sponsored research support from Abbvie/Allergan Pharmaceuticals and is on the SAB for GSK and LIMM therapeutics. J.L. is a cofounder and SAB member of Ventus Therapeutics.

Figures

Figure 1:
Figure 1:. GSDME is expressed in the brain and localizes to neurons at baseline.
(A) Single-cell RNA-sequencing (Allen Institute for Brain Science) of sorted mouse cortical and hippocampal neurons was mined for expression levels of Gasdermins. (B) Representative IHC images of coronal mouse brain sections stained using anti-GSDME antibody. (C) Immunoblot analysis of GSDME expression in several mouse brain regions from adult wild-type and GSDME knockout mice. (D) Immunoblot of GSDME and GSDMD expression in neuronal (Tuj1+) and glial (Iba1+) populations from P0 mouse pups. (E) Representative IHC images of mouse cortex and striatum co-stained with anti-GSDME and either anti-beta-III-tubulin (Tuj1) or anti-Iba1 antibodies. For colocalization, each dot represents a coronal section. Two sections were quantified per mouse (n= 3–5 mice/group). (F) Representative IHC images of temporal lobe from two healthy control patients stained with anti-GSDME.
Figure 2:
Figure 2:. GSDME is activated by mitochondrial toxins and contributes to cellular necrosis in neurons
(A) Schematic of GSDME activation downstream of apoptotic stimuli and caspase-3 processing (biorender.com). (B) Immunoblots of primary neurons treated with raptinal for 1h or rotenone for 8h. (C) Representative 20X Images of wild-type or GSDME KO primary mouse cortical neurons 3h following treatment with raptinal or DMSO and stained with Sytox-Green. (D-F) Primary neurons were incubated in propidium iodide (PI) containing media and treated with (D) raptinal, (E) rotenone or (F) antimycin-A. Images were taken every 3h for 24 hours. (G) Area under the curve (AUC24h) measurements for PI uptake in wild-type and GSDME KO neurons treated with toxins. (H) Wild-type and GSDME KO mouse cortical neurons treated with raptinal (1h), rotenone (2h) or antimycin-A (1h) were assessed for LDH release (24h). (I-J) Representative images of primary neurons transfected with GFP-GSDME and incubated in media containing propidium iodide. These cells were imaged every 15 mins for 21 hours. (J) Formation of intracellular puncta, as well as PI uptake quantified over time. Each data point represents an average of 15 neurons.
Figure 3:
Figure 3:. Activated GSDME rapidly localizes to neuronal mitochondria following toxin treatment
(A-C) Representative images of a mouse neuron co-transfected with mitochondrial marker mKate-OMP25 and GFP-GSDME imaged before and after raptinal treatment (90mins). (B) The location of mitochondria (red) and GFP-GSDME (green) peaks as measured via line scans along the neurites. (C) The enrichment of green GSDME signal at mitochondria (red) over the background (diffuse cytosolic intensity) were quantified from such line scans along neurites. N= 30 neurite segments representing 10 neurons across 3 wells. (D-F) Representative image of a microfluidic chamber plated with wild-type mouse cortical neurons transfected with GFP-GSDME and mKate-OMP25. The axonal chamber was treated with raptinal for 2.5h. Images of proximal neurites (left) and a distal axon segment (right) before and after raptinal treatment are shown. Enrichment of GFP-GSDME on mitochondria in (E) proximal and (F) distal chambers were quantified (N = 50 distal and 50 proximal neurite segments taken from three microfluidic chambers.) (G-H) Representative images of mouse neurons transfected with GFP-GSDME and either (G) mKate-OMP25 or (H) Cox8-mCherry. These cells were treated with raptinal, fixed and imaged using structured illumination microscopy (SIM).
Figure 4:
Figure 4:. GSDME deficient neurons are protected from toxin-induced mitochondrial dysfunction
(A) Wild-type and GSDME knockout primary neurons were stained with TMRM and incubated with rotenone. Images were captured every 15 min and TMRM intensity normalized to DMSO controls. (B-C) Wild-type and GSDME knockout primary neurons were transfected with mKate-OMP25 and treated with raptinal. (B) Representative images at 4h post-raptinal treatment. (C) Mitochondrial density was calculated by counting OMP-25+ objects and dividing by neurite length at 0, 1h, 2h and 4h post-raptinal treatment. (D-F) Representative transmission electron microscopy images (TEM) of wild-type and GSDME KO neuronal cultures treated with either DMSO or raptinal for 1h. (E) Mitochondrial length (dot = 1 mitochondrion) and (F) percentage of damaged mitochondria (dot = average of 2 wells) were calculated across three independent experiments. (G) Wild-type and GSDME KO mouse neurons transfected with mKate-OMP25, treated with raptinal and imaged at high temporal resolution (1 image/5s) for 3 min intervals. These intervals were captured at 0h, 1h and 2h post-toxin exposure. (H) Kymograph analysis was performed to visualize and quantify mitochondrial motility. Percent motile mitochondria was calculated from kymograph analysis of wild-type and GSDME KO neurons treated with raptinal. Combined data from three independent experiments are shown.
Figure 5:
Figure 5:. GSDME knockout protects against neurite loss and local mitochondrial damage
(A) Representative images of wild-type and GSDME knockout neurons treated with DMSO, raptinal, rotenone and antimycin-A, and stained for Tuj1, 8h post-toxin treatment. (B-D) Microtubule depolymerization index was calculated for wild-type and KO neurons treated with (B) raptinal (C) rotenone or (D) antimycin-A. Violin plots display the median and interquartile ranges for depolymerization index taken from three independent experiments. (E) Representative image of a microfluidic chamber plated with wild-type mouse cortical neurons stained with TMRM. The panel represents the chamber prior to addition of raptinal. The black dashed box indicates an axonal region magnified in (F). (F) Representative images of axonal segments from wild-type and GSDME KO neurons before and after (60 min) addition of 5uM Raptinal and stained with TMRM. (G) Quantification of TMRM intensity relative to baseline (t=0) from the axonal chambers of plated wild-type and GSDME KO neurons. Axonal segments from three wild-type and three KO microfluidic chambers were used for analysis (n=3).
Figure 6:
Figure 6:. FTD/ALS proteins cause GSDME-dependent mitochondrial depolarization and neurite loss
(A) Primary mouse neurons transfected with GFP-GSDME, mKate-OMP25 and either PR-50, TDP-43 or iRFP were imaged 48h post-transfection. White boxes on the top panels indicate magnified axonal segments (bottom panels). (B) Quantification of the number of GFP-GSDME puncta and percentage of mitochondria enriched in GFP-GSDME, from neurons 48h after transfection with either iRFP, PR-50 or TDP-43 plasmids. (C) Immunoblots of primary mouse neurons transduced with lentiviruses encoding PR-50, GFP, TDP-43 or no virus. Lysates were collected at 72h post-transduction. (D-E) Primary mouse neurons transduced with lentivirus encoding either (D) PR-50 or (E) TDP-43 and stained with TMRM. 20X images were taken every 4h, starting 24h post-transduction. TMRM intensity per well was quantified and normalized relative to baseline levels (N=2 independent experiments, four technical replicates per condition). (F-I) Representative images of wild-type and GSDME KO primary mouse neurons transduced with GFP control, (F) PR-50 or (H) TDP-43. Neurons were fixed and stained for Tuj1 4d post-transduction. Tuj1 quantification of microtubule depolymerization index from mouse neurons transduced with GFP control, (G) PR-50 or (I) TDP-43. Violin plots display the median and interquartile ranges for depolymerization index taken from three independent experiments. (J-K) Wild-type and GSDME KO mouse cortical neurons were transduced with (J) TDP-43 or (K) PR-50 lentivirus and assessed for LDH release 4d post-transduction.
Figure 7:
Figure 7:. GSDME knockdown rescues neurite loss in ALS iPSC-derived motor neurons
(A) Representative Tuj1 staining of control 1016A (wild-type) or TDP43G298S iPSC-derived motor neurons transduced with either scrambled shRNA or GSDME targeting shRNA and treated with either DMSO (vehicle), tunicamycin, MG132 or thapsigargin (48h post-toxin treatment). (B-E) Microtubule depolymerization index was calculated for 1016A (wild-type) and TDP43G298S motor neurons treated with (B) 0.1% DMSO (vehicle) (C) 1uM MG132 (D) 0.5uM of thapsigargin (E) 5uM tunicamycin and either scrambled shRNA or GSDME targeting shRNAs. Violin plots display the median and interquartile ranges for depolymerization index (N=6 technical replicates).
Figure 8:
Figure 8:. GSDME knockout rescues SOD1G93A pathology in a mouse model of ALS
(A-B) Immunoblots of spinal cord lysates from SOD1G93A transgenic mice and wild-type controls at (A) end-stage (P162) and symptom onset (P140). (B) The levels of GSDME N-terminal (GAPDH normalized) as well as the ratio of NT- to full-length- GSDME was quantified (n=3–6) for each timepoint and genotype. (C-E) Transgenic (C) mixed gender mice that were either SOD1G93A GSDME WT (N=31 total) or SOD1G93A GSDME KO (N=38 total) were followed for survival. These Kaplan-Meier curves are displayed separately for (D) male SOD1G93A GSDME WT (N=17) and SOD1G93A GSDME KO (N=22) and (E) female SOD1G93A GSDME WT (N=14) and SOD1G93A GSDME KO (N=20) animals. (F) The age of maximum weight for each mouse was used to as a measure of disease onset (Kaplan-Meier plot). (G) The time from maximum weight until euthanasia/death was used as a measure of disease progression. (H) Grip strength was tracked for each mouse and normalized by bodyweight. (I) Representative Nissl-stained images of lumbar spinal cord from SOD1G93A GSDME WT and SOD1G93A GSDME KO animals at P150. Magnified regions (white box) delineate a ventral horn area of a spinal cord section. (J) Quantification of Nissl+ motor neurons per ventral horn of the spinal cord. Each dot represents the average of 6–8 lumbar spinal cord sections from a single mouse.

References

    1. Murali Mahadevan H, Hashemiaghdam A, Ashrafi G, and Harbauer AB (2021). Mitochondria in Neuronal Health: From Energy Metabolism to Parkinson’s Disease. Adv Biol 2100663, 2100663. 10.1002/adbi.202100663. - DOI - PubMed
    1. Venderova K, and Park DS (2012). Programmed cell death in Parkinson’s disease. Cold Spring Harb Perspect Med 2, 1–23. 10.1101/cshperspect.a009365. - DOI - PMC - PubMed
    1. Baranov S. v., Baranova O. v., Yablonska S, Suofu Y, Vazquez AL, Kozai TDY, Tracy Cui X, Ferrando LM, Larkin TM, Tyurina YY, et al. (2019). Mitochondria modulate programmed neuritic retraction. Proc Natl Acad Sci U S A 116, 650–659. 10.1073/pnas.1811021116. - DOI - PMC - PubMed
    1. Fuentes L, Lebenkoff S, White K, Gerdts C, Hopkins K, Potter JE, Grossman D, Project PE, and Sciences R (2016). Releasing Syntaphilin Removes Stressed Mitochondria from Axons Independent of Mitophagy under Pathophysiological Conditions. Neuron 93, 292–297. 10.1016/j.neuron.2017.04.004.Releasing. - DOI - PMC - PubMed
    1. Bock FJ, and Tait SWG (2020). Mitochondria as multifaceted regulators of cell death. Nat Rev Mol Cell Biol 21, 85–100. 10.1038/s41580-019-0173-8. - DOI - PubMed

Publication types

Supplementary concepts