. 2023 Apr 20;83(8):1237-1250.e15.
doi: 10.1016/j.molcel.2023.02.010. Epub 2023 Mar 13.

Sequence and chromatin features guide DNA double-strand break resection initiation

Affiliations

Sequence and chromatin features guide DNA double-strand break resection initiation

Robert Gnügge et al. Mol Cell. .

Abstract

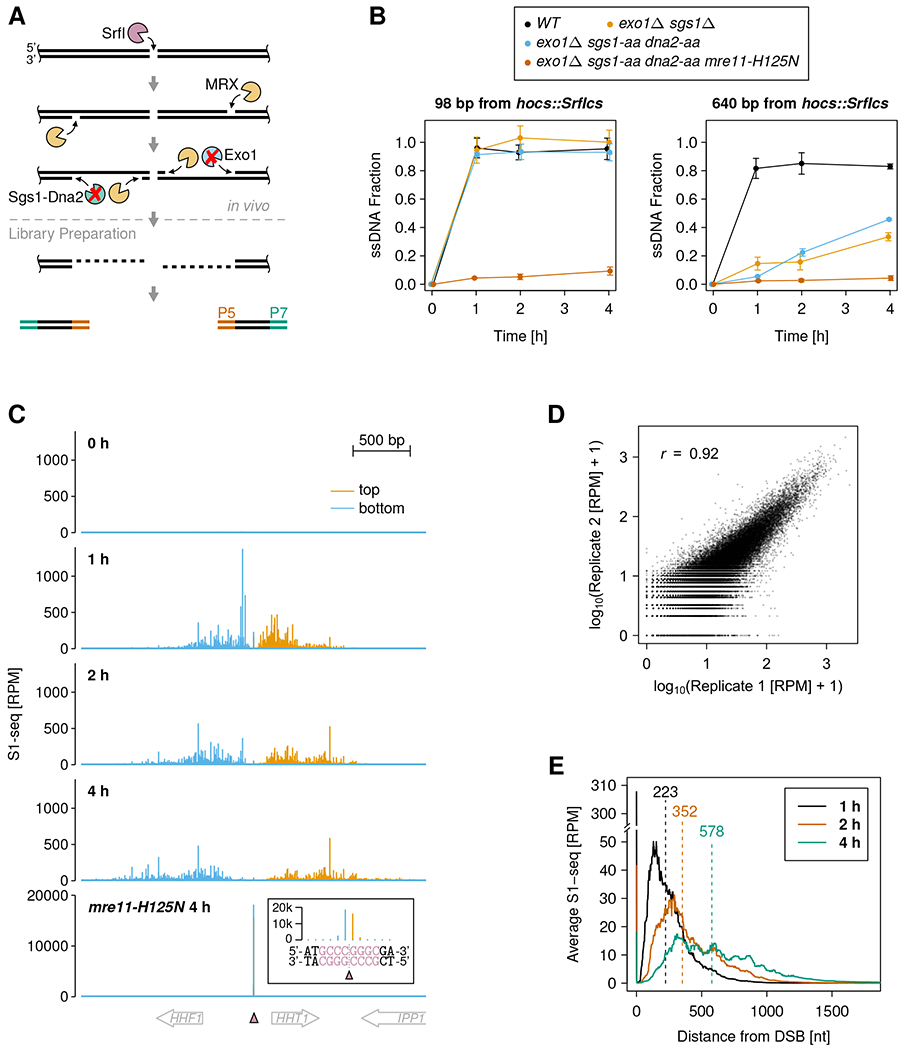
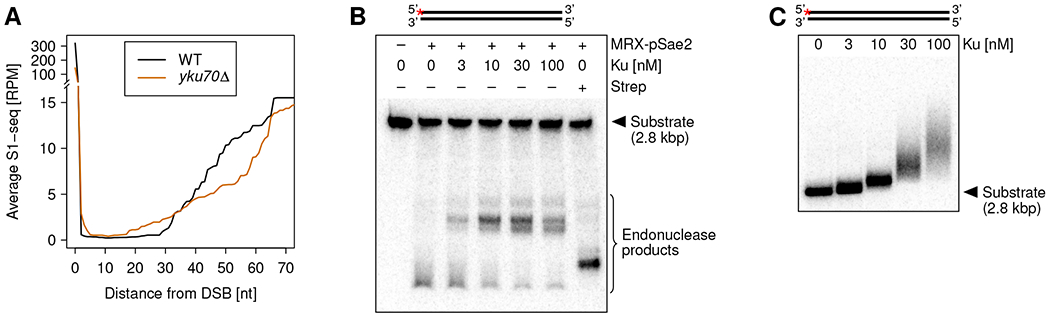
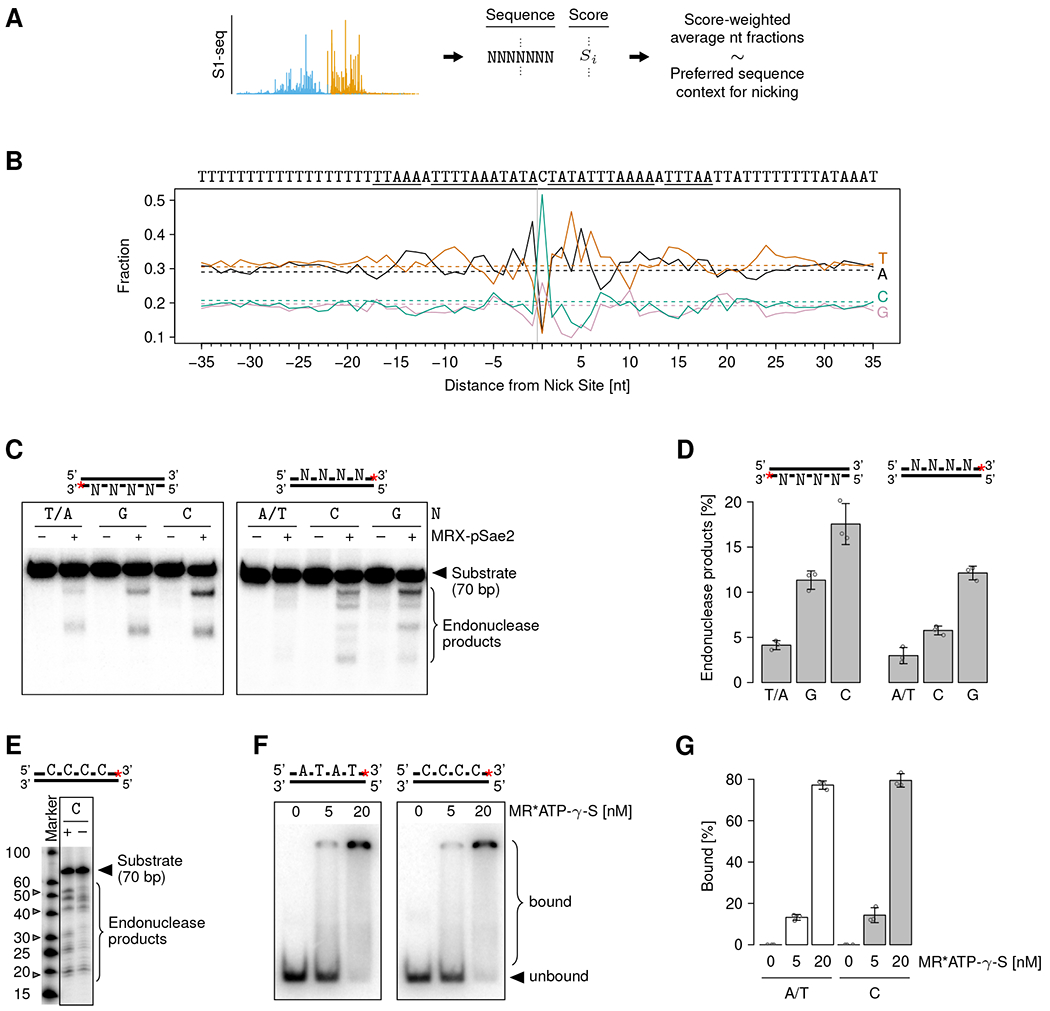
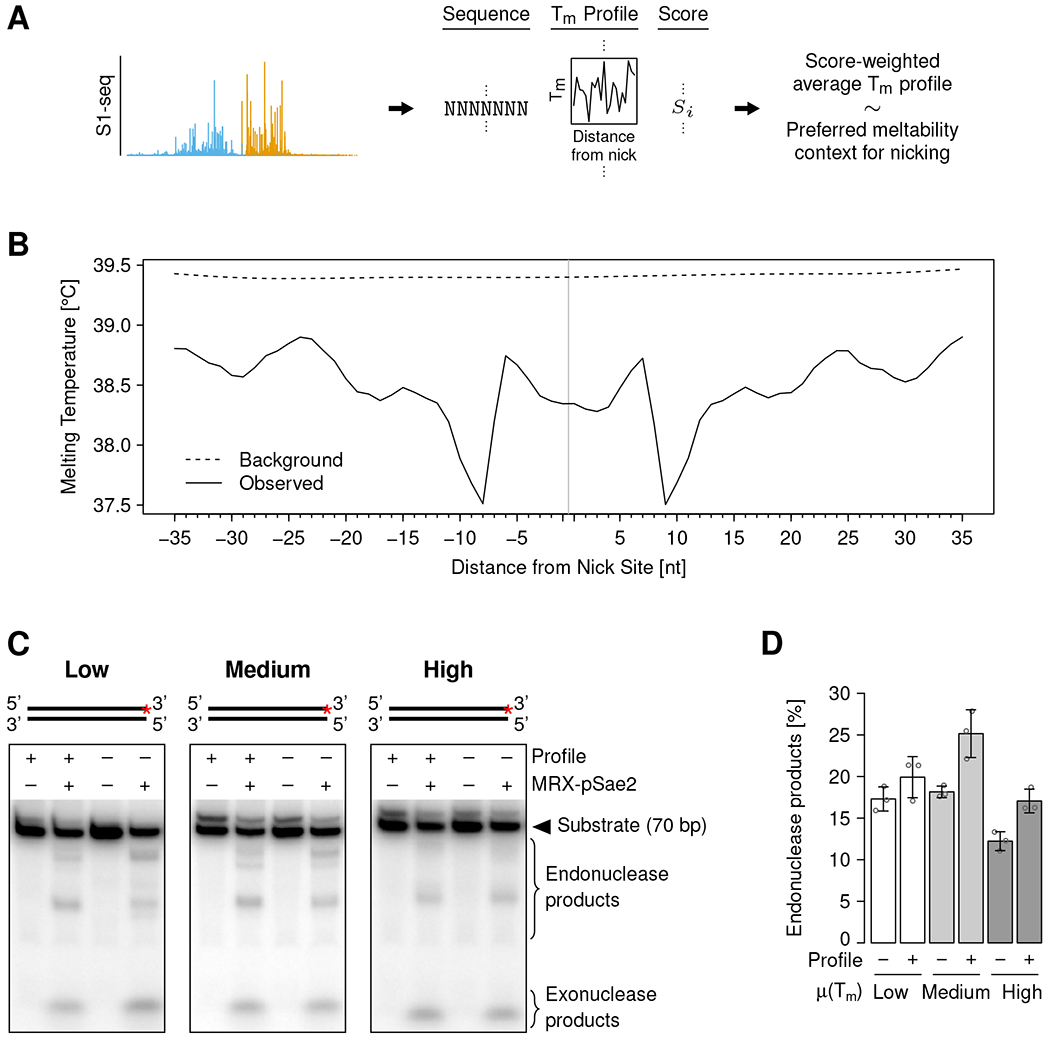
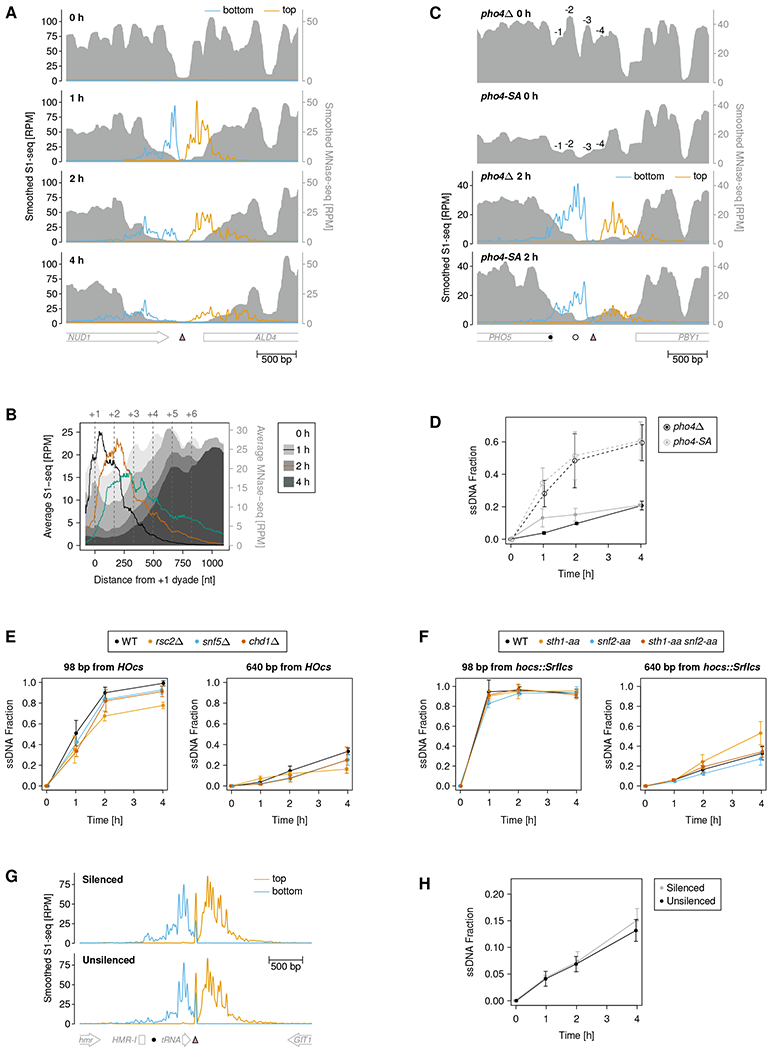
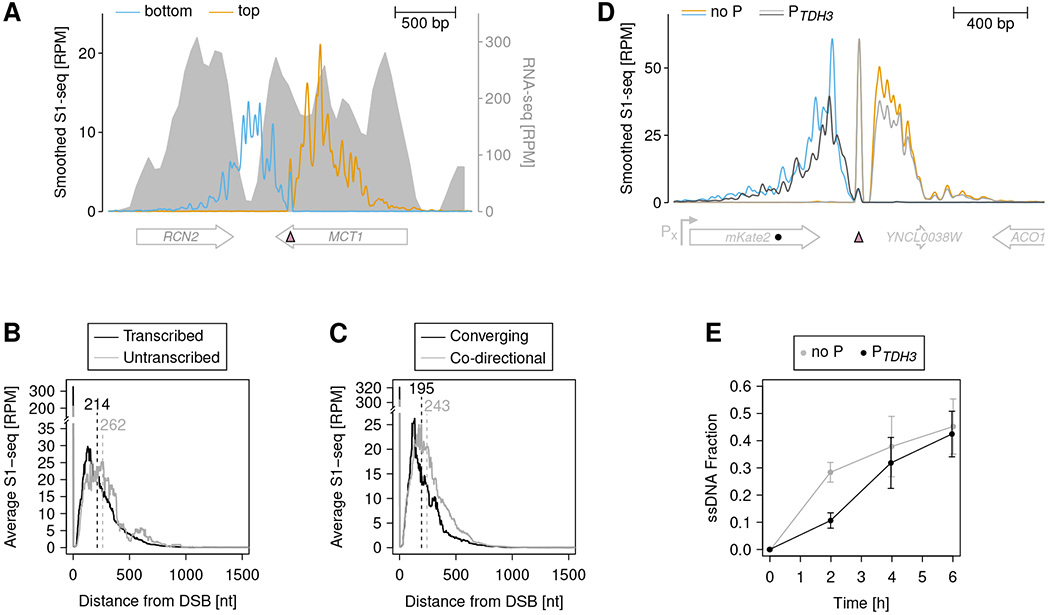
DNA double-strand breaks (DSBs) are cytotoxic genome lesions that must be accurately and efficiently repaired to ensure genome integrity. In yeast, the Mre11-Rad50-Xrs2 (MRX) complex nicks 5'-terminated DSB ends to initiate nucleolytic processing of DSBs for repair by homologous recombination. How MRX-DNA interactions support 5' strand-specific nicking and how nicking is influenced by the chromatin context have remained elusive. Using a deep sequencing-based assay, we mapped MRX nicks at single-nucleotide resolution next to multiple DSBs in the yeast genome. We observed that the DNA end-binding Ku70-Ku80 complex directed DSB-proximal nicks and that repetitive MRX cleavage extended the length of resection tracts. We identified a sequence motif and a DNA meltability profile that is preferentially nicked by MRX. Furthermore, we found that nucleosomes as well as transcription impeded MRX incisions. Our findings suggest that local DNA sequence and chromatin features shape the activity of this central DSB repair complex.

Keywords: CtIP; DNA double-strand break; DNA repair; Mre11; Sae2; chromatin; homologous recombination; resection.


Conflict of interest statement

Declaration of interests The authors declare no competing interests.

Figures

Figure 1.
Figure 1.. Monitoring Mre11-Rad50-Xrs2 (MRX) nicking at nucleotide resolution
(A) Schematic representation of DSB end resection and the MRX nick site mapping approach. SrfI expression creates multiple defined DSBs and long-range resection suppression preserves MRX nick sites as single-stranded/double-stranded DNA junctions. S1-seq libraries are prepared by in vitro blunting and adapter (P5 and P7) ligation and allow nucleotide (nt)-resolution MRX nick site mapping. (B) Short-range resection (left panel) and long-range resection (right panel) were monitored at the indicated distances from a DSB formed at hocs::SrfIcs, where an SrfI cut site (SrfIcs) was engineered into the MATa HO cut site (HOcs). Data are represented as mean ± standard deviation (SD) of three biological replicates. (C) S1-seq coverage around the SrfI cut site at chrII:256,173 (pink triangle) at the indicated time points after SrfI induction. The inset shows a zoom-in on the DSB site for the mre11-H125N exo1Δ dna2-aa sgs1-aa strain. The SrfI recognition sequence is printed in pink and the dotted gray line indicates the blunt cut position. RPM: reads per million reads. (D) Reproducibility of MRX nick site mapping. S1-seq scores at each nucleotide position in ±2 kbp regions around all DSBs are plotted for two biological replicates (merged 1, 2, and 4 h time points). The Pearson’s correlation coefficient r is specified. (E) Average 51-nt smoothed S1-seq coverage spreading from the 9 most efficiently formed DSBs at the indicated time points. Numbers above vertical dashed lines indicate average spreading distance from DSBs. See Figure S1E–G for S1-seq coverage spreading from DSBs with middle and slow formation kinetics. See also Figures S1 and S2.
Figure 2.
Figure 2.. The Ku complex guides DSB-proximal MRX nicks
(A) Average 51-nt smoothed S1-seq coverage near all DSBs 1 h after DSB induction in indicated strains. (B) In vitro MRX nicking in the presence of various concentrations of the yeast Ku complex. The substrate structure is shown on top, and the red asterisk indicates the position of the radioactive label. Ku: Yku70/80 complex. Strep: monovalent Streptavidin (positive control, binding to Biotin residues present at all DNA ends). (C) Electrophoretic mobility shift assay (EMSA) with Yku70/80 complex (Ku) and 5’ labeled plasmid-length substrate.
Figure 3.
Figure 3.. MRX preferentially nicks at a specific sequence motif
(A) Schematic of the analysis approach to identify a potential sequence preference of MRX nicking. (B) Nucleotide fractions at indicated distances from the MRX nick site (vertical gray line). Color-coded solid and dashed lines show nicking preference (average weighted with S1-seq scores) and background (unweighted average), respectively. The background fractions correspond to the S. cerevisiae genome GC content of ca. 38%, as expected. On top, the sequence of the most abundant nucleotide at each position is specified. The rotationally symmetric part of the sequence is underlined. (C) In vitro MRX nicking assay with substrates containing or lacking positioned Cs or Gs. (D) Quantification of nicking assays such as shown in (C). Individual values (circles) and means (bar heights) ± SD (error bars) of three independent replicates are shown. (E) Nicking products of the indicated substrates resolved on a higher-resolution gel. The gray filled triangles mark the expected product sizes for MRX nicking at the positioned Cs. (F) EMSA with ATP-γ-S-bound Mre11-Rad50 (MR) complex and substrates containing or lacking Cs. (G) Quantification of EMSAs such as shown in (F). Individual values (circles) and means (bar heights) ± SD (error bars) of three independent replicates are shown. (C-F) The substrate structures are shown on top, and the red asterisks indicate the position of the radioactive label. See also Figure S3.
Figure 4.
Figure 4.. MRX preferentially nicks DNA with a specific melting temperature profile
(A) Schematic of the analysis approach to identify a potential DNA melting profile preference of MRX nicking. Tm: melting temperature. (B) Melting temperature at indicated distances from the MRX nick site (vertical gray line). Solid and dashed black lines show nicking preference (average weighted with S1-seq score) and background (unweighted average), respectively. Melting temperatures were calculated for 15-bp windows centered at the indicated distance. (C) In vitro MRX nicking of DNA substrates containing or lacking the preferred melting temperature profile and low, medium, or high overall melting temperature, as indicated. The substrate structures are shown on top, and the red asterisks indicate the position of the radioactive label. (D) Quantification of nicking assays such as shown in (C). Individual values (circles) and means (bar heights) ± SD (error bars) of three independent replicates are shown. μ(Tm): average melting temperature. See also Figure S4.
Figure 5.
Figure 5.. MRX nicking is influenced by nucleosomes, but not by chromatin remodelers or heterochromatin
(A) 51-nt smoothed S1-seq and 31-nt smoothed MNase-seq coverage around the SrfI cut site (pink triangle) at chrXV:1039563 at the indicated time points after SrfI induction. (B) Average 51-nt smoothed S1-seq and MNase-seq coverage around all DSBs aligned at the first (0 h and 1 h time points), second (2 h time point), or third (4 h time point) nucleosome from the DSB site. (C) 51-nt smoothed S1-seq and 31-nt smoothed MNase-seq coverage around the SrfI cut site (pink triangle) inserted at the PHO5 promoter at the indicated time points after DSB induction. The −1 to −4 nucleosomes, which are positioned in the pho4Δ strain and depleted in the pho4-SA strain, are indicated. The filled and empty circle indicate the sites where resection was evaluated using a qPCR-based assay, as shown in (D). (D) Resection was evaluated at −223 bp (empty circles) and −538 bp (filled circles) from the DSB, as also indicated in (C). Data are represented as mean ± SD of three biological replicates. (E) Resection was evaluated at the indicated distances from a DSB generated at the MATa HO cut site (HOcs) in long-range resection suppressed strains. Data are represented as mean ± SD of three biological replicates. (F) Resection was evaluated at the indicated distances from a DSB generated at an SrfI cut site engineered into the MATa HO cut site (hocs::SrfIcs) in long-range resection suppressed strains. Data are represented as mean ± SD of three biological replicates. (G) 51-nt smoothed S1-seq coverage around the HO cut site (pink triangle) inserted downstream of the HMR locus 2 h after HO induction. In the unsilenced strain, the silencer seed sequence (HMR-I) was substituted with an unrelated sequence (hisG). Silencing has been reported to spread until the tRNA gene (systematic name: YNCC0014W), which serves as a boundary element ,. The filled circle indicates the site where resection was evaluated using a qPCR-based assay, as shown in (H). (H) Resection was evaluated at −607 bp from the DSB, as also indicated in (G). Data are represented as mean ± SD of three biological replicates. See also Figure S5.
Figure 6.
Figure 6.. Transcription mildly impedes MRX nicking.
RNA-seq and 51-nt smoothed S1-seq coverage 2 h post DSB induction around the SrfI cut site (pink filled triangle) at chrXV:756594. Note the dip of S1-seq coverage on the bottom strand upon encountering a highly transcribed region. (B) Average 51-nt smoothed S1-seq coverage spreading from all DSBs 1 h post DSB induction grouped by transcriptional activity. Numbers above vertical dashed lines indicate average spreading distance from DSBs. (C) Average 51-nt smoothed S1-seq coverage spreading from all DSBs 1 h post DSB induction in transcribed regions grouped by converging or co-directional orientation of transcription and resection. Numbers above vertical dashed lines indicate average spreading distance from DSBs. (D) 51-nt smoothed S1-seq coverage 2 h post DSB induction around the HO cut site (pink filled triangle) located downstream of the mKate2 reporter gene. The filled circle indicates the site where resection was evaluated using a qPCR-based assay, as shown in (E). no P: no promoter. (E) Resection was evaluated at −430 bp from the DSB, as also indicated in (D). Data are represented as mean ± SD of three biological replicates. no P: no promoter. See also Figure S6.

References

    1. Tubbs A, and Nussenzweig A (2017). Endogenous DNA Damage as a Source of Genomic Instability in Cancer. Cell 168, 644–656. 10.1016/j.cell.2017.01.002. - DOI - PMC - PubMed
    1. Betermier M, Borde V, and de Villartay JP (2020). Coupling DNA Damage and Repair: an Essential Safeguard during Programmed DNA Double-Strand Breaks? Trends Cell Biol 30, 87–96. 10.1016/j.tcb.2019.11.005. - DOI - PubMed
    1. Moynahan ME, and Jasin M (2010). Mitotic homologous recombination maintains genomic stability and suppresses tumorigenesis. Nat Rev Mol Cell Biol 11, 196–207. 10.1038/nrm2851. - DOI - PMC - PubMed
    1. Taylor AMR, Rothblum-Oviatt C, Ellis NA, Hickson ID, Meyer S, Crawford TO, Smogorzewska A, Pietrucha B, Weemaes C, and Stewart GS (2019). Chromosome instability syndromes. Nat Rev Dis Primers 5, 64. 10.1038/s41572-019-0113-0. - DOI - PMC - PubMed
    1. Chiruvella KK, Liang Z, and Wilson TE (2013). Repair of double-strand breaks by end joining. Cold Spring Harb Perspect Biol 5, a012757. 10.1101/cshperspect.a012757. - DOI - PMC - PubMed

Publication types

MeSH terms