. 2023 May 9;56(5):1115-1131.e9.
doi: 10.1016/j.immuni.2023.02.018. Epub 2023 Mar 13.

Endoplasmic reticulum stress in the intestinal epithelium initiates purine metabolite synthesis and promotes Th17 cell differentiation in the gut

Affiliations

Endoplasmic reticulum stress in the intestinal epithelium initiates purine metabolite synthesis and promotes Th17 cell differentiation in the gut

Jinzhi Duan et al. Immunity. .

Abstract

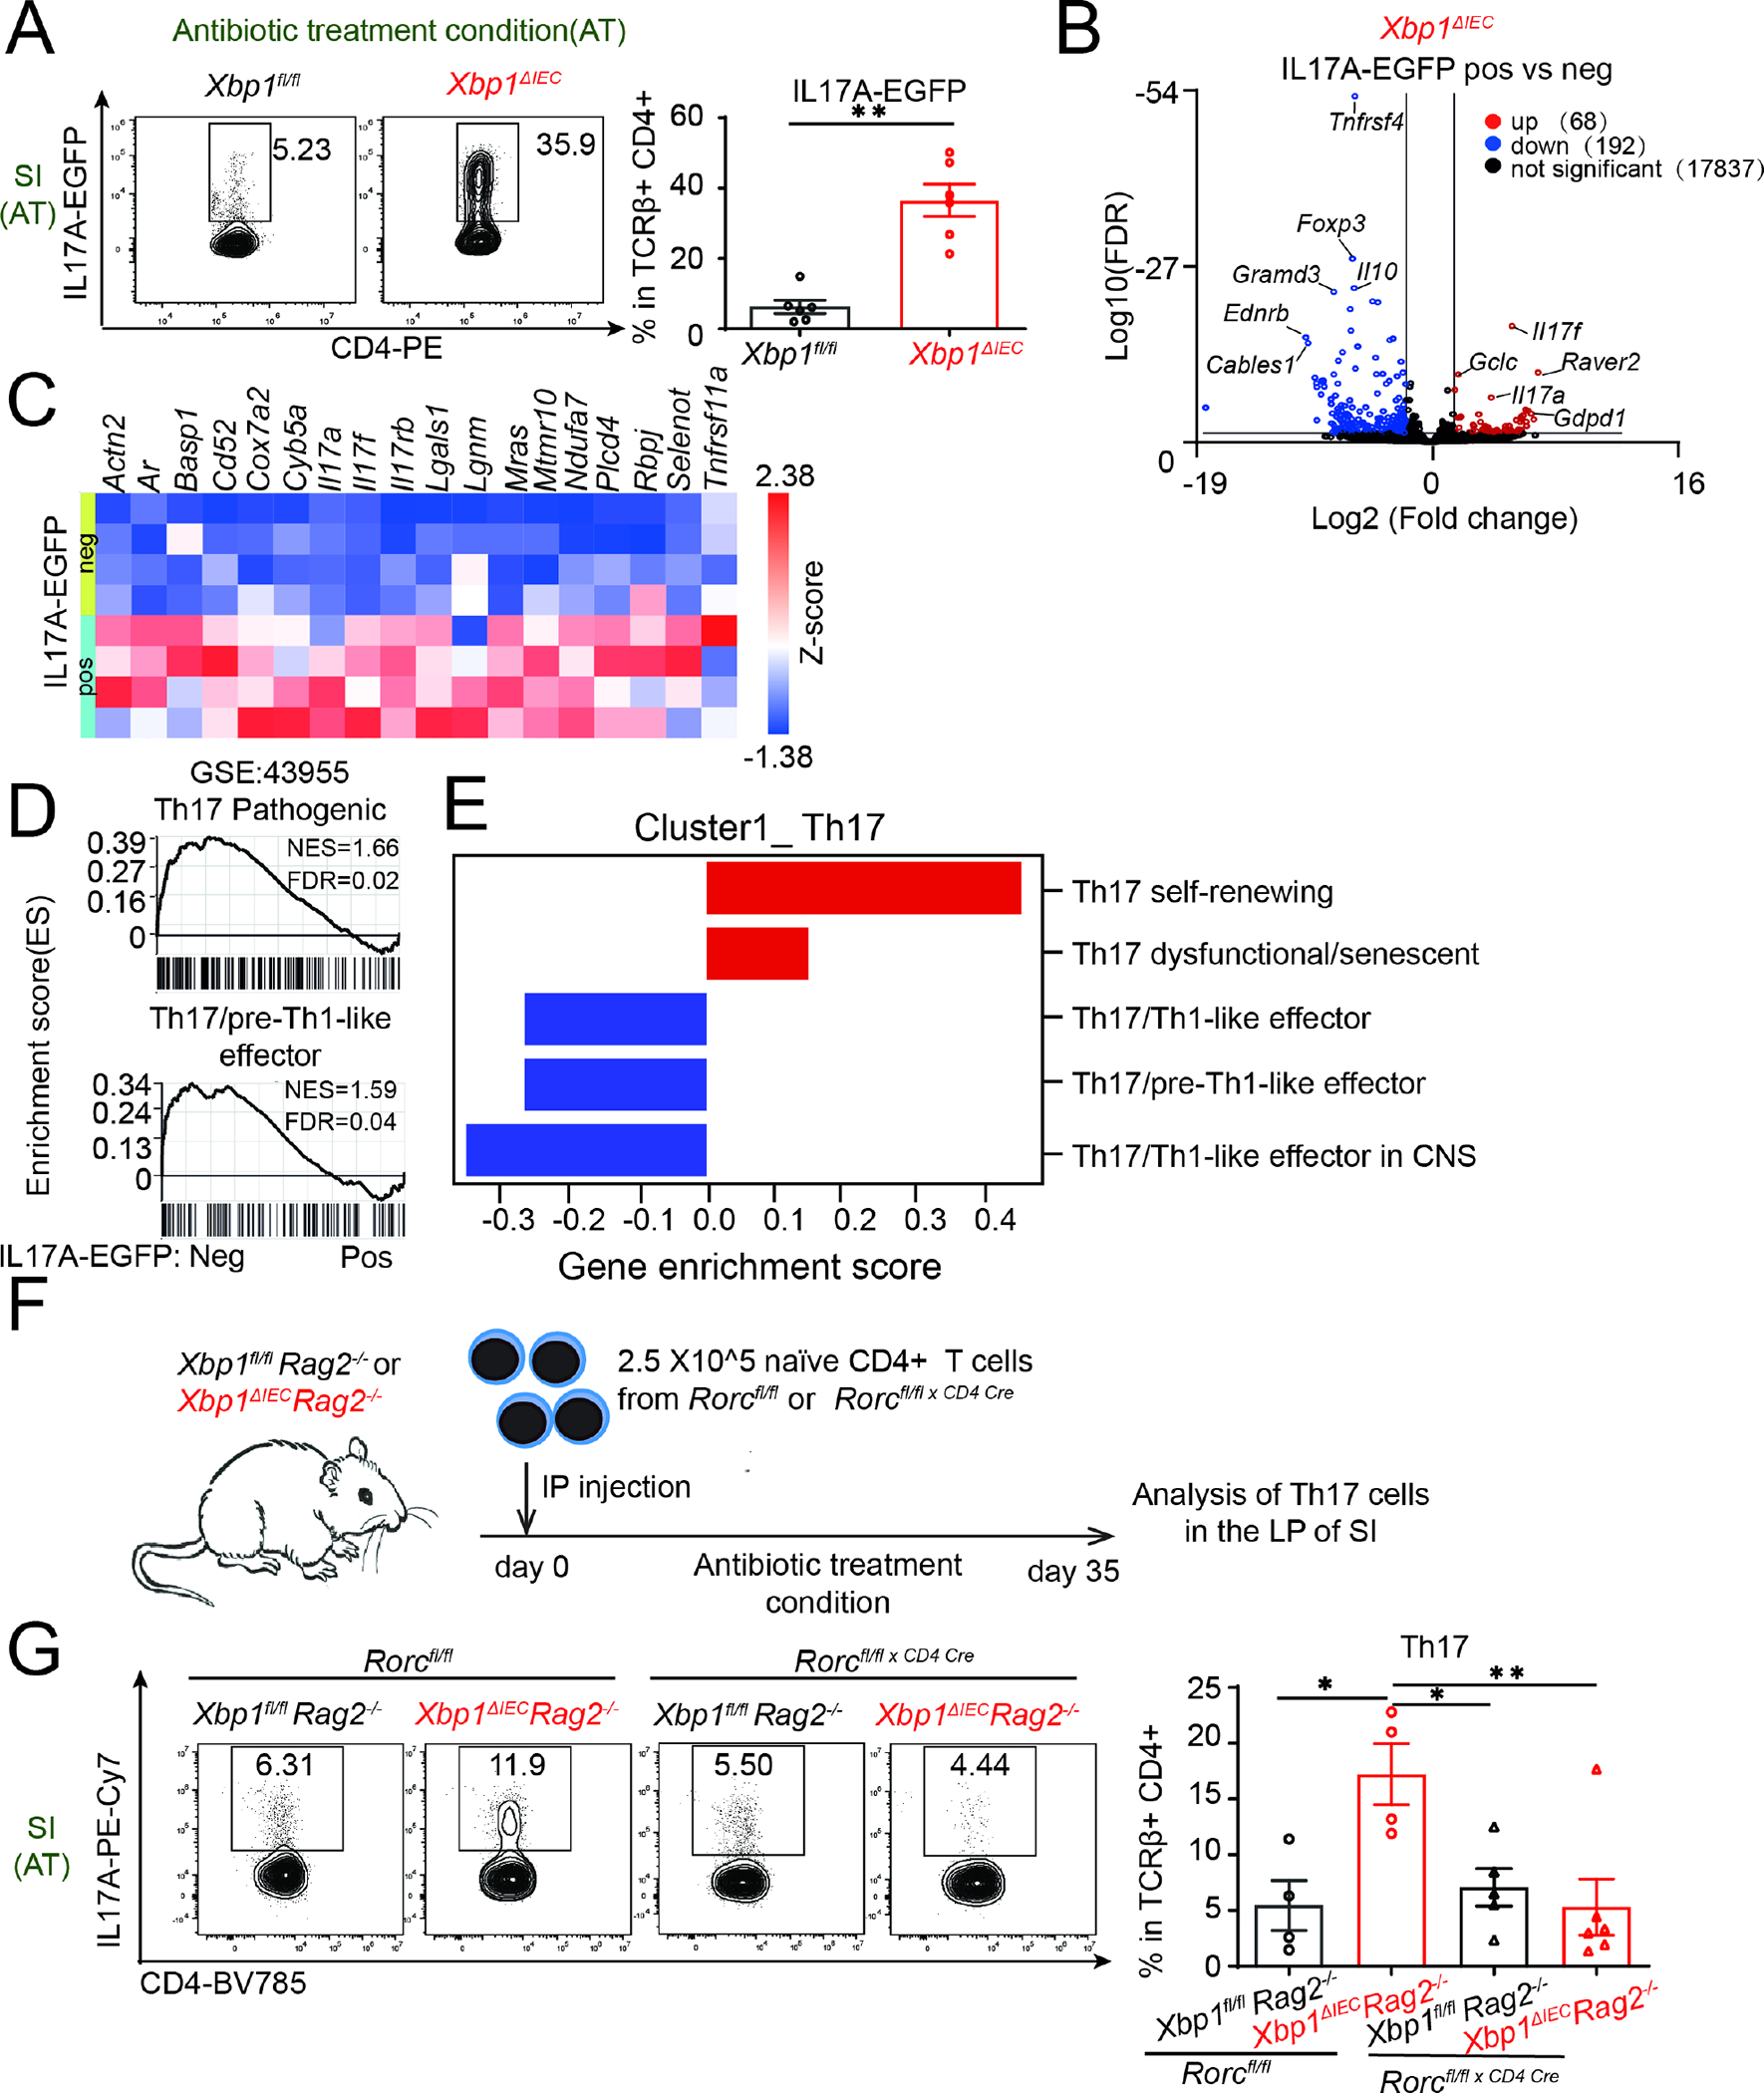
Intestinal IL-17-producing T helper (Th17) cells are dependent on adherent microbes in the gut for their development. However, how microbial adherence to intestinal epithelial cells (IECs) promotes Th17 cell differentiation remains enigmatic. Here, we found that Th17 cell-inducing gut bacteria generated an unfolded protein response (UPR) in IECs. Furthermore, subtilase cytotoxin expression or genetic removal of X-box binding protein 1 (Xbp1) in IECs caused a UPR and increased Th17 cells, even in antibiotic-treated or germ-free conditions. Mechanistically, UPR activation in IECs enhanced their production of both reactive oxygen species (ROS) and purine metabolites. Treating mice with N-acetyl-cysteine or allopurinol to reduce ROS production and xanthine, respectively, decreased Th17 cells that were associated with an elevated UPR. Th17-related genes also correlated with ER stress and the UPR in humans with inflammatory bowel disease. Overall, we identify a mechanism of intestinal Th17 cell differentiation that emerges from an IEC-associated UPR.

Keywords: Citrobacter rodentium; ROS signals; TH17 cells; commensal bacterial; epithelial endoplasmic reticulum stress; inflammatory bowel disease; purine metabolism.


Conflict of interest statement

Declaration of interests The authors declare no competing interests.

Figures

Figure 1
Figure 1. IEC ER stress induces Th17 cells in multiple models under specific pathogen free (SPF) conditions.
(A-D) Representative plots (left), percentages of LP Th17 (A), Treg (B), Th1 (C), Th2 (D) cells (gated on CD45+TCRβ+CD4+, middle), and the absolute counts of Th17 (A), Treg (B), Th1 (C), Th2 (D) cells (right) in the SI of SPF Xbp1ΔIEC and Xbp1fl/fl (n=7–14 mice per group, pooled data from four independent experiments). (E) Immunoblot of SI from Villin-creRosa26wt(V−S−), Villin-cre+Rosa26wt (V+S−), Villin-creRosa26lsl-SubAA272 (V−S+, CT), Villin-cre+Rosa26lsl-SubAA272 (V+S+, SubAA272IEC) (n=3) mice under SPF conditions. (F) UMAP plot depicting unsupervised clustering of SI epithelial cells. 15,852 cells from Villin-creRosa26lsl-SubAA272 (CT) and 21,566 cells from Villin-cre+Rosa26lsl-SubAA272 (SubAA272IEC) mice under SPF conditions. (G) Dot plot showing scaled expression of indicated ER stress related markers in the clusters (CT = Villin-cre-Rosa26IsI-SubAA272, SubAA272IEC = Villin-cre+Rosa26IsI-SubAA272). (H) Representative plots (upper), percentages of LP Th17 cells (gated on CD45+TCRβ+CD4+, lower left), and the absolute counts of Th17 cells (lower right) in SI of SPF villin-creRosa26wt(V−S−), Villin-cre+Rosa26wt (V+S−), Villin-creRosa26lsl-SubAA272 (V−S+), Villin-cre+Rosa26lsl-SubAA272 (V+S+) (n=6–12 mice per group, pooled data from four independent experiments). Data were presented as mean±s.e.m; Mann-Whitney U test (A-D), one-way ANOVA corrected with Dunnett’s multiple comparisons test (H); ns not significant (P>0.05), *P<0.05, **P<0.01. See also Figure S1, and Table S1.
Figure 2
Figure 2. Intestinal epithelial cell ER stress induces Th17 cells under germ reduced and germ-free (GF) conditions.
(A) Representative plots (left), percentages of LP Th17 (gated on CD45+TCRβ+CD4+, middle), and the absolute counts of Th17 cells (right) in the SI of Xbp1ΔIEC and Xbp1fl/fl under antibiotic-treated conditions (AT) (n=4 mice per group, pooled data from two independent experiments). (B-C) Representative plots (left), percentages of LP Th17 (B), Treg (C) cells (gated on CD45+TCRβ+CD4+, middle), and the absolute counts of Th17 (B), Treg (C) cells (right) in the SI of GF Xbp1ΔIEC and Xbp1fl/fl (n=3–10 mice per group, pooled data from three independent experiments) (D) UMAP plot depicting unsupervised clustering of SI LP single CD4+ T cells. 1,977 cells from GF Xbp1fl/fl and 3,920 cells from GF Xbp1ΔIEC mice. (E) Heatmap representing cluster gene signatures as defined in Figure 2D and Table S3. (F) Bar plot depicting the cluster composition of each sample (Xbp1ΔIEC and Xbp1fl/fl). (G) Dot plot showing scaled expression of indicated Th17-related markers in the clusters (left= Xbp1fl/fl, right= Xbp1ΔIEC). (H) Violin plots showing gene expression of selected Th17-related genes in merged scRNA-seq data of CD4+ T cells from GF Xbp1ΔIEC and Xbp1fl/fl mice. All results in h, have a P<0.001. Data were presented as mean±s.e.m; Mann-Whitney U test (A-C); ns not significant (P>0.05), *P<0.05, ***P<0.001. See also Figure S2 and Table S2, S3.
Figure 3
Figure 3. IEC ER stress-induced Th17 cells are RORc-dependent and non-pathogenetic cells under antibiotic-treated and GF conditions.
(A) Representative plots (left), percentages of LP IL17A-EGFP positive cells (right) in the SI of Il17a-egfp+Xbp1ΔIEC and Il17a-egfp+Xbp1fl/fl under antibiotic-treated conditions (n=6 mice per group, pooled data from two independent experiments). (B) Volcano plot comparing the gene expression between SI LP IL17A-EGFP positive and negative T cells from antibiotic-treated Xbp1ΔIEC mice (n=4 per group). Differentially expressed genes (fold change >2 or <−2, FDR <0.01) are highlighted in red and blue. (C) Heat map of selected GF Th17 cluster 1 signature genes in IL17A-EGFP positive and negative T cells from antibiotic-treated Xbp1ΔIEC mice. Data were z normalized for heatmap visualization. Each column represents an individual RNA-seq library. (D) GSEA analysis of published Th17 feature, enrichment in IL17A-EGFP positive and negative T cells from antibiotic-treated Xbp1ΔIEC mice. (E) Average enrichment score of published signature genes in the merged cluster 1 (Th17 cell cluster,1213 cells) defined by scRNA-seq of LP CD4+ T cells from GF XBP1ΔIEC and XBP1fl/f mice. increased expression was labeled in red and decreased expression in blue. (F) Schematic depicting the experimental procedure. 0.25 million naïve CD4+ T cells from Rorcfl/fl and Rorcfl/fl CD4-cre+ mice in 200 μl PBS were transferred to Xbp1ΔIECRag2−/− and Xbp fl/flRag2−/− by intraperitoneal injection (IP). Recipient mice were housed under antibiotic-treated conditions for 35 days, and then Th17 cells were quantified in the SI LP by FACS. (G) Representative plots and percentages of LP Th17 cells in the SI of indicated mouse genotypes under antibiotic-treated conditions (n=4–6 mice per group, pooled data from two independent experiments). Data were presented as mean±s.e.m; Mann-Whitney U test (A), one-way ANOVA corrected with Dunnett’s multiple comparisons test (G); *P<0.05, **P<0.01. See also Figure S3.
Figure 4
Figure 4. ER stress induces Th17 cells through reactive oxygen species (ROS) generated by Duoxa2/Duox2.
(A) Duox2 and Duoxa2 expression in the SI of GF Xbp1ΔIEC and Xbp1fl/fl by RT-qPCR (n=5–6 mice per group). (B) Duox2 and Duoxa2 expression in MODE-K cells treated with mock or 50 ng/ml thapsigargin for 24 hours (n=5 replicates per group). (C) Relative H2O2 generation in mock or thapsigargin-treated MODE-K cells for 24 hours measured by ROS-Glo H2O2 assay (n=8 replicates per group). (D) H2O2 quantification from SI explants obtained from GF Xbp1ΔIEC and Xbp1fl/fl (24 hours, n=5 mice per group). (E, F) Representative plots and percentages of LP Th17 (E) and Treg (F) cells in the SI of NAC or water treatment GF Xbp1ΔIEC (n=4 mice per group). (G, H) Representative plots and percentages of LP Th17 cells in the SI of indicated mice under antibiotic-treated conditions. (n=5–10 mice per group, pooled data from two independent experiments). Data were presented as mean±s.e.m; Mann-Whitney U test (A-F), one-way ANOVA corrected with Dunnett’s multiple comparisons test (G, H); ns not significant (P>0.05), *P<0.05, **P<0.01, ***P<0.001, ****P<0.0001. See also Figure S4.
Figure 5
Figure 5. ER stress induces Th17 cells through purine metabolism.
(A) Volcano plot showing fold-change of relative metabolite quantity in serum from GF Xbp1ΔIEC compared to Xbp1fl/fl mice based on untargeted mass spectrometry. Different metabolites (fold change >2 or <−2, adj p-value <0.01) are highlighted in red or black, with the most regulated metabolite ions being annotated as xanthine and inosine based on accurate mass.. (B) Scheme of purine metabolism pathway including genes and metabolic products. Increased genes (in red) and decreased genes (green) in MODE-K SubAA272 compared with MODE-K control cell lines as shown in figure 5D. (C) The relative abundance of purine metabolites in the SI explants from GF Xbp1ΔIEC and Xbp1fl/fl mice (3 hours, n=5 mice per group). (D) Heatmap of purine metabolism-related genes in MODE-K SubAA272 and MODE-K control cell lines. Data were z normalized for heatmap visualization. Each column represents an individual RNA-seq library. (E) The relative abundance of xanthine in the SI explants from GF Xbp1ΔIEC mice with mock or allopurinol treatment (24 hours, n=5 mice per group). (F, G) Representative plots and percentages of LP Th17(F) and Treg (G) cells in the SI of allopurinol or water treatment GF Xbp1ΔIEC (n=4–5 mice per group, pooled data from two independent experiments). (H) Xdh transcripts in MODE-K cells treated with 50 ng/ml thapsigargin for 24 hours in the presence or absence of 5 mM NAC treatment (n=8 biological replicates per group). (I) Xdh expression in intestinal epithelial cell scrapings by RT-qPCR under SPF conditions (n=5–8 mice per group). (J) Relative abundance of xanthine in the SI explant samples of indicated mice under antibiotic-treated conditions (3 hours, n= 4–5). Data were presented as mean±s.e.m; Mann-Whitney U test (C, E-H), one-way ANOVA corrected with Dunnett’s multiple comparisons test (I-J); ns not significant (P>0.05), *P<0.05, **P<0.01. See also Figure S5 and Table S4, S5, S6.
Figure 6
Figure 6. IEC ER stress contributes to homeostasis microbiota and Citrobacter rodentium induced Th17 differentiation process.
(A) Heat map of ER signature genes in Jackson mice (Jac) and Jackson co-housed with Taconic mice (Jac-Tac) (from GSE1834817). Data were z normalized for heatmap visualization. Each column represents an individual mouse. (B) Immunoblot of ER stress marker GRP78 and IRE1α in the SI of Jac and Jac-Tac WT mice (n=4). (C) H2O2 concentration in the SI explant samples of Jac and Jac-Tac WT mice (3 hours, n=5 mice per group). (D-F) Representative plots and percentages of LP Th17 (D), Treg (E), and Th2 (F) cells in the SI of mock or 4-PBA treated Taconic WT mice (n=10 mice per group, pooled data from two independent experiments). (G-I) Representative plots and percentages of LP Th17 (G), Treg (H), and Th2 (I) cells in the SI of mock or allopurinol treated Taconic WT mice (n=7,10 mice per group, pooled data from two independent experiments). (J) Representative plots and percentages of LP Th17 cells in the colon of GF, Cr-wt, and Cr-Δeae colonized mice (n=5 mice per group, pooled data from two independent experiments). (K) Immunoblot of ER stress marker IRE1α and GRP78 in the colons of GF, Cr-wt, and Cr-Δeae colonized mice (n=3). (L) H2O2 concentration in the colon explant samples of GF, Cr-wt, and Cr-Δeae colonized mice (3 hours, n=5 mice per group. (M-P) Representative plots and percentages of LP Th17 (M), Treg (N), Th2 (O) and Th1 (P) cells in the colon of mock or 4-PBA treated Cr-wt colonized mice (n=9–10 mice per group, pooled data from two independent experiments). Data were presented as mean±s.e.m; Mann-Whitney U test (C-I, M-P), one-way ANOVA corrected with Dunnett’s multiple comparisons test (J, L); ns not significant (P>0.05), *P<0.05, ***P<0.001. See also Figure S6.
Figure 7
Figure 7. IEC ER stress contributes to Th17 differentiation in IBD patients.
(A) Expression of indicated genes in 92 Crohn’s disease (CD), 43 Ulcerative Colitis (UC) patients, and 55 non-IBD health controls. Data were from RNA-seq of mucosal biopsies from GSE117993. (B) Correlation analysis of indicated genes in the dataset from A Data were presented as mean±s.e.m; one-way ANOVA corrected with Dunnett’s multiple comparisons test (A); *P<0.05, **P<0.01, ***P<0.001, ****P<0.0001. See also Figure S7.

Comment in

References

    1. Goto Y, and Ivanov II (2013). Intestinal epithelial cells as mediators of the commensal-host immune crosstalk. Immunol Cell Biol 91, 204–214. 10.1038/icb.2012.80. - DOI - PMC - PubMed
    1. Hammad H, and Lambrecht BN (2015). Barrier Epithelial Cells and the Control of Type 2 Immunity. Immunity 43, 29–40. 10.1016/j.immuni.2015.07.007. - DOI - PubMed
    1. Grootjans J, Kaser A, Kaufman RJ, and Blumberg RS (2016). The unfolded protein response in immunity and inflammation. Nat Rev Immunol 16, 469–484. 10.1038/nri.2016.62. - DOI - PMC - PubMed
    1. Adolph TE, Tomczak MF, Niederreiter L, Ko HJ, Bock J, Martinez-Naves E, Glickman JN, Tschurtschenthaler M, Hartwig J, Hosomi S, et al. (2013). Paneth cells as a site of origin for intestinal inflammation. Nature 503, 272–276. 10.1038/nature12599. - DOI - PMC - PubMed
    1. Kaser A, Lee AH, Franke A, Glickman JN, Zeissig S, Tilg H, Nieuwenhuis EE, Higgins DE, Schreiber S, Glimcher LH, and Blumberg RS (2008). XBP1 links ER stress to intestinal inflammation and confers genetic risk for human inflammatory bowel disease. Cell 134, 743–756. 10.1016/j.cell.2008.07.021. - DOI - PMC - PubMed

Publication types