. 2023 Jun:273:120010.
doi: 10.1016/j.neuroimage.2023.120010. Epub 2023 Mar 12.

Homotopic local-global parcellation of the human cerebral cortex from resting-state functional connectivity

Affiliations

Homotopic local-global parcellation of the human cerebral cortex from resting-state functional connectivity

Xiaoxuan Yan et al. Neuroimage. 2023 Jun.

Abstract

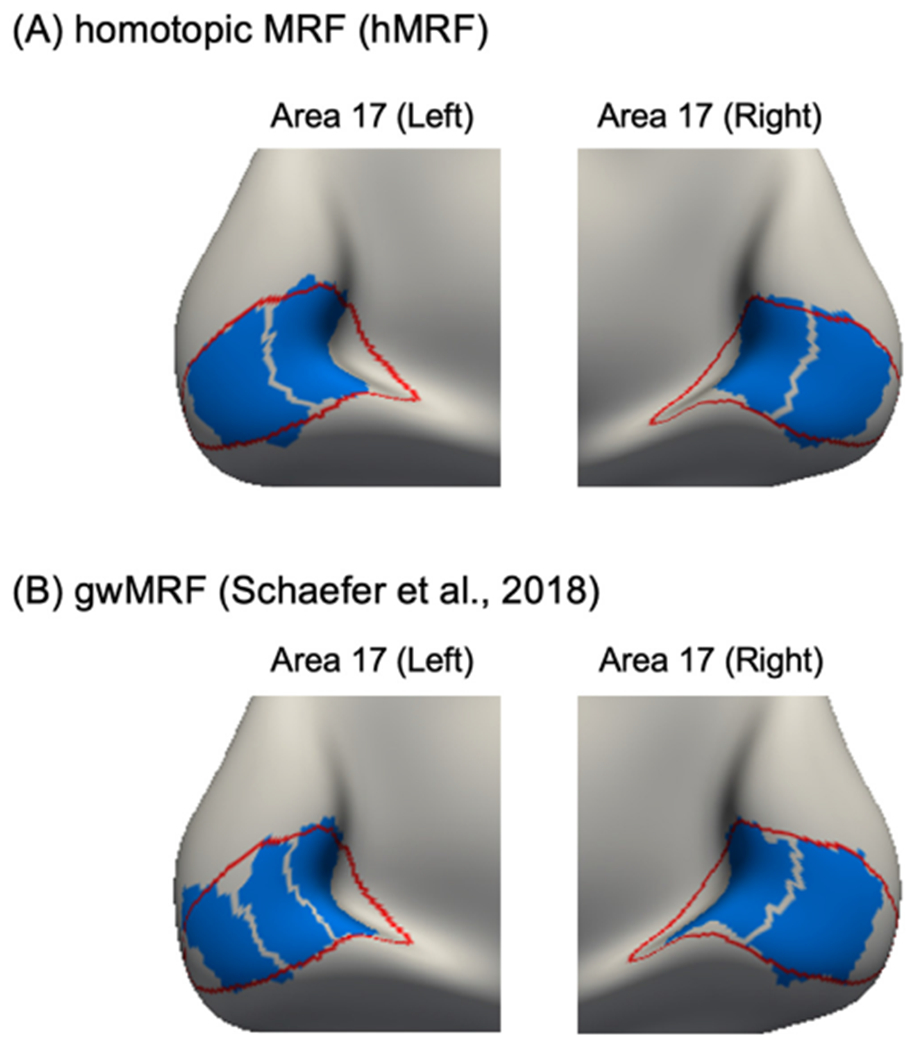
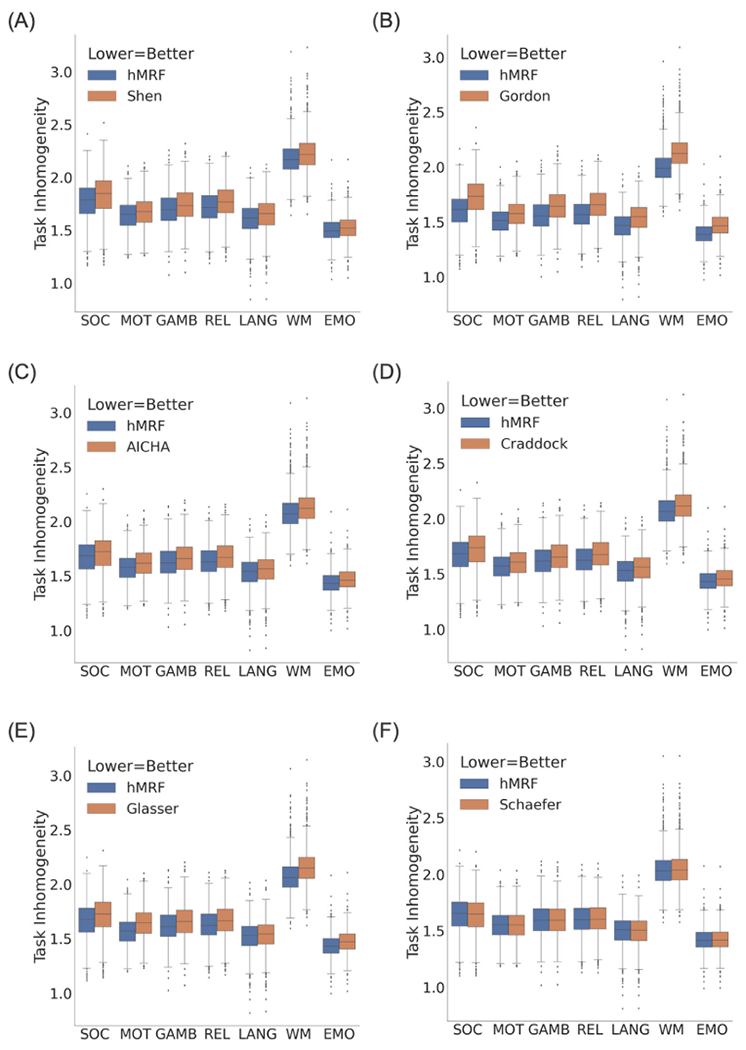
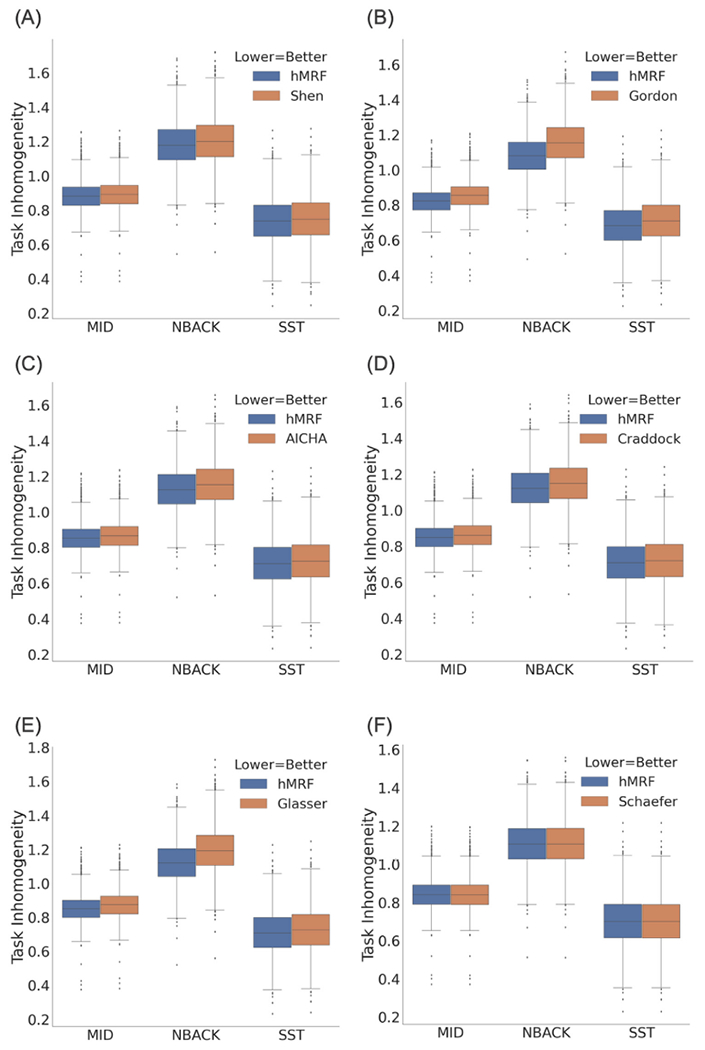
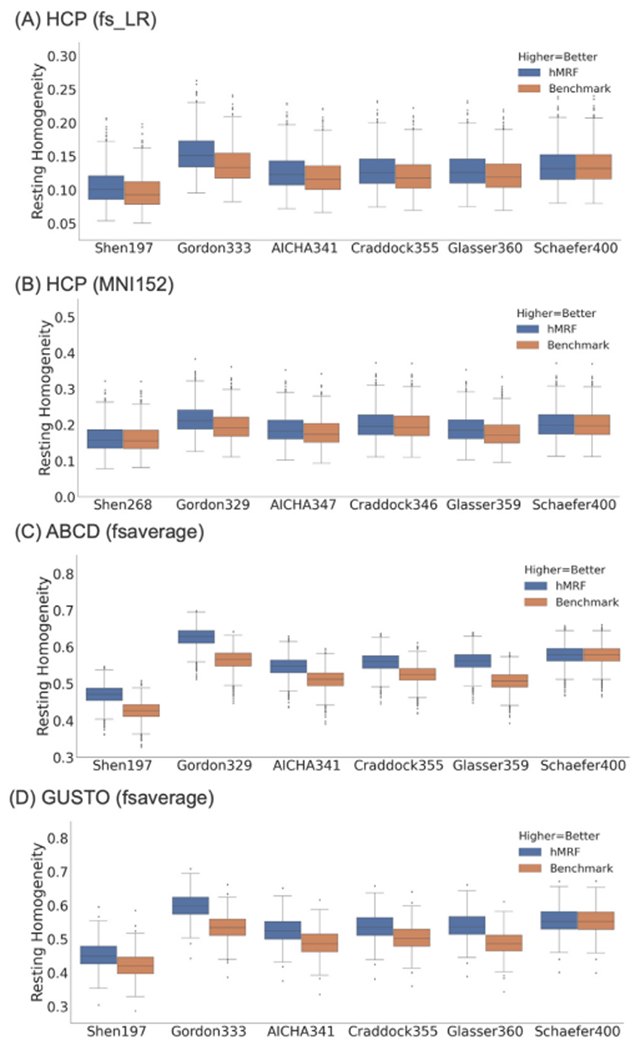
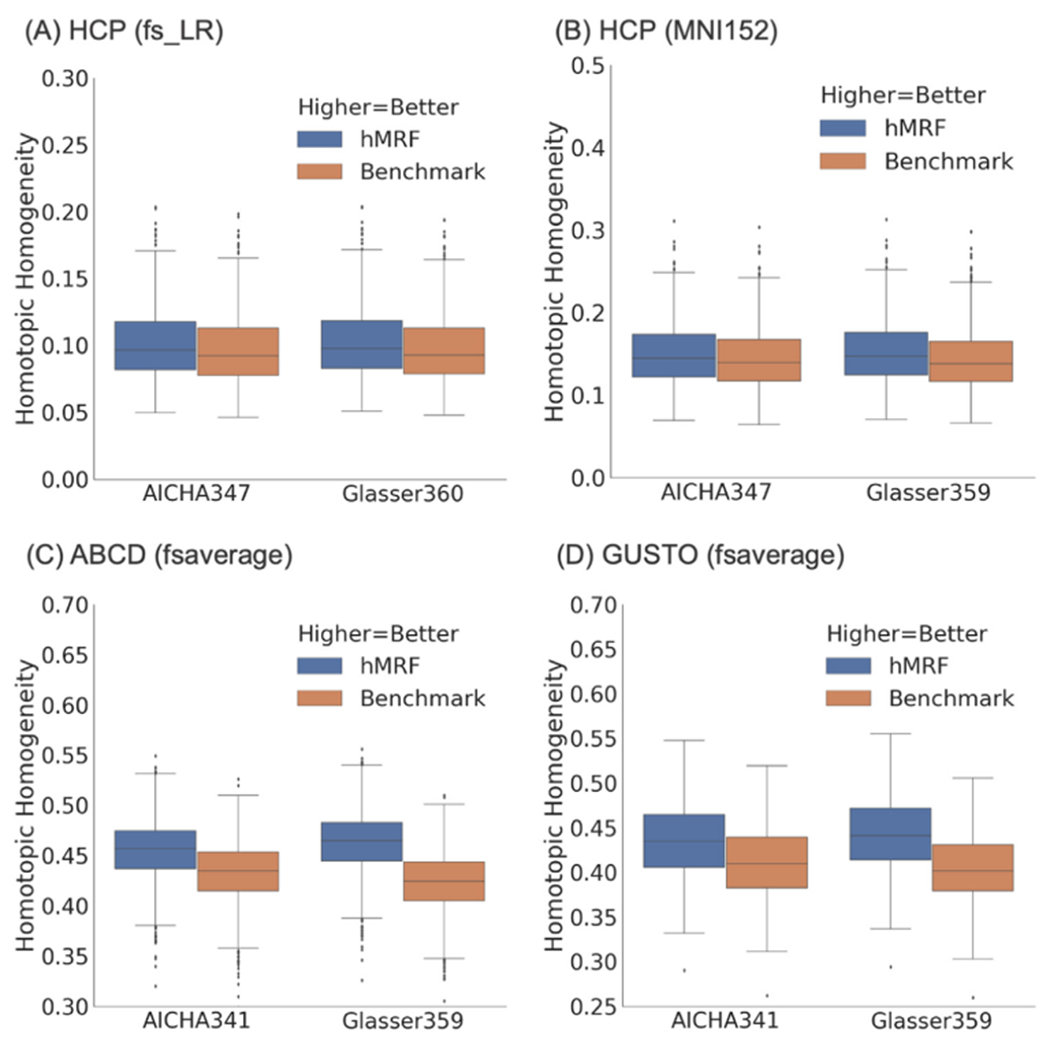
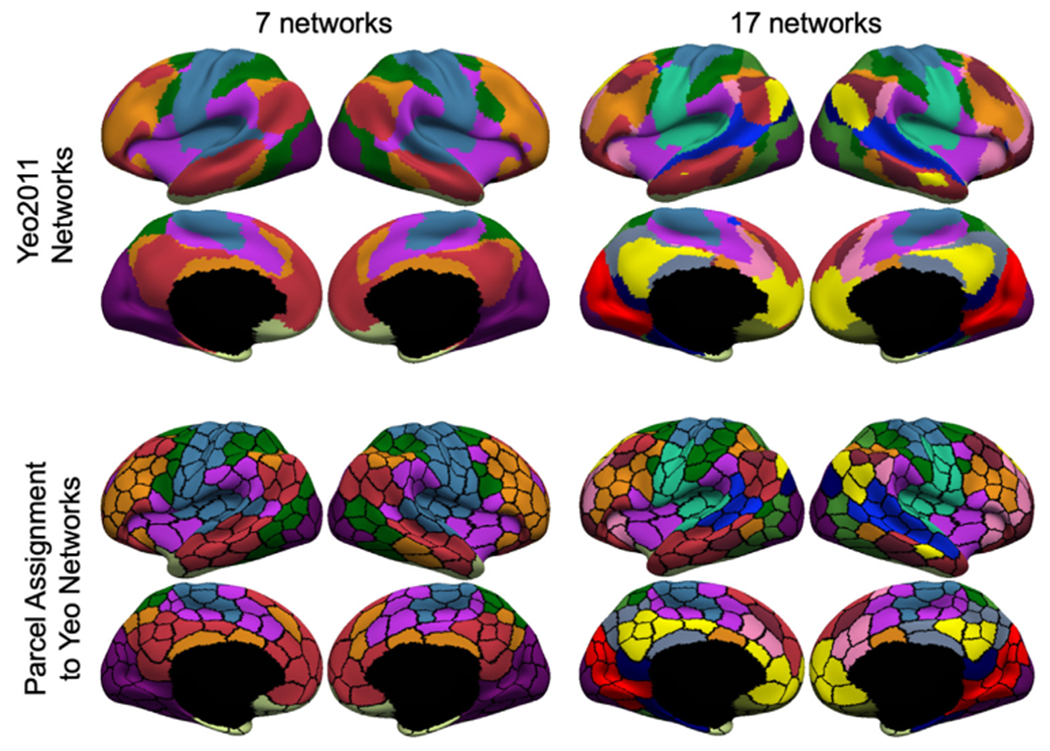
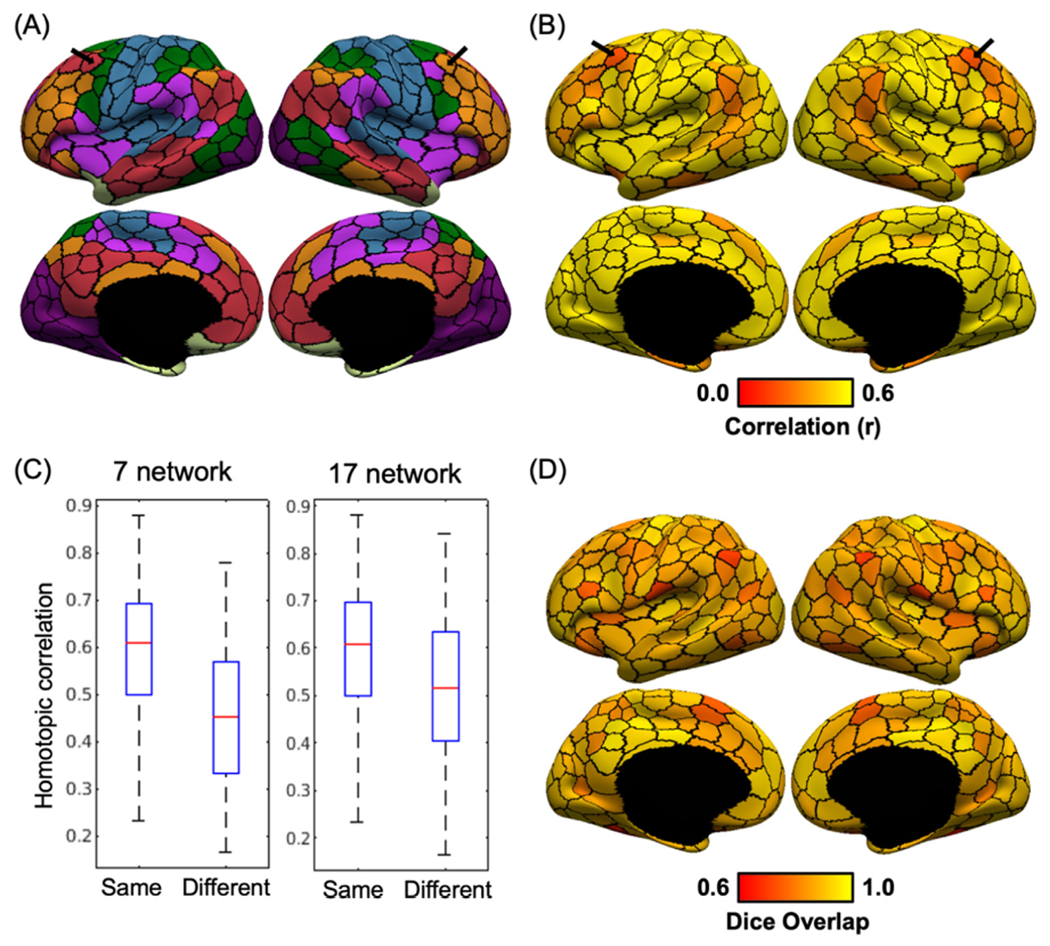
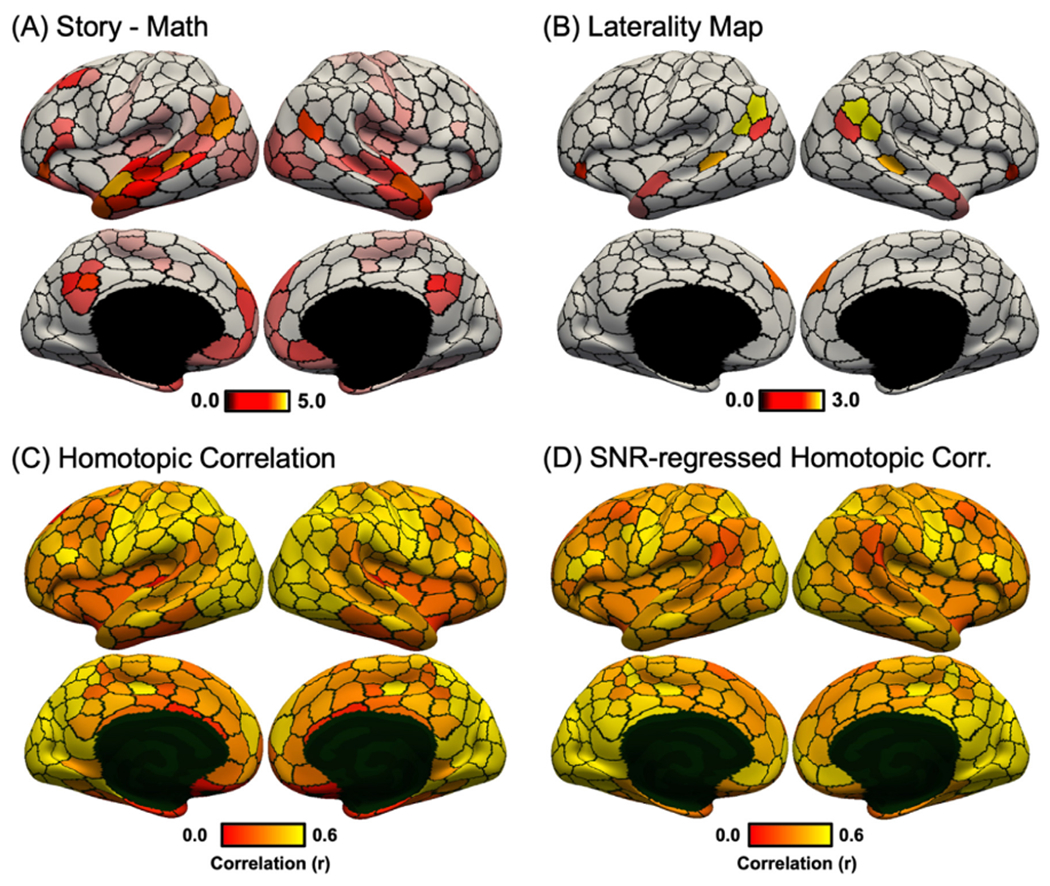
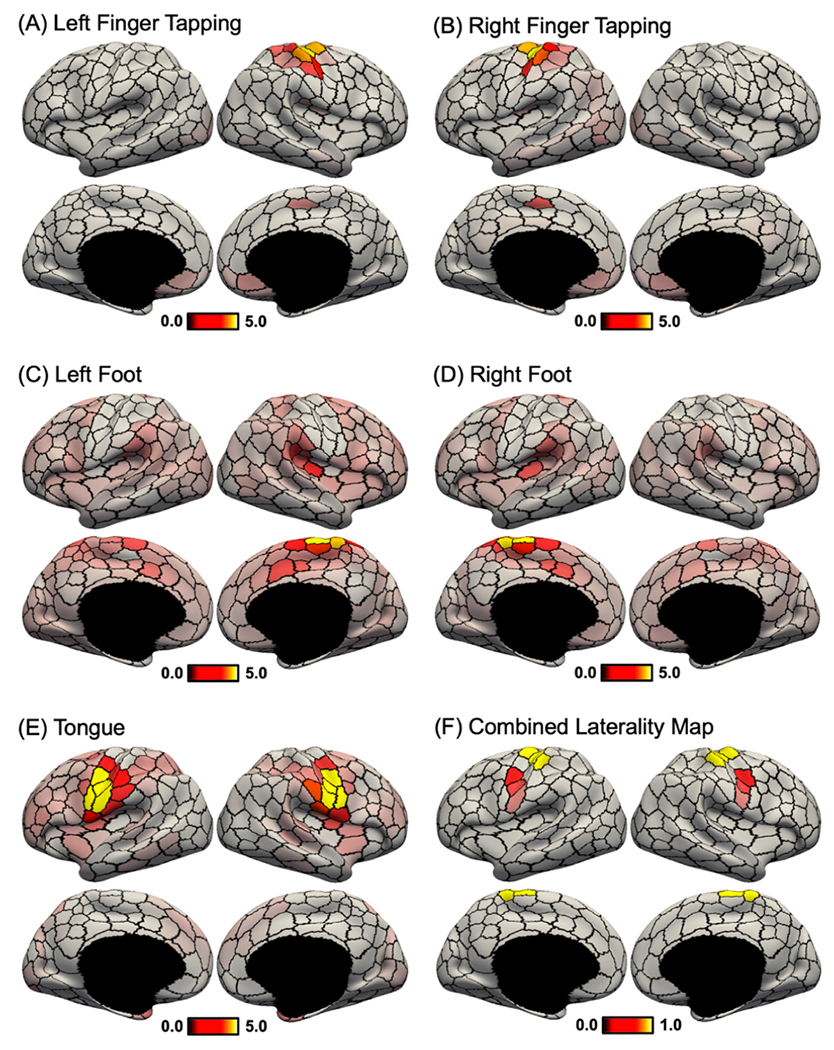
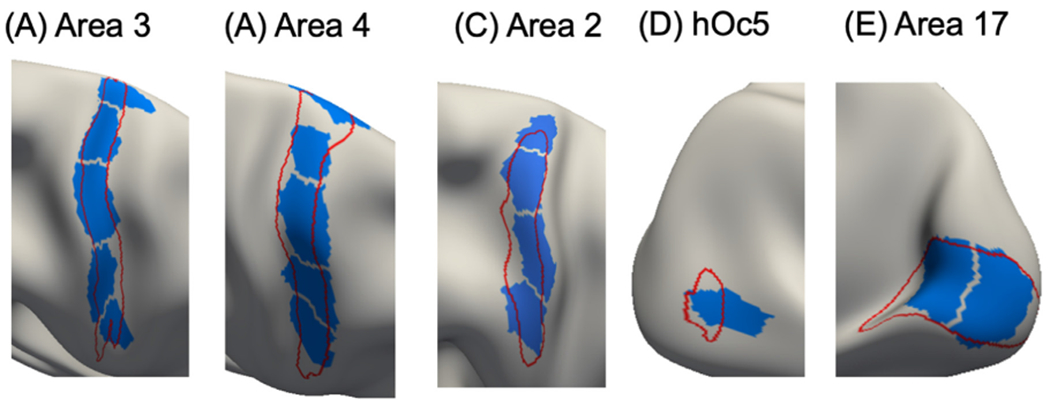
Resting-state fMRI is commonly used to derive brain parcellations, which are widely used for dimensionality reduction and interpreting human neuroscience studies. We previously developed a model that integrates local and global approaches for estimating areal-level cortical parcellations. The resulting local-global parcellations are often referred to as the Schaefer parcellations. However, the lack of homotopic correspondence between left and right Schaefer parcels has limited their use for brain lateralization studies. Here, we extend our previous model to derive homotopic areal-level parcellations. Using resting-fMRI and task-fMRI across diverse scanners, acquisition protocols, preprocessing and demographics, we show that the resulting homotopic parcellations are as homogeneous as the Schaefer parcellations, while being more homogeneous than five publicly available parcellations. Furthermore, weaker correlations between homotopic parcels are associated with greater lateralization in resting network organization, as well as lateralization in language and motor task activation. Finally, the homotopic parcellations agree with the boundaries of a number of cortical areas estimated from histology and visuotopic fMRI, while capturing sub-areal (e.g., somatotopic and visuotopic) features. Overall, these results suggest that the homotopic local-global parcellations represent neurobiologically meaningful subdivisions of the human cerebral cortex and will be a useful resource for future studies. Multi-resolution parcellations estimated from 1479 participants are publicly available (https://github.com/ThomasYeoLab/CBIG/tree/master/stable_projects/brain_parcellation/Yan2023_homotopic).


Figures

Fig. 1.
Fig. 1.
Difference in homotopic correspondence between hMRF and gwMRF parcellations within histologically-defined area 17. (A) Parcels (blue) of the 400-region hMRF parcellation within histological (red) boundaries of area 17. The hMRF parcellation subdivided left and right areas 17 into equal number of parcels with similar spatial topography across the two hemispheres. (B) Parcels (blue) of the 400-region gwMRF parcellation within histological (red) boundaries of area 17. The gwMRF parcellation subdivided left area 17 into three parcels and right area 17 into two parcels.
Fig. 2.
Fig. 2.
Task inhomogeneity computed from task-fMRI data in the HCP dataset (N = 1030). Lower task inhomogeneity indicates better parcellation quality. We note that task inhomogeneity cannot be compared across the panels because of the different number of parcels across panels. The hMRF parcellations exhibited comparable task inhomogeneity with the Schaefer parcellation and better task inhomogeneity than all other parcellations.
Fig. 3.
Fig. 3.
Task inhomogeneity computed from task-fMRI data in the ABCD dataset (N = 2262). Lower task inhomogeneity indicates better parcellation quality. We note that task inhomogeneity cannot be compared across the panels because of the different number of parcels across panels. The hMRF parcellations exhibited comparable task inhomogeneity with the Schaefer parcellation and better task inhomogeneity than all other parcellations.
Fig. 4.
Fig. 4.
Resting-fMRI homogeneity computed with the (A) HCP dataset (N = 1030) in fsLR space, (B) HCP dataset (N = 1030) in MNI152 space, (C) ABCD dataset (N = 2262) in fsaverage space, and (D) GUSTO dataset (N = 393) in fsaverage space. We note that resting-fMRI homogeneity was not comparable across different publicly available parcellations because of differences in the number of parcels. However, the number of parcels was matched between the publicly available parcellations and corresponding hMRF parcellations. The hMRF parcellations achieved comparable resting-fMRI homogeneity with the Schaefer parcellation. On the other hand, the hMRF parcellations were more homogeneous than the 5 non-Schaefer parcellations across all data sets. Resting-fMRI homogeneity in the GSP test set is shown in Fig. S4.
Fig. 5.
Fig. 5.
Homotopic resting-state functional connectivity in the (A) HCP dataset (N = 1030) in fsLR space, (B) HCP dataset (N = 1030) in MNI152 space, (C) ABCD dataset (N = 2262) in fsaverage space, and (D) GUSTO dataset (N = 393) in fsaverage space. We note that homotopic functional connectivity was not comparable between the AICHA and Glasser parcellations because of differences in the number of parcels. The hMRF parcellations achieved higher (better) homotopic functional connectivity than the Glasser and AICHA homotopic parcellations. Results in the GSP test set is shown in Fig. S5.
Fig. 6.
Fig. 6.
Assignment of parcels to 7 or 17 networks for hMRF parcellations with 400 regions. First row shows the Yeo 7 and 17 networks (Yeo et al., 2011). Second row shows the 400-region hMRF parcellation with each parcel assigned a network color based on its spatial overlap with the 7-network or 17-network parcellation.
Fig. 7.
Fig. 7.
RSFC lateralization of the 400-region hMRF parcellation. (A) Lateralization in network assignment of the 400-region hMRF parcellation. Black arrows indicate a homotopic pair of regions assigned to two different networks from the Yeo 7-network parcellation. (B) RSFC between homotopic pairs of parcels in the GSP dataset. Black arrows indicate that the homotopic pair of parcels highlighted in panel A exhibited weaker RSFC with each other (i.e., homotopic correlation) compared with other homotopic parcel pairs. (C) Boxplot of RSFC between homotopic parcel pairs assigned to the same or different networks for both 7-network and 17-network assignments. Homotopic parcel pairs assigned to the same network exhibited stronger RSFC than homotopic parcel pairs assigned to different networks. (D) Spatial overlap (as measured by Dice coefficient) between homotopic pairs of parcels.
Fig. 8.
Fig. 8.
Language task activation lateralization in the HCP dataset. (A) Group-average “story – math” language task contrast in the HCP dataset. Activation z values were averaged within each of the 400-region hMRF cortical parcellation (shown as black boundaries). (B) Group-average task laterality map defined as the absolute difference between left and right hemisphere activation values. Laterality was only computed for parcels whose average activations were at least 70% of the most activated parcel (number of suprathreshold parcels = 16). Laterality maps for alternative thresholds can be found in Fig. S14. (C) RSFC between homotopic pairs of parcels in the HCP dataset. (D) RSFC between homotopic pairs of parcels in the HCP dataset after regressing HCP SNR map (Fig. S13). There was a negative correlation between task activation laterality (Fig. 8B) and SNR-regressed homotopic correlations (Fig. 8D).
Fig. 9.
Fig. 9.
Motor task activation lateralization in the HCP dataset. (A) Group-average “left finger – average” motor task contrast. Activation z values were averaged within each of the 400-region hMRF cortical parcellation (shown as black boundaries). (B) Group-average “right finger – average” motor task contrast. (C) Group-average “left foot – average” motor task contrast. (D) Group-average “right foot – average” motor task contrast. (E) Group-average “tongue – average” motor task contrast. (F) Task laterality map averaged across the five contrasts. Similar to Fig. 8, task laterality was defined as the absolute difference between left and right hemisphere activation values. Laterality was only computed for parcels whose average activations were at least 70% of the most activated parcel (number of suprathreshold parcels = 16). Laterality maps for alternative thresholds can be found in Fig. S14. There was a negative correlation between task activation laterality (Fig. 9F) and SNR-regressed homotopic correlations (Fig. 8D).
Fig. 10.
Fig. 10.
Parcels (blue) of the 400-region hMRF parcellation overlaid on histological (red) boundaries of right hemisphere (A) area 3, (B) area 4, (C) area 2, (D) hOc5, and (E) area 17. Other histological areas are shown in Fig. S15.

References

    1. Abdollahi RO, Kolster H, Glasser MF, Robinson EC, Coalson TS, Dierker D, Jenkinson M, Van Essen DC, Orban GA, 2014. Correspondences between retinotopic areas and myelin maps in human visual cortex. Neuroimage 99, 509–524. doi: 10.1016/j.neuroimage.2014.06.042. - DOI - PMC - PubMed
    1. Aboitiz F, Scheibel AB, Fisher RS, Zaidel E, 1992. Fiber composition of the human corpus callosum. Brain Res. 598, 143–153. doi: 10.1016/0006-8993(92)90178-C. - DOI - PubMed
    1. Achard S, Salvador R, Whitcher B, Suckling J, Bullmore E, 2006. A resilient, low-frequency, small-world human brain functional network with highly connected association cortical hubs. J. Neurosci. 26, 63–72. doi: 10.1523/JNEUROSCI.3874-05.2006. - DOI - PMC - PubMed
    1. Amano K, Wandell BA, Dumoulin SO, 2009. Visual field maps, population receptive field sizes, and visual field coverage in the human MT+ complex. J. Neurophysiol 102, 2704–2718. doi: 10.1152/jn.00102.2009. - DOI - PMC - PubMed
    1. Amunts K, Malikovic A, Mohlberg H, Schormann T, Zilles K, 2000. Brodmann’s areas 17 and 18 brought into stereotaxic space—where and how variable? Neuroimage 11, 66–84. doi: 10.1006/nimg.1999.0516. - DOI - PubMed

Publication types