. 2023 May 1:271:120024.
doi: 10.1016/j.neuroimage.2023.120024. Epub 2023 Mar 12.

Measurement of Frontal Midline Theta Oscillations using OPM-MEG

Affiliations

Measurement of Frontal Midline Theta Oscillations using OPM-MEG

Natalie Rhodes et al. Neuroimage. .

Abstract

Optically pumped magnetometers (OPMs) are an emerging lightweight and compact sensor that can measure magnetic fields generated by the human brain. OPMs enable construction of wearable magnetoencephalography (MEG) systems, which offer advantages over conventional instrumentation. However, when trying to measure signals at low frequency, higher levels of inherent sensor noise, magnetic interference and movement artefact introduce a significant challenge. Accurate characterisation of low frequency brain signals is important for neuroscientific, clinical, and paediatric MEG applications and consequently, demonstrating the viability of OPMs in this area is critical. Here, we undertake measurement of theta band (4-8 Hz) neural oscillations and contrast a newly developed 174 channel triaxial wearable OPM-MEG system with conventional (cryogenic-MEG) instrumentation. Our results show that visual steady state responses at 4 Hz, 6 Hz and 8 Hz can be recorded using OPM-MEG with a signal-to-noise ratio (SNR) that is not significantly different to conventional MEG. Moreover, we measure frontal midline theta oscillations during a 2-back working memory task, again demonstrating comparable SNR for both systems. We show that individual differences in both the amplitude and spatial signature of induced frontal-midline theta responses are maintained across systems. Finally, we show that our OPM-MEG results could not have been achieved without a triaxial sensor array, or the use of postprocessing techniques. Our results demonstrate the viability of OPMs for characterising theta oscillations and add weight to the argument that OPMs can replace cryogenic sensors as the fundamental building block of MEG systems.

Keywords: Low frequency; Magnetoencephalography; Neural oscillations; Optically pumped magnetometers; Theta oscillations; Working memory.


Conflict of interest statement

Conflicts of interest V.S. is the founding director of QuSpin, a commercial entity selling OPM magnetometers. J.O. and C.D. are employees of QuSpin. E.B. and M.J.B. are directors of Cerca Magnetics Limited, a spin-out company whose aim is to commercialise aspects of OPM-MEG technology. E.B., M.J.B., R.B., N.H. and R.H. hold founding equity in Cerca Magnetics Limited.

Figures

Fig. 1.
Fig. 1.. Paradigms –
A) the visual task; B) the 2-back task.
Fig. 2.
Fig. 2.. System overviews –
A) OPM-MEG system; B) SQUID-MEG system; C) Distance from the scalp to the sensors for each participant, for both systems. Data points show values for all sensors; lines show the mean.
Fig. 3.
Fig. 3.. M agnetic field nulling results –
A) Flowchart describing the field nulling process. B) The magnitude of the homogeneous magnetic field (left), and the linear field gradients (right) before and after application of the nulling procedure. Solid circles show individual data points and lines show the field trajectories for 13 subjects. The white circles show mean values across subjects.
Fig. 4.
Fig. 4.. Visual experiment –
A-B) Pseudo-T-statistical images showing the spatial signature of changes in oscillatory power at the fundamental frequency of stimulation (note that here 4 Hz, 6 Hz and 8 Hz have been combined). A) shows the case for SQUID MEG, B) shows the case for OPM-MEG. The locations of maximum theta change in A and B are separated by 12 mm. C-E) Subject averaged Fourier spectra of from the VE at the individual’s voxel with the peak T-statistic during stimulation. C) shows the case for 4 Hz stimulation; D) shows the case for 6 Hz stimulation; E) shows the case for 8 Hz stimulation. In all three cases, SQUID data are shown in red and OPM data in blue. Shaded areas show standard deviation across subjects.
Fig. 5.
Fig. 5.. 2-back experiment –
A-B) Pseudo-T-statistical images showing the spatial signature of changes in theta band power (images show the average across subjects). A) shows the case for SQUID MEG, B) shows the case for OPM-MEG. The voxels with the highest theta change are separated by 13 mm between OPM and SQUID systems. C) Hilbert envelopes showing relative change in theta amplitude; the mean across subjects is shown and the shaded areas represent standard error. Red shows the SQUID recording, blue shows the OPMs. Stimulus cessation is shown by the dashed grey line. D–E) Subject averaged power spectral density from the virtual electrode during the task (red), rest (blue) and from the empty room noise recordings (yellow) for the SQUID measurements (D) and OPM measurements (E). The shaded areas for the task and rest windows show the standard error across the 14 participants. The shaded areas for the empty room noise recordings show standard deviation across the noise recording duration.
Fig. 6.
Fig. 6.. Individual differences –
A) SNR of the theta band response measured in the OPM data, plotted against equivalent SNR measured for the SQUID data. Note the significant (p = 0.0001) linear relationship between the two systems. The red circled data highlights a single participant, whose strong theta response somewhat reduces the slope. B) Matrix of correlation values showing the spatial relationships between pseudo-T-statistical images of task induced theta change. Crosses indicate the highest correlation value within each row. Note crosses fall on the diagonal (i.e. within-subject correlation) for 12 out of 14 subjects). C) The same correlation values in (B) but plotted as within and between subject correlations. Dots show individual data points, and the bars represent the mean. The difference was significant (p = 0.00003) according to a Monte Carlo based statistical test.
Fig. 7.
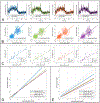
Fig. 7.. The effect of triaxial array design and homogeneous field correction –
A) Subject averaged instantaneous SNR of both the OPM (coloured) and SQUID (black) theta band responses plotted against time. B) OPM derived plotted against SQUID derived instantaneous SNR. In both A and B, the 4 columns show triaxial data with HFC (far-left) triaxial data with no HFC (centre-left), radial data with HFC (centre-right) radial data with no HFC (far-right). C) SNR values from individual subjects; SQUID plotted against OPMs (i.e. equivalent to Fig. 6A). Order of columns as above. D) The line fits to the mean for the task and rest windows from the data in (B) overlaid. The slope of the line represents the relationship between SQUID and OPM instantaneous SNR values. E) the lines from C overlaid. Notice in both D and E that the slope of the line is diminished by removing tangential axes, and by removing HFC

References

    1. Baillet S, 2017. Magnetoencephalography for brain electrophysiology and imaging. Nat. Neurosci 20, 327–339. - PubMed
    1. Barry DM, Tierney TM, Holmes N, Boto E, Roberts G, Leggett J, Bowtell R, Brookes MJ, Barnes GR, Maguire EA, 2019. Imaging the human hippocampus with optically-pumped magnetoencephalography. Neuroimage 203, 116192. - PMC - PubMed
    1. Borna A, Iivanainen J, Carter TR, Mckay J, Taulu S, Stephen J, Schwindt PD, 2022. Cross-Axis projection error in optically pumped magnetometers and its implication for magnetoencephalography systems. Neuroimage 247, 118818. - PMC - PubMed
    1. Boto E, Bowtell RW, Krüger P, Fromhold M, Morris PG, Meyer S, Barnes GR, Brookes MJ, 2016. On the potential of a new generation of magnetometers for MEG: a Beamformer simulation study. PLoS ONE 11 (8), e0157655. - PMC - PubMed
    1. Boto E, Holmes N, Leggett J, Roberts G, Shah V, Meyer SS, Duque Muñoz L, Mullinger KJ, Tierney TM, Bestmann S, Barnes GR, Bowtell R, Brookes MJ, 2018. Moving magnetoencephalography towards real-world applications with a wearable system. Nature 555, 657. - PMC - PubMed

Publication types