. 2023 Mar;11(3):e006292.
doi: 10.1136/jitc-2022-006292.

Preclinical proof of concept for VivoVec, a lentiviral-based platform for in vivo CAR T-cell engineering

Affiliations

Preclinical proof of concept for VivoVec, a lentiviral-based platform for in vivo CAR T-cell engineering

Kathryn R Michels et al. J Immunother Cancer. 2023 Mar.

Abstract

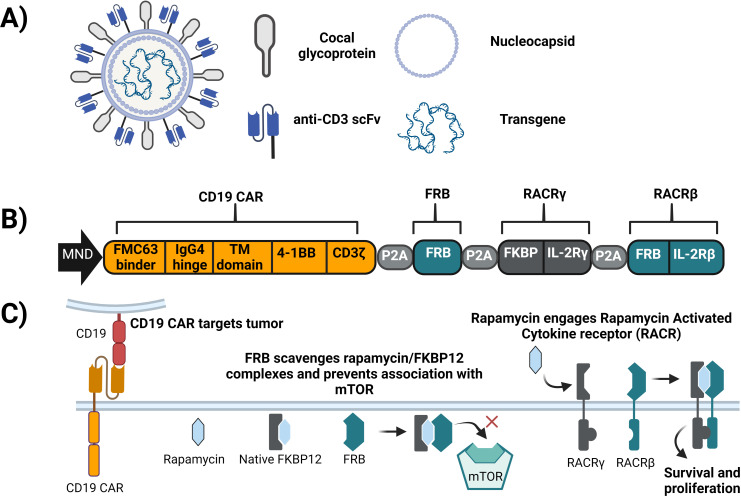
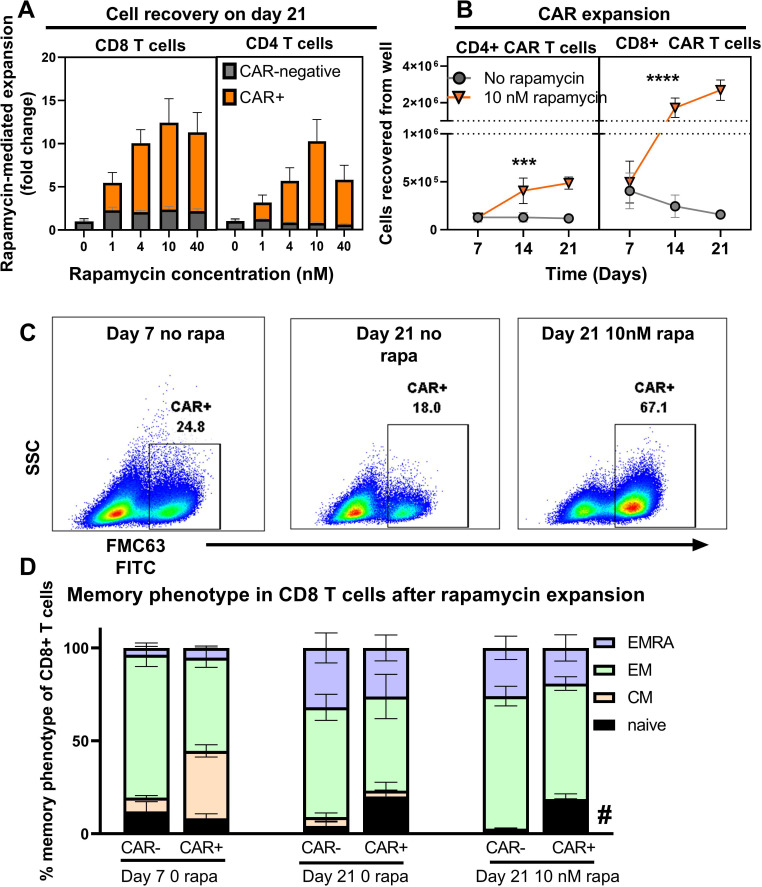
Background: Chimeric antigen receptor (CAR) T-cell therapies have demonstrated transformational outcomes in the treatment of B-cell malignancies, but their widespread use is hindered by technical and logistical challenges associated with ex vivo cell manufacturing. To overcome these challenges, we developed VivoVec, a lentiviral vector-based platform for in vivo engineering of T cells. UB-VV100, a VivoVec clinical candidate for the treatment of B-cell malignancies, displays an anti-CD3 single-chain variable fragment (scFv) on the surface and delivers a genetic payload that encodes a second-generation CD19-targeted CAR along with a rapamycin-activated cytokine receptor (RACR) system designed to overcome the need for lymphodepleting chemotherapy in supporting successful CAR T-cell expansion and persistence. In the presence of exogenous rapamycin, non-transduced immune cells are suppressed, while the RACR system in transduced cells converts rapamycin binding to an interleukin (IL)-2/IL-15 signal to promote proliferation.

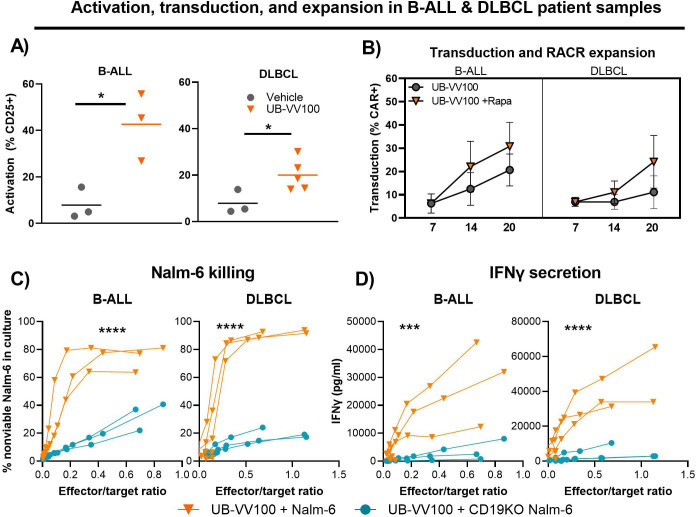
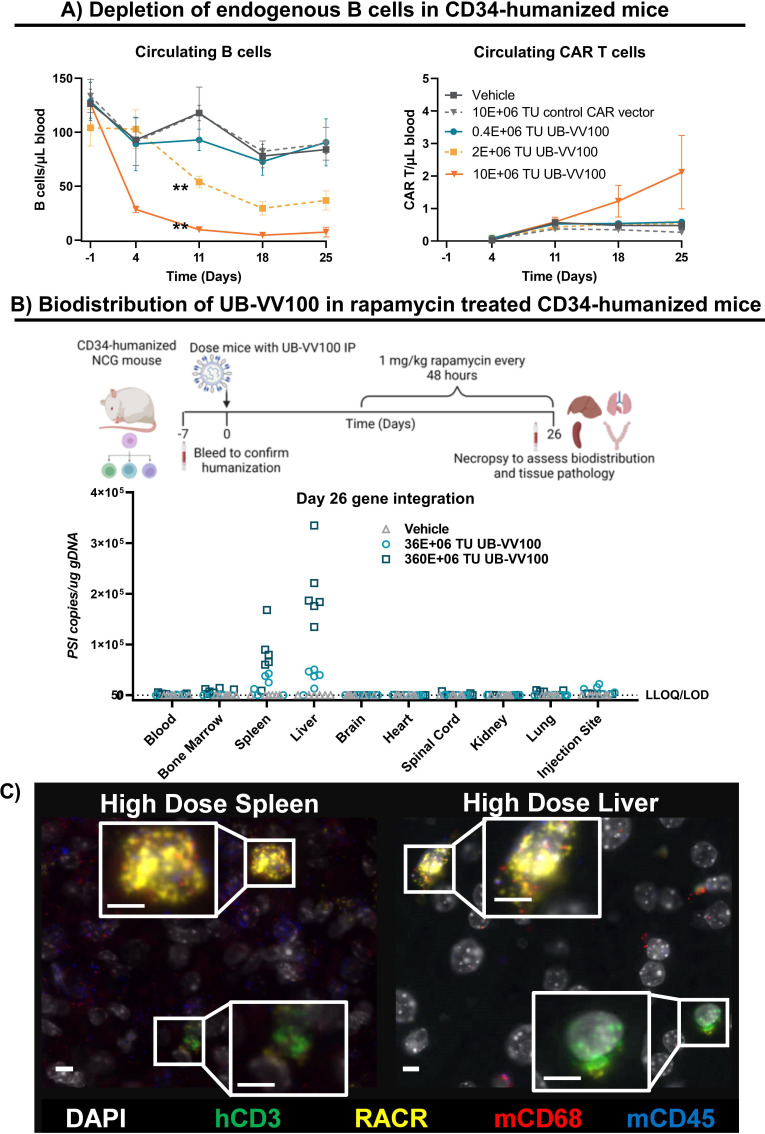
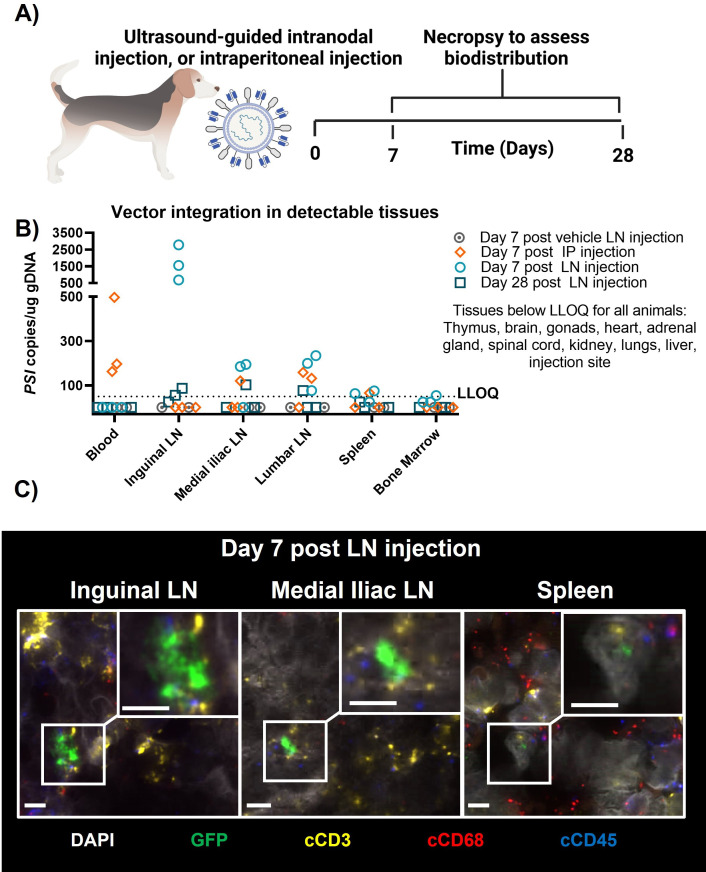
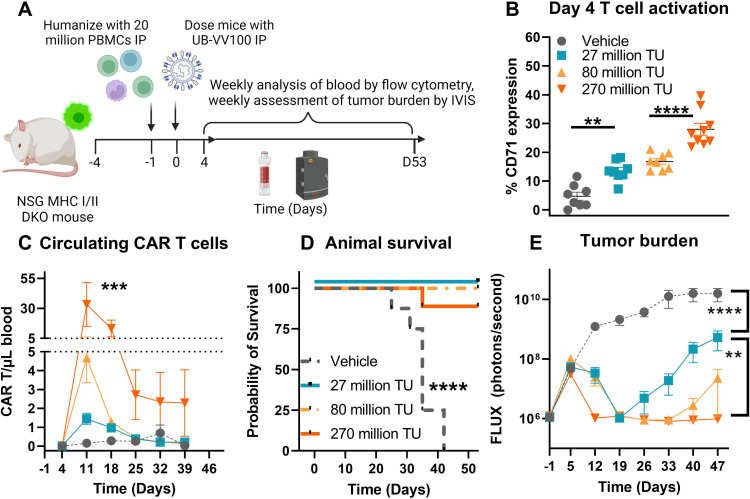
Methods: UB-VV100 was administered to peripheral blood mononuclear cells (PBMCs) from healthy donors and from patients with B-cell malignancy without additional stimulation. Cultures were assessed for CAR T-cell transduction and function. Biodistribution was evaluated in CD34-humanized mice and in canines. In vivo efficacy was evaluated against normal B cells in CD34-humanized mice and against systemic tumor xenografts in PBMC-humanized mice.

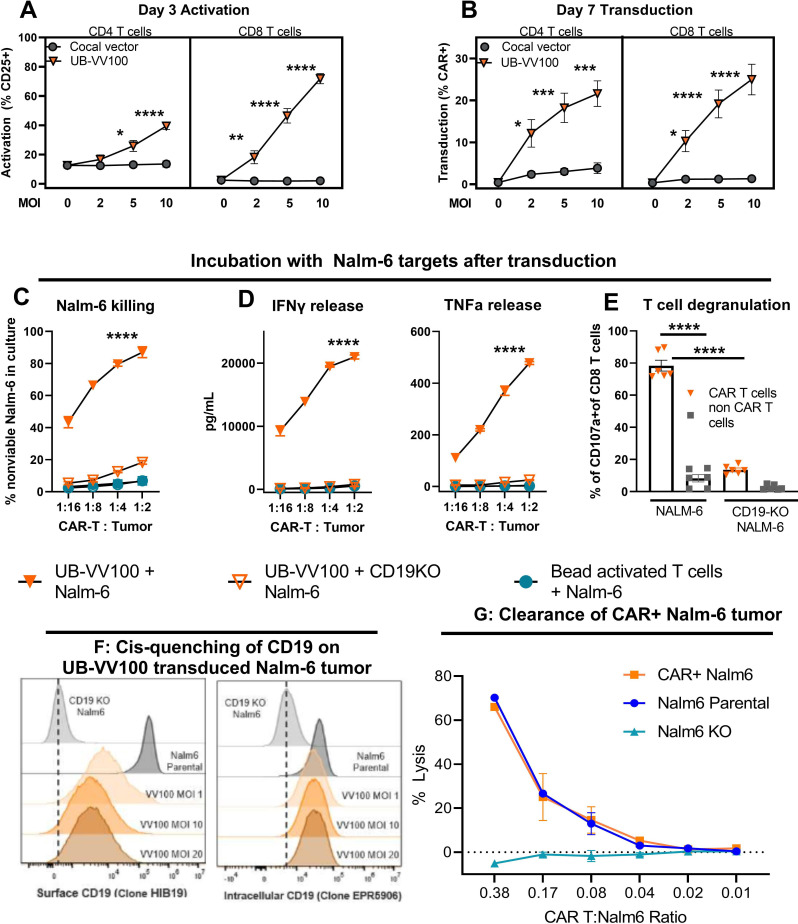
Results: In vitro, administration of UB-VV100 resulted in dose-dependent and anti-CD3 scFv-dependent T-cell activation and CAR T-cell transduction. The resulting CAR T cells exhibited selective expansion in rapamycin and antigen-dependent activity against malignant B-cell targets. In humanized mouse and canine studies, UB-VV100 demonstrated a favorable biodistribution profile, with transduction events limited to the immune compartment after intranodal or intraperitoneal administration. Administration of UB-VV100 to humanized mice engrafted with B-cell tumors resulted in CAR T-cell transduction, expansion, and elimination of systemic malignancy.

Conclusions: These findings demonstrate that UB-VV100 generates functional CAR T cells in vivo, which could expand patient access to CAR T technology in both hematological and solid tumors without the need for ex vivo cell manufacturing.

Keywords: Cell Engineering; Drug Evaluation, Preclinical; Immunotherapy; Receptors, Chimeric Antigen; Translational Medical Research.


Conflict of interest statement

Competing interests: All authors hold equity with Umoja Biopharma.

Figures

Figure 1
Figure 1
Overview of UB-VV100. (A) UB-VV100 is a third-generation replication-incompetent lentiviral vector. UB-VV100 is pseudotyped with cocal glycoprotein and displays anti-CD3 scFv moieties to mediate T-cell activation and transduction. (B) The UB-VV100 transgene encodes a polycistronic payload driven by the MND promoter and separated by P2A peptide fragments. The resulting proteins are a second-generation anti-CD19 CAR, FRB, and the RACR. RACR is a chimeric heterodimer consisting of FKBP extracellular unit attached to an IL-2Rγ signaling domain and an FRB extracellular unit attached to an IL-2Rβ signaling domain. (C) The components of UB-VV100 work together to mediate tumor killing and promote cell survival. CAR, chimeric antigen receptor; FRB, FKBP12–rapamycin-binding protein; IL, interleukin; RACR, rapamycin-activated cytokine receptor; scFv, single-chain variable fragment.
Figure 2
Figure 2
UB-VV100 activates and transduces unstimulated T cells. UB-VV100 is added directly to cultured PBMCs in the presence of IL-2 and no additional stimulation. Activation, transduction, and rapamycin-mediated expansion are evaluated in the wells. (A) T-cell activation, measured by expression of CD25 (IL-2 receptor alpha), 3 days after vector addition. (B) T-cell transduction frequency, measured by surface FMC63 CAR expression, 7 days after vector addition at the indicated MOI. Data points represent mean±1 SEM. Data represent pooled results of n=5 for three unique donors analyzed in two independent experiments. The symbol * indicates significance using two-way ANOVA full interaction model with Tukey’s tests for multiple comparison on the indicate time point. (C) PBMCs transduced with UB-VV100 were incubated with CD19 KO Nalm-6 or parental Nalm-6 at varying E:T cell ratios as indicated. PBMCs activated with CD3/CD28 beads and incubated with parental Nalm-6 were used as an additional negative control. Cocultures were assessed for detection of dead Nalm-6 cells by flow cytometry and (D) release of IFN-γ and TNF-α into the culture supernatant. The symbol * denotes values indicating significance for ordinary two-way ANOVA, comparison of UB-VV100+Nalm-6 compared with the other groups at the indicated time point by Tukey’s postcomparison test. Partial results are related for simplicity. n=3 unique donors per group, combined the result of two independent experiments originally performed in technical duplicate. (E) CAR T cells were cultured with Nalm6 cells at an E:T of 1:2 for 4 hours, and degranulation was measured in P2A+CAR+ CD8+ T cells or P2A−negative non-CAR CD8+ T cells by flow cytometric detection of extracellular CD107a. The symbol * indicates significance for one-way ANOVA. Data represent two donors pooled from two independent experiments in technical duplicates. Nalm-6 cells were transduced with UB-VV100 at MOIs 1, 10, and 20. On day 10, CAR+Nalm-6 cells were stained with an anti-CD19 antibody (clone HIB19) to assess (F) surface CD19 expression levels and an anti-CD19 antibody that binds to an intracellular CD19 epitope (clone EPR5906) to determine the total CD19 protein level. (G) CAR T cells (VV100, MOI 5) from three healthy donors were cocultured with CAR+Nalm6 cells (VV100, MOI 10), non-transduced Nalm6 parental cells, or CD19 KO Nalm6 cells (Nalm6 KO) at multiple CAR T to Nalm6 ratios. After 24 hours of coculture, CAR+Nalm6 cells were identified based on P2A transgene expression, and the frequency of dead Nalm6 cells was determined by viability dye staining via flow cytometry. The percentage of lysis was calculated as the frequency of dead CAR+Nalm6 cells normalized to lysis of Nalm6 cells cocultured with mock transduced PBMCs. Data points represent mean±SEM. *P<0.05, **P<0.01, ***P<0.001, ****P<0.0001 for all data panels for the indicated analysis. ANOVA, analysis of variance; CAR, chimeric antigen receptor; E:T, effector-to-target; IFN-γ, interferon gamma; KO, knockout; MOI, multiplicity of infection; PBMC, peripheral blood mononuclear cell; TNF-α, tumor necrosis factor alpha.
Figure 3
Figure 3
Rapamycin promotes selective expansion of CAR T cells. (A) PBMCs were transduced with UB-VV100 at an MOI of 5 for 3 days before vector removal. Cells were transferred to wells containing the indicated concentration of rapamycin and cultured for an additional 18 days. On study day 21, CAR+ and CAR-negative T-cell expansion was enumerated by flow cytometry. n=5, pooled results from two independent experiments using three separate PBMC donors. Data points indicate mean±1 SEM. (B) PBMCs treated as described (A) at the 10 nM rapamycin concentration were analyzed by flow cytometry to determine the absolute CD4 and CD8 CAR T-cell counts. n=6 per group per time point, pooled results of two independent experiments using three PBMC donors. Axis is split to allow separation of CD4 and CD8 T cells to be seen on the same scale. Symbols (*) indicate statistical significance for two-way ANOVA, main column analysis of effect of rapamycin treatment on cell expansion or enrichment over time series. Data points indicate mean±1 SEM; some error bars not visible due to eclipse by data symbol. PBMCs were transduced with MOI=5 with UB-VV100 and expanded for 18 days with rapamycin (study day 21 after transduction). T cells were assessed by flow cytometry for (C) representative flow staining of surface FMC63 detection and (D) memory phenotype. Representative plots show a single donor. CAR+ T cells are overlaid in red over total T-cell population. Memory phenotype was quantified for CD8+ T cells for day 7 no rapamycin, day 21 no rapamycin, day 21+10 nM rapamycin, in both the CAR+ and CAR-negative fractions. Naïve (CCR7+CD45RA+). Symbol (*) indicates p value of < 0.05 for two-way ANOVA, Tukey’s multiple comparison’s test for comparing the ‘naïve’ population of the CAR+ fraction to the naïve population of the CAR-negative fraction on study day 21+10 nM rapamycin. n=6 from replicate measurements of three unique PBMC donors per condition, results from one experiment. ANOVA, analysis of variance; CAR, chimeric antigen receptor; CM, central memory (CCR7+CD45RA−); EM, effector memory (CCR7−CD45RA+); EMRA, effector memory re-expressing CD45RA (CCR7−CD45RA+); MOI, multiplicity of infection; PBMC, peripheral blood mononuclear cell.
Figure 4
Figure 4
UB-VV100 transduces functional CAR T cells from patient samples. In two separate experiments, PBMCs from patients with B-ALL and DLBCL were transduced with UB-VV100 at MOI of 5. (A) On day 3, the frequencies of T cells expressing CD25 were assessed in B-ALL and DLBCL samples. On day 7 post UB-VV100 transduction, cells were further cultured in the absence or presence of 10 nM rapamycin. *P<0.05, Student’s t-test. Bars indicate mean. (B) The frequencies of CAR T cells on days 7, 14, and 20 were determined by flow cytometry. On day 20, rapamycin-expanded CAR T cells from B-ALL and DLBCL patient samples were cocultured with Nalm-6 or CD19KO Nalm-6 tumor cells. (C) After 24 hours of coculture, the frequency of non-viable Nalm-6 tumor targets was determined by viability dye staining via flow cytometry. ****P<0.001, two-way ANOVA, main effect analysis for Nalm-6 identity. (D) The concentration of IFN-γ in the coculture supernatant was also measured in both B-ALL and DLBCL samples. Data points indicate mean±1 SEM. ***P<0.001, ****P<0.0001, two-way ANOVA, main effect analysis for Nalm-6 identity. ANOVA, analysis of variance; CAR, chimeric antigen receptor; IFN-γ, interferon gamma; MOI, multiplicity of infection.
Figure 5
Figure 5
UB-VV100 mediates B-cell depletion in CD34-humanized mice with a favorable biodistribution profile. (A) CD34-humanized NSG mice were injected with 0.4, 2.0, or 10.0 E+06 TUs of UB-VV100. Control animals were injected with vehicle only or 10E+06 TU of cocal pseudotyped vector displaying an αCD3 scFv and encoding an irrelevant (control) CAR. Circulating B cells and circulating T cells were enumerated by flow cytometry once a week for 25 days. **P<0.01, two-way ANOVA, Tukey’s multiple comparison’s test for main effect of vector dose. (B) CD34-humanized NCG mice were treated with either 36E+06 or 360E+06 TU UB-VV100 and were administered 1 mg/kg rapamycin every 48 hours beginning on day 5. Biodistribution of transduced cells was evaluated on day 28 by detection of the viral element PSI in genomic DNA tissue samples using qPCR. (C) Liver and spleen of mice treated with 360E+06 TU UB-VV100 were analyzed by RNA ISH to characterize the identity of cells expressing UB-VV100 RNA transcripts using colocalization analysis. Representative images depict human T cells (CD3+) and mouse macrophages (CD68+) transduced by UB-VV100. White indicates DAPI nuclear stain; green denotes human CD3; yellow denotes RACR sequence of transduced cells; red denotes murine CD68; blue denotes murine CD45. ANOVA, analysis of variance CAR, chimeric antigen receptor; ISH, in situ hybridization; RACR, rapamycin-activated cytokine receptor; scFv, single-chain variable fragment; TU, transducing unit.
Figure 6
Figure 6
Biodistribution of surface-engineered lentiviral vectors in a canine. (A) Canines were treated with either 4E+08 TU CD3-cocal-GFP via ultrasound-guided bilateral inguinal lymph node injection or 4E+9 TU CD3-cocal-GFP via intraperitoneal injection. Necropsy was performed after either 1 or 4 weeks to assess lentiviral integration biodistribution profiles. (B) Biodistribution of transduced cells was evaluated by detection of the viral element PSI in genomic DNA blood and tissue samples using qPCR. Only organs with transduction events detected over the LLOQ are shown. (C) RNA ISH was performed to characterize the identity of cells expressing EGFP RNA transcripts using colocalization analysis. Representative images depict canine T cells transduced by CD3-cocal-GFP in the inguinal lymph node, medial iliac lymph node, and spleen 1 week after intranodal injection. Original magnification ×40; scale bars indicate 5 µM. White denotes DAPI nuclear stain; green denotes eGFP of transduced cells; yellow denotes canine CD3; red denotes canine CD68; blue denotes canine CD45. eGFP, enhanced green fluorescent; ISH, in situ hybridization; IP, intraperitoneal; LLOQ, lower limit of quantification; LN, lymph node;TU, transducing unit.
Figure 7
Figure 7
UB-VV100 treatment results in in vivo transduction of CAR T cells and clearance of Nalm-6 tumor. (A) Animals were engrafted with Nalm-6 tumor on study day −4 via tail vein injection, humanized with 20E+06 PBMCs on day −1 via intraperitoneal injection, and treated with 27 million, 80 million or 270 million TU of UB-VV100 on study day 0 via intraperitoneal injection. (B) T-cell activation was assessed on day 4 by flow cytometry. **P<0.01, ****P<0.0001, one-way ANOVA, Tukey’s multiple comparison test between the indicated groups. (C) Circulating CAR T cells were enumerated by flow cytometry surface staining against FMC63. ***P<0.001, one-way ANOVA for day 11. n=7–9 per group per time point. (D) Animal survival was evaluated during the study. (E) Average tumor burden as assessed by bioluminescent imaging. (F) Heatmap of bioluminescent imaging data overlayed with mouse images. The last observed in-life photon flux data were reported for deceased animals at the indicated time points. **P<0.01, ****P<0.0001, two-way ANOVA, multiple comparisons between the indicated UB-VV100 dose level across the entire observation period. n=7–9 per group, ****P<0.0001, Mantel-Cox test. ANOVA, analysis of variance; CAR, chimeric antigen receptor; IVIS, In Vivo Imaging System; PBMC, peripheral blood mononuclear cell; TU, transducing unit.

References

    1. Neelapu SS, Locke FL, Bartlett NL, et al. . Axicabtagene ciloleucel CAR T-cell therapy in refractory large B-cell lymphoma. N Engl J Med 2017;377:2531–44. 10.1056/NEJMoa1707447 - DOI - PMC - PubMed
    1. Maude SL, Laetsch TW, Buechner J, et al. . Tisagenlecleucel in children and young adults with B-cell lymphoblastic leukemia. N Engl J Med 2018;378:439–48. 10.1056/NEJMoa1709866 - DOI - PMC - PubMed
    1. Schuster SJ, Svoboda J, Chong EA, et al. . Chimeric antigen receptor T cells in refractory B-cell lymphomas. N Engl J Med 2017;377:2545–54. 10.1056/NEJMoa1708566 - DOI - PMC - PubMed
    1. Snyder S, Albertson T, Garcia J, et al. . Travel-related economic burden of chimeric antigen receptor T cell therapy administration by site of care. Adv Ther 2021;38:4541–55. 10.1007/s12325-021-01839-y - DOI - PMC - PubMed
    1. Ravindranath A, Dubey A, Suresh S, et al. . Car-T cell therapy in india requires a paradigm shift in training, education and health care processes. Cytotherapy 2022;24:101–9. 10.1016/j.jcyt.2021.09.007 - DOI - PubMed

Publication types

Substances

LinkOut - more resources