. 2023 Mar 14;14(1):1399.
doi: 10.1038/s41467-023-37146-z.

Executioner caspases restrict mitochondrial RNA-driven Type I IFN induction during chemotherapy-induced apoptosis

Affiliations

Executioner caspases restrict mitochondrial RNA-driven Type I IFN induction during chemotherapy-induced apoptosis

Shane T Killarney et al. Nat Commun. .

Abstract

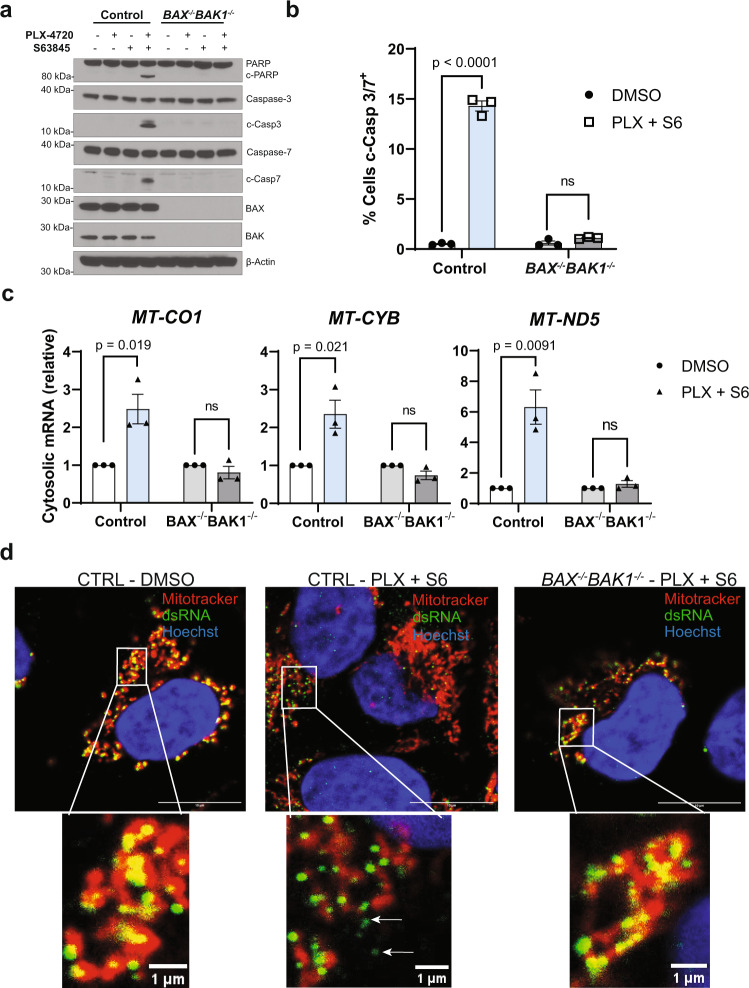
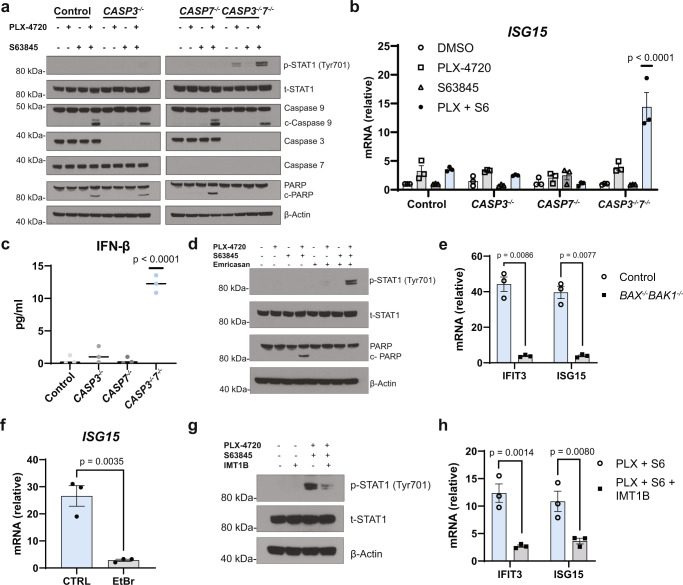
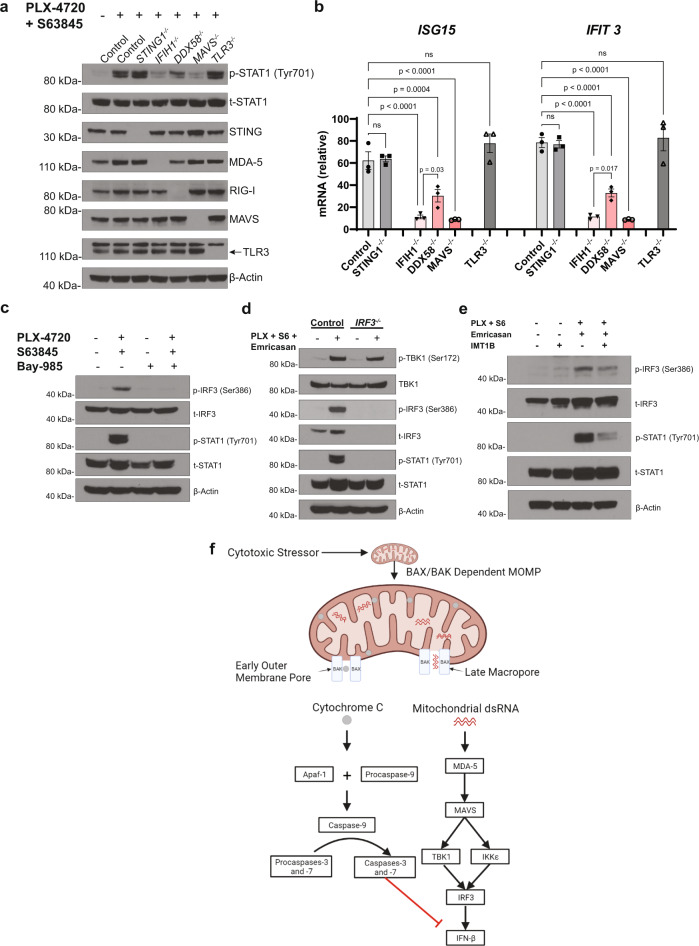
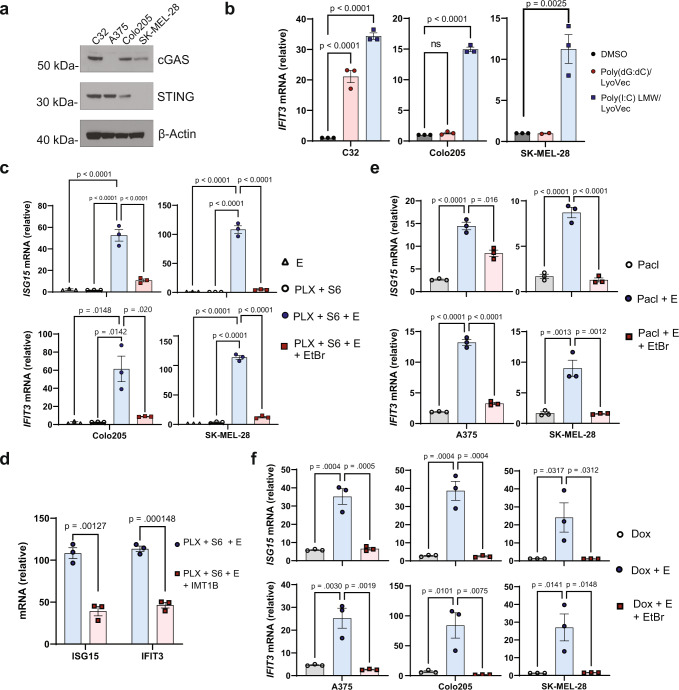
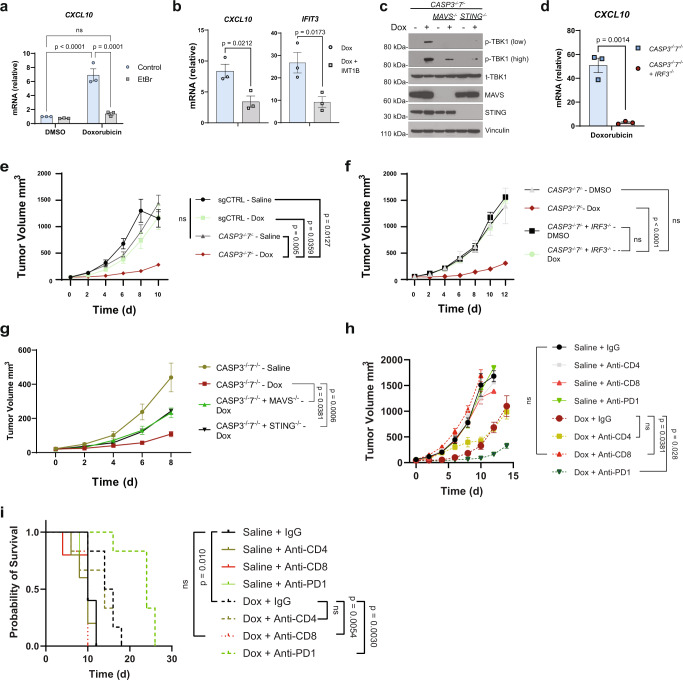
During apoptosis, mitochondrial outer membrane permeabilization (MOMP) enables certain mitochondrial matrix macromolecules to escape into the cytosol. However, the fate of mitochondrial RNA (mtRNA) during apoptosis is unknown. Here, we demonstrate that MOMP results in the cytoplasmic release of mtRNA and that executioner caspases-3 and -7 (casp3/7) prevent cytoplasmic mtRNA from triggering inflammatory signaling. In the setting of genetic or pharmacological casp3/7 inhibition, apoptotic insults result in mtRNA activation of the MDA5/MAVS/IRF3 pathway to drive Type I interferon (IFN) signaling. This pathway is sufficient to activate tumor-intrinsic Type I IFN signaling in immunologically cold cancer models that lack an intact cGAS/STING signaling pathway, promote CD8+ T-cell-dependent anti-tumor immunity, and overcome anti-PD1 refractoriness in vivo. Thus, a key function of casp3/7 is to inhibit inflammation caused by the cytoplasmic release of mtRNA, and pharmacological modulation of this pathway increases the immunogenicity of chemotherapy-induced apoptosis.


Conflict of interest statement

K.C.W. is a founder, consultant, and equity holder at Tavros Therapeutics and Celldom and has performed consulting work for Guidepoint Global, Bantam Pharmaceuticals, and Apple Tree Partners. The remaining authors declare no competing interests.

Figures

Fig. 1
Fig. 1. Engagement of mitochondrial outer membrane permeabilization releases mtdsRNA into the cytoplasm in a BAX- and BAK-dependent manner.
A375 BAX-/-BAK1-/- or wild-type control cells were treated with 0.5 µM PLX-4720 (PLX), 0.5 µM S63845 (S6), or the combination for 36 h before performing the following experiments. a Western blot showing expression of the indicated proteins; representative of three independent experiments (n = 3). b Flow cytometry measurement of CellEvent™ cleaved casp3/7 FITC positive cells. c RT-qPCR of mtRNA from an isolated cytosolic fraction following the specified drug treatment in A375 wild-type or BAX-/-BAK1 cells. mRNA levels are normalized to each cell line’s DMSO treated control. Cytosolic TBP was used as the housekeeping gene. d Immunofluorescence images of dsRNA with an anti-dsRNA (J2) antibody were taken. Mitochondria and nuclei are stained with MitoTracker Deep Red and Hoechst, respectively. Scale bars, 10 μm, in original image. Data are representative of two non-overlapping images. Arrows indicate cytosolic dsRNA. b, c Each dot represents a biological replicate from three independent experiments (n = 3). Two-tailed unpaired t-test, p-values are included in the figure; ns = not significant. Data are presented as mean ± SEM.
Fig. 2
Fig. 2. Caspases-3 and -7 inhibit mtRNA-dependent IFN-β production during apoptosis.
A375 wild-type control, CASP3-/-, CASP7-/-, and CASP3-/-7-/- cells were treated with 0.5 µM PLX-4720 (PLX), 0.5 µM S63845 (S6), or the combination for 24 h before performing a western blot for the indicated proteins and b RT-qPCR analysis of ISG15 expression; Two-way ANOVA with Tukey’s multiple-comparisons test, p-values are included in the figure. Data are presented as mean ± SEM. c ELISA analysis for secreted IFN-β collected from conditioned media of A375 wild-type control, CASP3-/-, CASP7-/-, and CASP3-/-7-/- cells following treatment with 2 µM PLX-4720 and 2 µM S63845 for 24 h; One-way ANOVA with Tukey’s multiple-comparison test, p-values are included in the figure. Data are presented as mean ± SEM. d Western blot for the specified proteins from A375 wild-type lysates treated with the indicated combinations of 0.5 µM PLX-4720, 0.5 µM S63845, and 10 µM Emricasan for 24 h. e RT-qPCR analysis for IFIT3 and ISG15 expression in wild-type control and BAX-/-BAK1-/- A375 cells following treatment of 0.5 µM PLX-4720, 0.5 µM S63845, and 10 µM Emricasan for 24 h. f A375 wild-type cells were subjected to 5 days of ethidium bromide (EtBr) (100 ng/ml) or control-media pre-treatment. The pre-treated EtBr and control cells were exposed to 0.5 µM PLX-4720, 0.5 µM S63845, and 10 µM Emricasan for 24 h, and RT-qPCR analysis of ISG15 expression was performed. mRNA levels were normalized to DMSO-treated control cells. g A375 CASP3-/-7-/- cells were treated with the indicated combinations of PLX-4720 (0.5 µM), S63845 (0.5 µM), and IMT1B (2.5 µM) for 24 h and a western blot of the specified proteins was performed. h A375 CASP3-/-7-/- cells were treated with PLX-4720 (0.5 µM) and S63845 (0.5 µM) in the presence or absence of 2.5 µM IMT1B. mRNA levels were normalized to DMSO-treated A375 CASP3-/-7-/- cells. a, d, g The data are a representation of three independent experiments (n = 3). b, c, e, f, h Each dot represents a biological replicate, and the data are the results of three independent experiments (n = 3). e, f, h Two-tailed unpaired t-test, p-values are included in the figure. Data are presented as mean ± SEM. b, e mRNA levels are normalized to DMSO-treated control cells.
Fig. 3
Fig. 3. mtRNA activates the MAVS signaling pathway during CICD.
a Western blot taken from A375 CASP3-/-7-/- cell lysates with an additional CRISPR/Cas9 knockout against the indicated genes. The isogenic cell lines were treated with either DMSO or 0.5 µM PLX-4720 and 0.5 µM S63845 for 24 h. TLR3 protein is shown by the identified band on the blot. The data are representative of two independent experiments (n = 2). b A375 CASP3-/-7-/- cells with an additional knockout against the designated gene were treated under identical conditions as in (a), and RT-qPCR analysis was performed to measure ISG15 and IFIT3 transcript levels. Each dot represents a biological replicate, and the data are the results of three independent experiments (n = 3); one-way ANOVA with Tukey’s multiple-comparisons test, p-values are included in the figure; ns = not significant. Data are presented as mean ± SEM. mRNA levels were normalized to DMSO-treated control cells. c A375 CASP3-/-7-/- cells were treated with PLX-4720 (2 µM) and S63845 (2 µM) in the presence or absence of the TBK1/IKKε inhibitor Bay-985 (0.2 µM) for 24 h and western blots for the indicated proteins were performed on the lysates. d Western blot displaying specified proteins from A375 wild-type control or IRF3-/- cells following treatment with 2 µM PLX-4720 (PLX), 2 µM S63845 (S6), and 10 µM Emricasan for 24 h. e Western blot of A375 wild-type cells following 24 h treatment with the indicated combination of PLX-4720, S63845, Emricasan, and IMT1B. f Proposed mechanism for mtRNA signaling in apoptosis created with BioRender.com. ce The data are representative of three independent experiments (n = 3).
Fig. 4
Fig. 4. CICD triggers mtRNA-dependent Type I IFN production in cGAS/STING pathway deficient tumor cells.
a Western blot showing C32, A375, Colo205, and SK-MEL-28 baseline expression of indicated proteins. Data are representative of three independent experiments (n = 3). b Indicated cell lines were treated with 0.5 µg/ml Poly(dG:dC)/LyoVec (cytosolic dsDNA agonist) or Poly(I:C) (LMW)/LyoVec (cytosolic dsRNA agonist) for 16 h. RT-qPCR analysis was performed to measure IFIT3 expression. Each dot represents a biological replicate, and A375 and Colo205 experiments were performed in biological triplicate (n = 3). SKMEL28 dsDNA treatment was performed in duplicate (n = 2), and dsRNA treatment was performed in triplicate (n = 3). c Colo205 and SK-MEL-28 cells were subjected to 5 days of EtBr (100 ng/ml) or control-media pre-treatment. The pre-treated EtBr and control cells were exposed to the designated combinations of 2 µM PLX-4720 and 2 µM S63845 (PLX + S6) and 10 µM Emricasan (E) for 48 h. ISG15 and IFIT3 transcripts were measured with RT-qPCR. d SK-MEL-28 cells were treated with 2 µM PLX-4720, 2 µM S63845, and 10 µM Emricasan in the presence or absence of 2.5 µM IMT1B for 36 h. RT-qPCR was performed to measure expression levels of ISG15 and IFIT3. e, f A375, Colo205, and SK-MEL-28 cells were conditioned with EtBr or control media as described above. e EtBr and control media-treated A375 and SK-MEL-28 cells were subjected to 30 nM and 10 nM paclitaxel (Pacl), respectively, with or without Emricasan (E) for 48 h. RT-qPCR was performed to measure expression levels of ISG15 and IFIT3. f EtBr and control-treated A375, Colo205, and SK-MEL-28 were treated with 300 nM, 200 nM, and 200 nM doxorubicin (Dox), respectively, with or without 10 µM Emricasan (E) for 48 h. RT-qPCR was performed to measure expression levels of ISG15 and IFIT3. cf, Each dot represents a biological replicate, and the data are the results of three independent experiments (n = 3). bf mRNA levels are normalized to DMSO-treated control cells. One-way ANOVA with Tukey’s multiple-comparison test, p-values are included in the figure; ns = not significant. Data are presented as mean ± SEM.
Fig. 5
Fig. 5. Tumor-intrinsic mtRNA signaling contributes to CD8+-dependent anti-tumor immunity during CICD.
a B16 CASP3-/-7-/- cells were subjected to 5 days of ethidium bromide (EtBr) (100 ng/ml) or control-media pre-treatment before treatment with 1.5 µM doxorubicin for 24 h. RT-qPCR analysis of CXCL10 expression was performed. b B16 CASP3-/-7-/- cells were treated with 1.5 µM doxorubicin in the presence or absence of 5 µM IMT1B for 24 h before RT-qPCR analysis measuring CXCL10 and IFIT3 expression. Two-tailed unpaired t-test, p-values are included in the figure. Data are presented as mean ± SEM. c Western blot performed on B16 CASP3-/-7-/- cells with an additional CRISPR/Cas9 knockout against the specified protein after 24 h treatment with 1.5 µM of doxorubicin. Data are representative of three independent experiments (n = 3). d RT-qPCR analysis of CXCL10 expression in B16 CASP3-/-7-/- cells with or without IRF3 knockout following treatment of 1.5 µM doxorubicin for 24 h. e Tumor volume growth curves after subcutaneous injection of B16 wild-type control or CASP3-/-7-/- cells in the flanks of C57BL/6 mice treated with either doxorubicin (Dox) or saline. All treatment groups had a sample size of seven mice (n = 7) except Dox-treated CASP3-/-7-/- tumors, where six mice were used (n = 6). f Tumor volume growth curves after subcutaneous injection of B16 CASP3-/-7-/- cells with or without IRF3 knockout in the flanks of C57BL/6 mice treated with either doxorubicin (Dox) or saline. CASP3-/-7-/- tumors had a sample size of five mice (n = 5). CASP3-/-7-/- + IRF3-/- tumors had a sample size of six mice (n = 6). g Tumor volume growth curves after subcutaneous injection of B16 CASP3-/-7-/- cells with an additional knockout against STING or MAVS in the flanks of C57BL/6 mice treated with either doxorubicin (Dox) or saline. CASP3-/-7-/- tumors had a sample size of seven mice (n = 7). CASP3-/-7-/- + MAVS-/- and CASP3-/-7-/- + STING-/- tumors had a sample size of five mice (n = 5). h Tumor volume growth curves from mice after subcutaneous injection of B16 CASP3-/-7-/- cells in the flanks of C57BL/6 mice were treated with either doxorubicin (Dox) or saline in the presence of the indicated antibodies. These results are combined from two independent experiments. All saline treatment groups had a sample size of five mice (n = 5). All doxorubicin treatment groups had a sample size of six mice (n = 6). (i) Kaplan–Meier survival of mice in experiment (h). Statistical analysis by two-way ANOVA with Tukey’s multiple-comparison test in eh and log-rank Mantel-Cox test in (i), p-values included in the figure. Data are presented as mean ± SEM; ns = not significant. a, d One-way ANOVA with Tukey’s multiple-comparison test was performed; p-values are included in the figure; ns = not significant. Data are presented as mean ± SEM. mRNA levels were normalized to DMSO-treated control B16 cells.

References

    1. Galluzzi L, et al. Molecular mechanisms of cell death: recommendations of the Nomenclature Committee on Cell Death 2018. Cell Death Differ. 2018;25:486–541. doi: 10.1038/s41418-017-0012-4. - DOI - PMC - PubMed
    1. Tait SWG, Green DR. Mitochondria and cell death: outer membrane permeabilization and beyond. Nat. Rev. Mol. Cell Biol. 2010;11:621–632. doi: 10.1038/nrm2952. - DOI - PubMed
    1. Kluck RM, Bossy-Wetzel E, Green DR, Newmeyer DD. The release of cytochrome c from mitochondria: a primary site for Bcl-2 regulation of apoptosis. Science. 1997;275:1132–1136. doi: 10.1126/science.275.5303.1132. - DOI - PubMed
    1. Riley JS, et al. Mitochondrial inner membrane permeabilisation enables mtDNA release during apoptosis. EMBO J. 2018;37:e99238. doi: 10.15252/embj.201899238. - DOI - PMC - PubMed
    1. McArthur K, et al. BAK/BAX macropores facilitate mitochondrial herniation and mtDNA efflux during apoptosis. Science. 2018;359:eaao6047. doi: 10.1126/science.aao6047. - DOI - PubMed

Publication types