. 2023 Mar;25(3):453-466.
doi: 10.1038/s41556-023-01098-9. Epub 2023 Mar 13.

STING signalling is terminated through ESCRT-dependent microautophagy of vesicles originating from recycling endosomes

Affiliations

STING signalling is terminated through ESCRT-dependent microautophagy of vesicles originating from recycling endosomes

Yoshihiko Kuchitsu et al. Nat Cell Biol. 2023 Mar.

Abstract

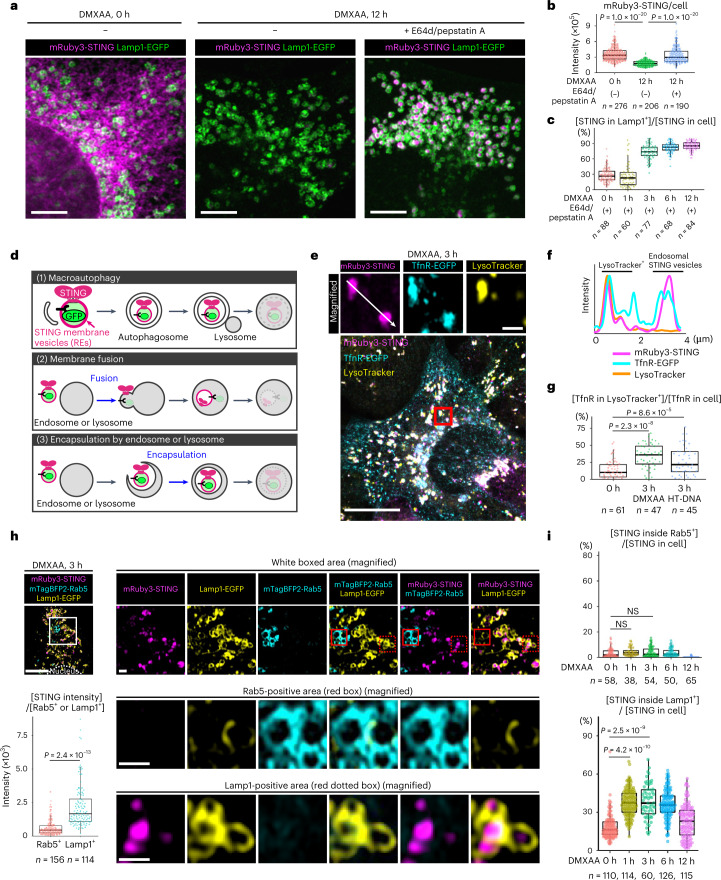
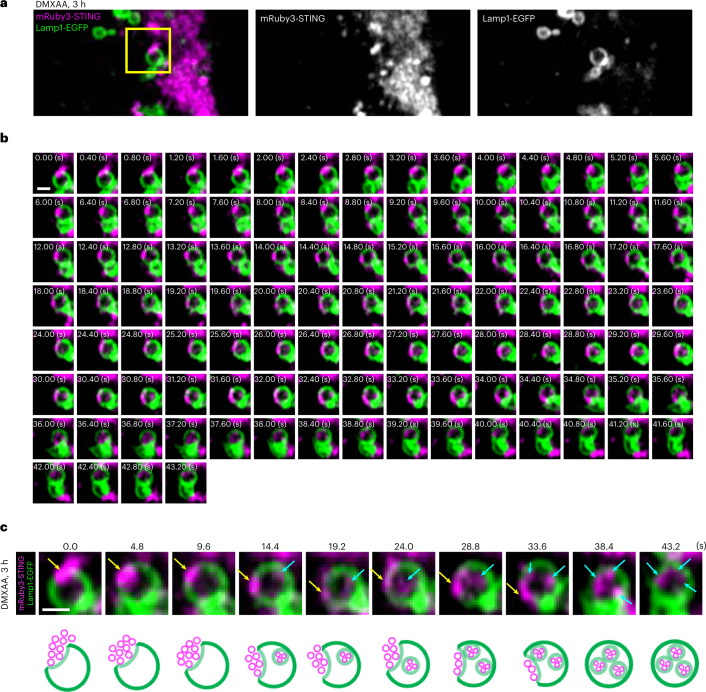
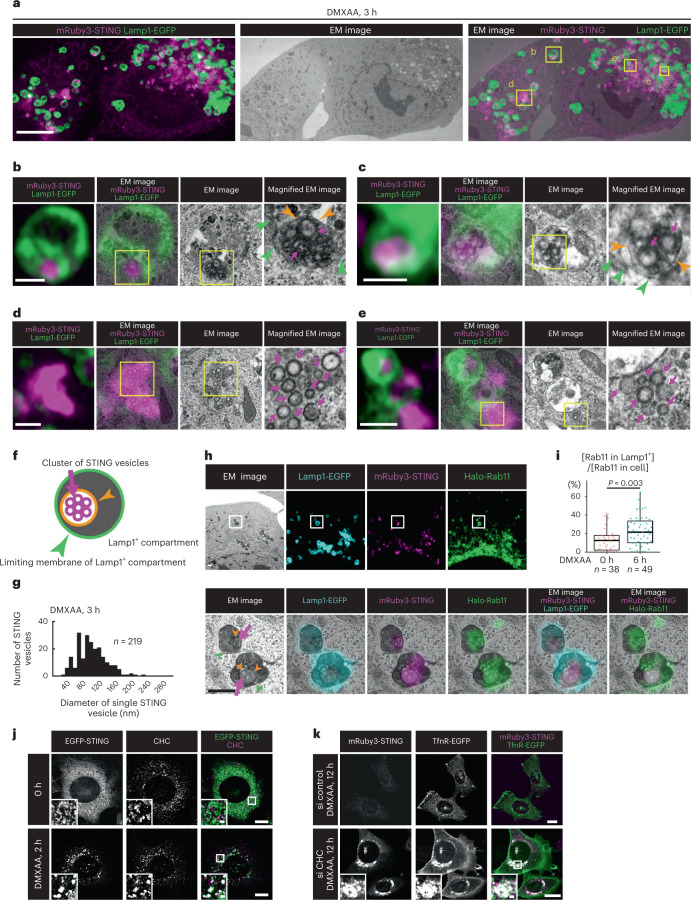
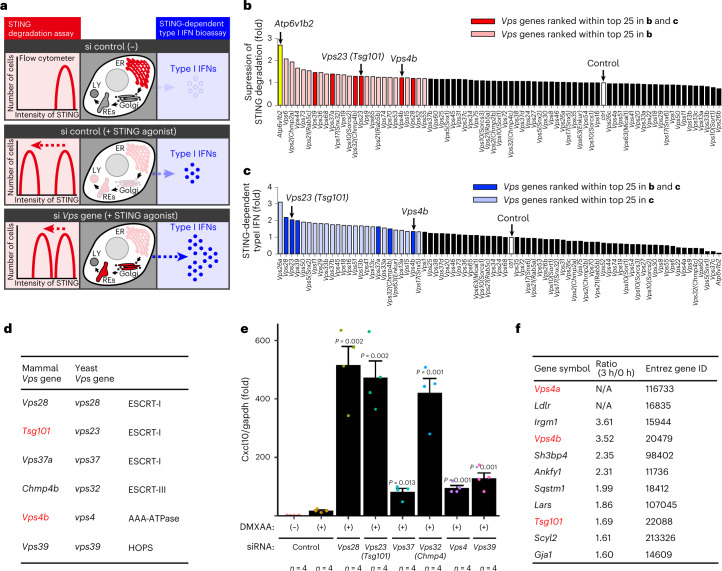
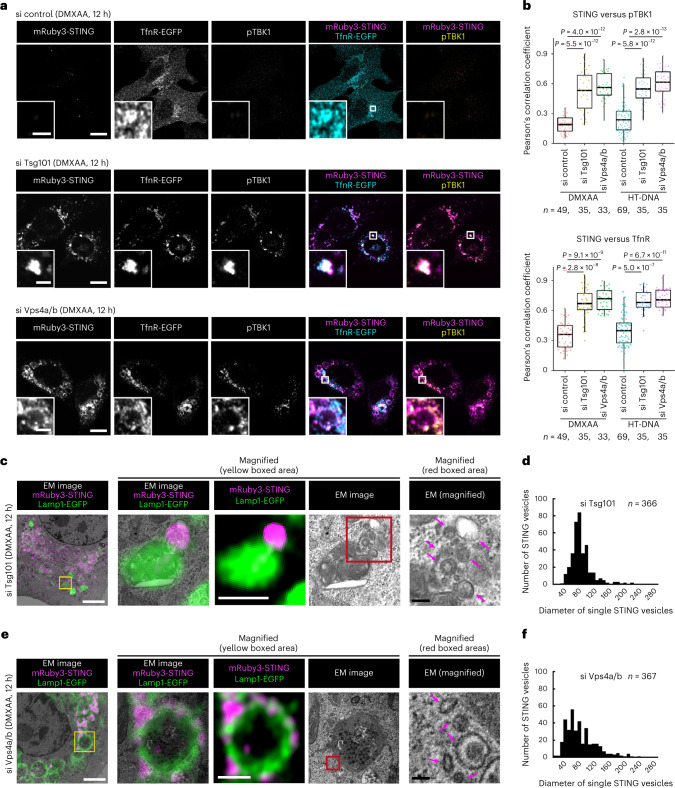
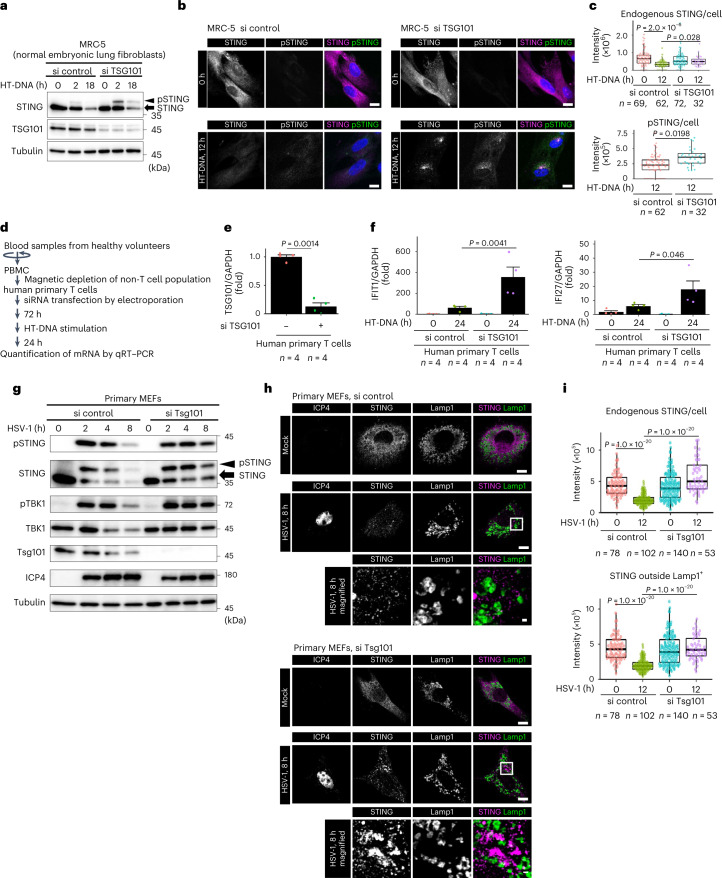
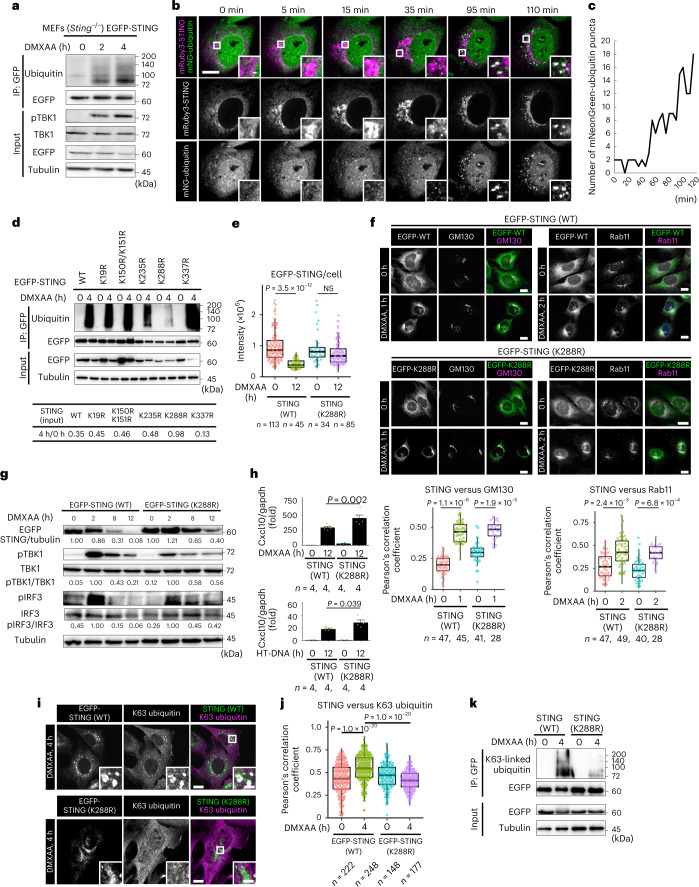
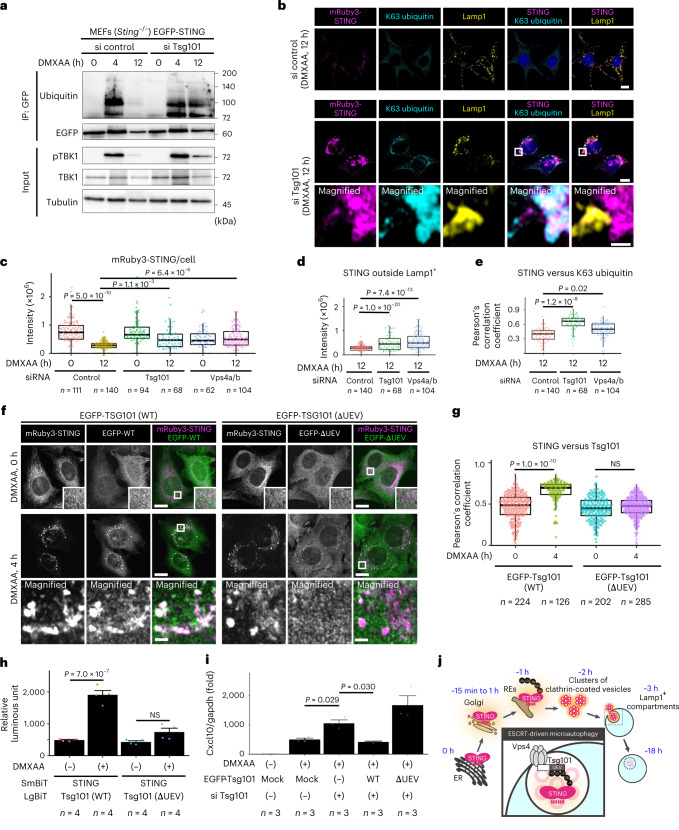
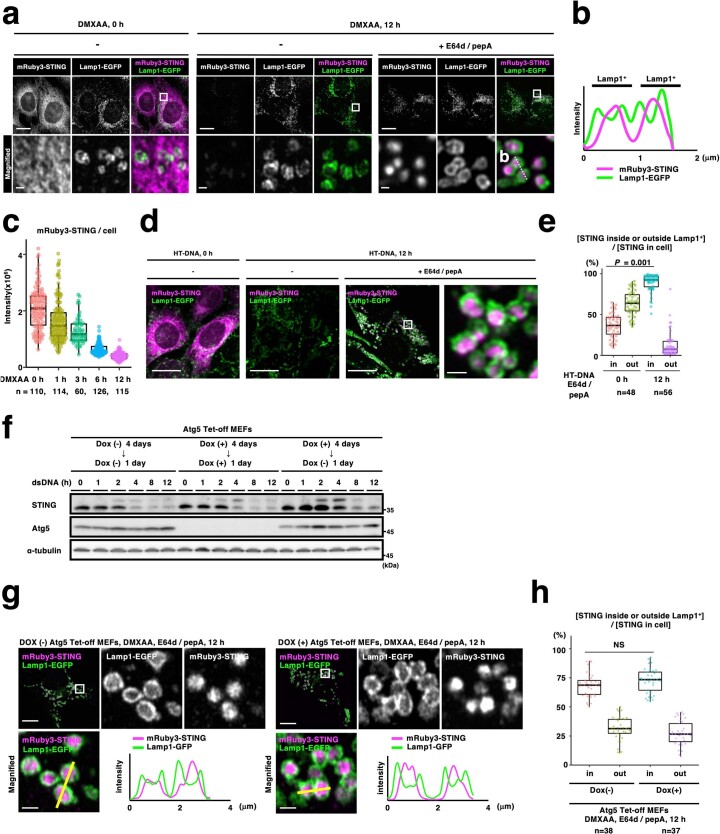
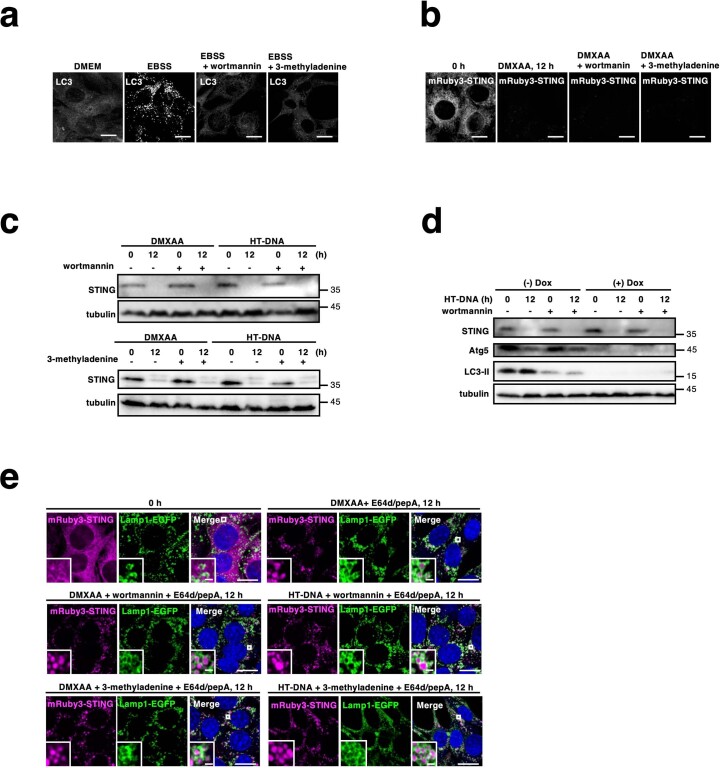
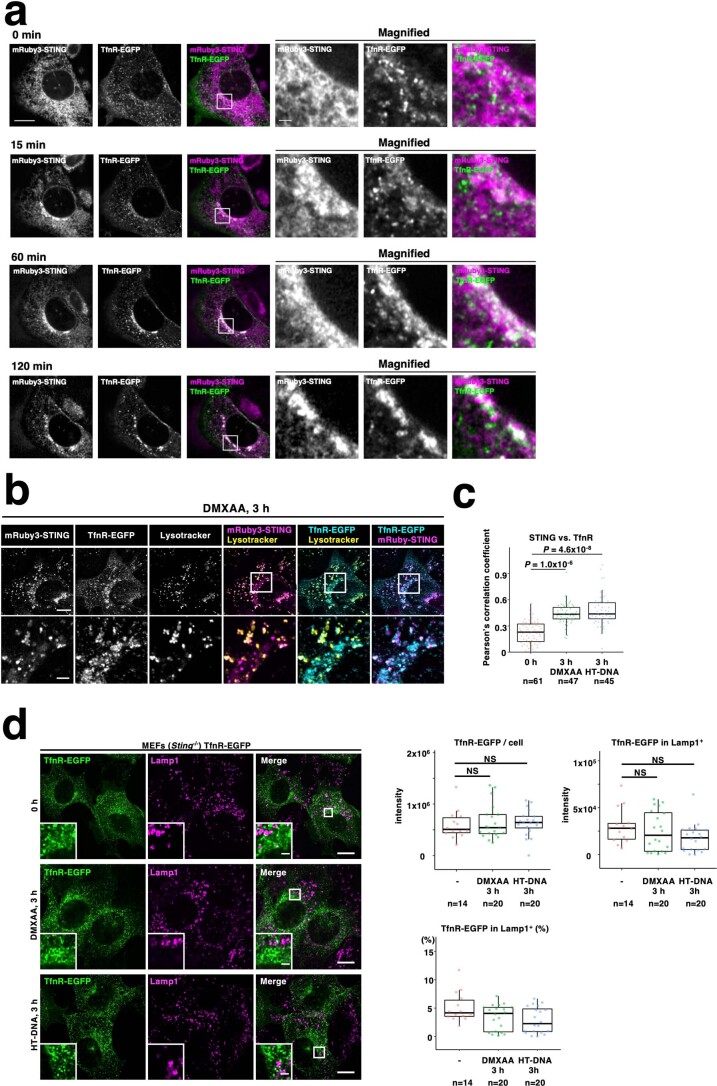
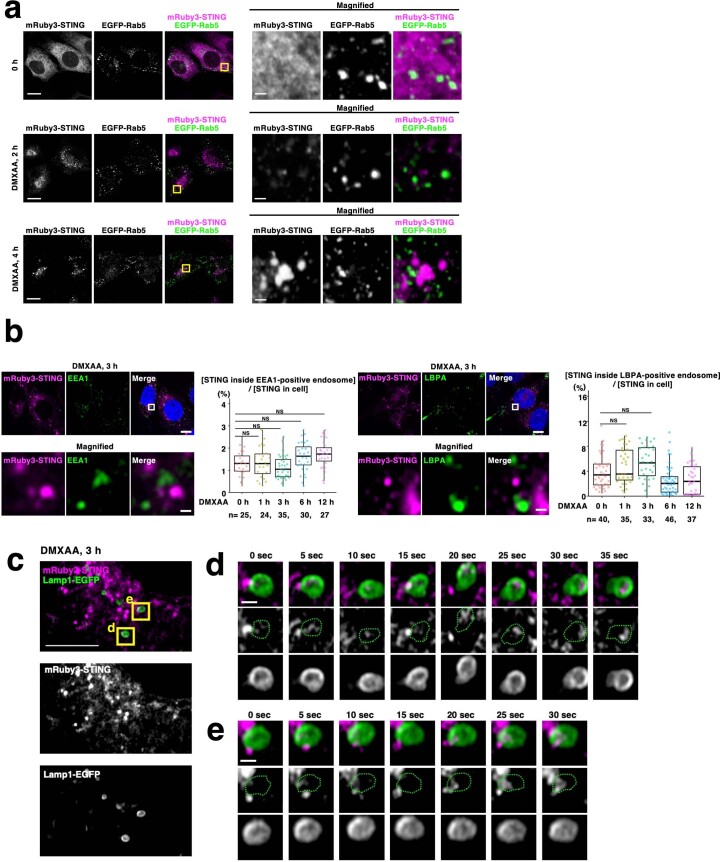
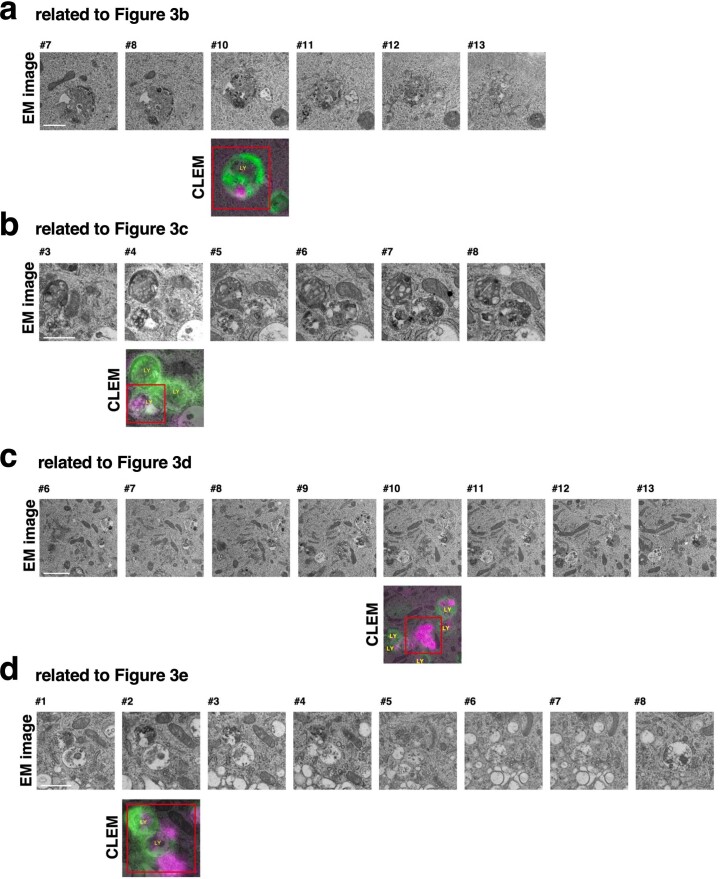
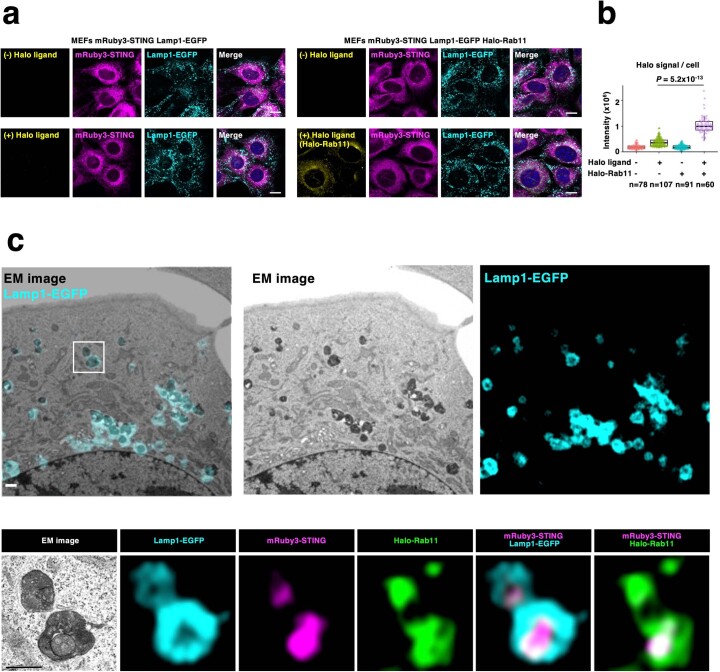
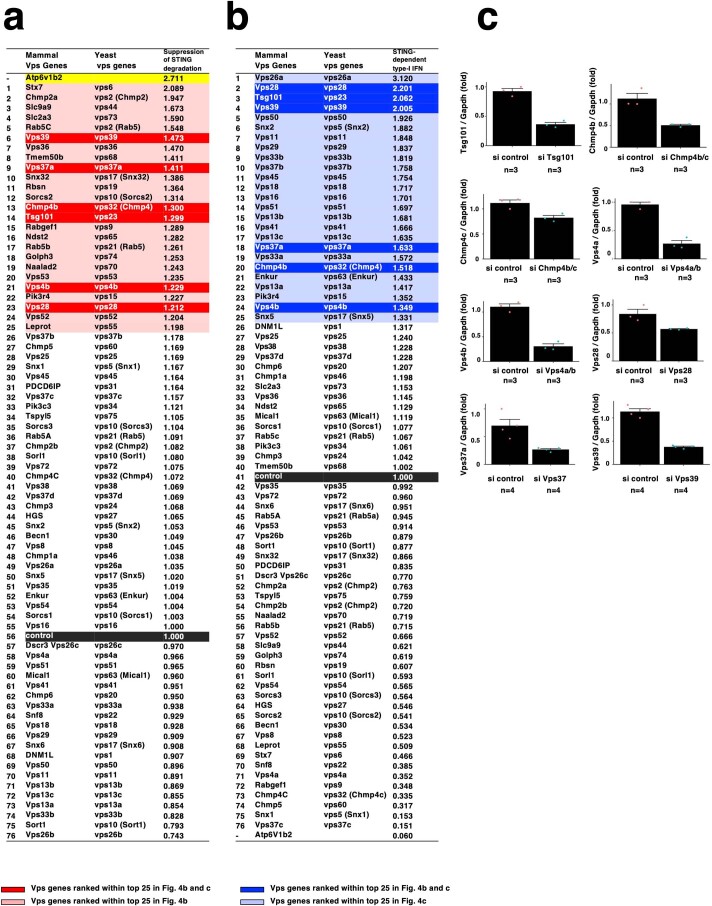
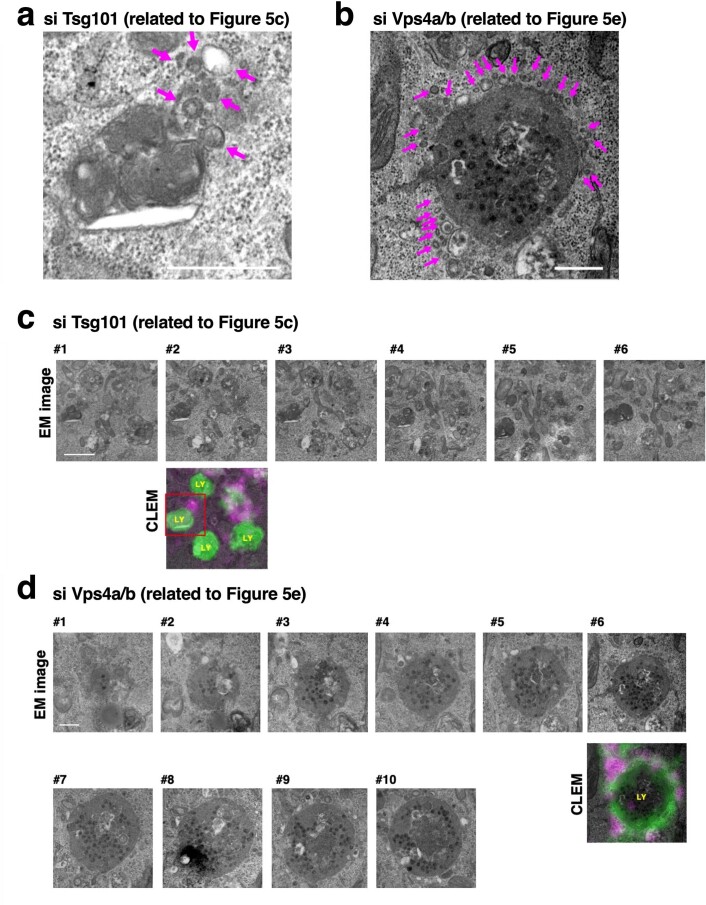
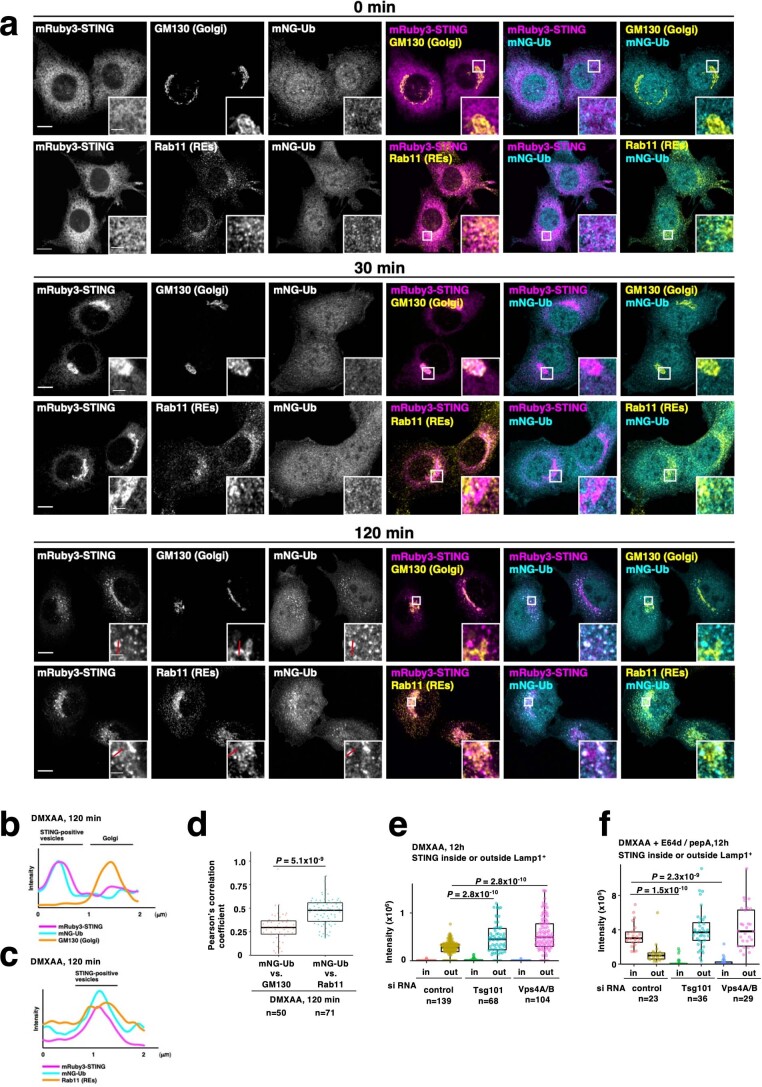
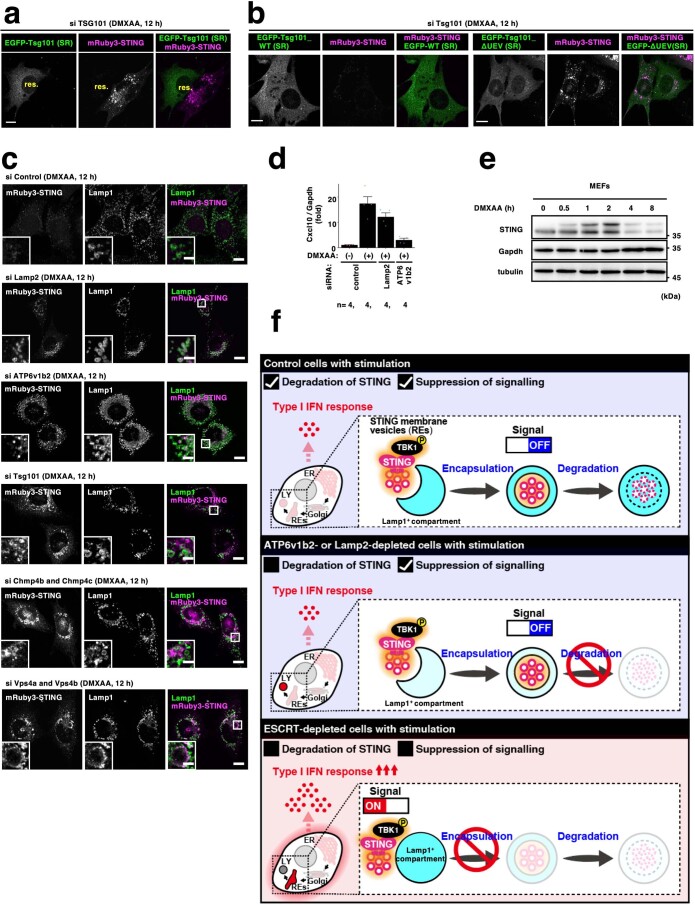
Stimulator of interferon genes (STING) is essential for the type I interferon response against a variety of DNA pathogens. Upon emergence of cytosolic DNA, STING translocates from the endoplasmic reticulum to the Golgi where STING activates the downstream kinase TBK1, then to lysosome through recycling endosomes (REs) for its degradation. Although the molecular machinery of STING activation is extensively studied and defined, the one underlying STING degradation and inactivation has not yet been fully elucidated. Here we show that STING is degraded by the endosomal sorting complexes required for transport (ESCRT)-driven microautophagy. Airyscan super-resolution microscopy and correlative light/electron microscopy suggest that STING-positive vesicles of an RE origin are directly encapsulated into Lamp1-positive compartments. Screening of mammalian Vps genes, the yeast homologues of which regulate Golgi-to-vacuole transport, shows that ESCRT proteins are essential for the STING encapsulation into Lamp1-positive compartments. Knockdown of Tsg101 and Vps4, components of ESCRT, results in the accumulation of STING vesicles in the cytosol, leading to the sustained type I interferon response. Knockdown of Tsg101 in human primary T cells leads to an increase the expression of interferon-stimulated genes. STING undergoes K63-linked ubiquitination at lysine 288 during its transit through the Golgi/REs, and this ubiquitination is required for STING degradation. Our results reveal a molecular mechanism that prevents hyperactivation of innate immune signalling, which operates at REs.


Conflict of interest statement

The authors declare no competing interests.

Figures

Fig. 1
Fig. 1. Direct encapsulation of STING into the lumen of Lamp1-positive compartments.
a, Sting−/− MEFs stably expressing mRuby3-STING and Lamp1-EGFP were treated with DMXAA. For the inhibition of lysosomal proteolysis, E64d and pepstatin A were added to the medium. Cells were fixed and imaged. b, The fluorescence intensity of mRuby3-STING in a was quantified. c, Cells were stimulated with DMXAA in the presence of E64d/pepstatin A for the indicated times. Data are presented as the ratio (%) of [mRuby3-STING in Lamp1-positive areas (Lamp1+)]/[mRuby3-STING in whole cell]. d, (1) ‘Macroautophagy’; STING vesicles are first occluded into autophagosomes, which then fuse with lysosome. (2) ‘Membrane fusion’; STING vesicles fuse with endosome or lysosome, followed by invagination of limiting membrane of endosome or lysosome, yielding intraluminal STING vesicles. (3) ‘Encapsulation by endosome or lysosome’; STING vesicles are directly encapsulated into endosome or lysosomes. eg, TfnR-EGFP and mRuby3-STING were stably expressed in Sting−/− MEFs. Cells were treated with DMXAA and then with LysoTracker Deep Red. The boxed area in the bottom panels is magnified in the top panels (e). Fluorescence intensity profile along the white line in e is shown (f). Cells were treated with DMXAA or HT-DNA and then with LysoTracker Deep Red. Data are presented as the ratio (%) of [TfnR-EGFP in LysoTracker-positive areas (LysoTracker+)]/[TfnR-EGFP in whole cell] (g). h, Sting−/− MEFs stably expressing mRuby3-STING, Lamp1-EGFP and mTagBFP2-Rab5 were treated with DMXAA. The white boxed area is magnified in the right panels. mTagBFP2-Rab5-positive area and Lamp1-EGFP-positive area are magnified at the bottom, respectively. The fluorescence intensity of mRuby3-STING within Rab5+ or Lamp1+ compartments was quantified. i, EGFP-Rab5 or Lamp1-EGFP was stably expressed in Sting−/− MEFs reconstituted with mRuby3-STING. Data are presented as the ratio (%) of [mRuby3-STING inside Rab5+ or Lamp1+]/[mRuby3-STING in whole cell]. NS, not significant. Scale bars, 5 µm (a), 10 µm (e,h) and 1 µm (magnified images in e and h). Data are presented in box-and-whisker plots with the minimum, maximum, sample median and first versus third quartiles (b,c,gi). The sample size (n) represents the number of cells (b,c,g,i) or vesicles (h). Source numerical data are available in source data. Source data
Fig. 2
Fig. 2. Evidence of ‘direct encapsulation’ of STING by live-cell imaging.
ac, Sting−/−MEFs stably expressing mRuby3-STING and Lamp1-EGFP were imaged by Airyscan super-resolution microscopy every 0.4 s from 3 h after DMXAA stimulation (related to Extended Data Fig. 4b–d): the perinuclear region of cell (a); the time-lapse images of the region outlined by the yellow box in a shown sequentially (b); the schematic corresponding to the individual time-lapse images (c). The yellow arrows indicate a cytosolic STING chunk in close proximity to the limiting membrane of Lamp1+. A cytosolic STING chunk is depicted as the cluster of vesicles (see also Fig. 3). The cyan arrows indicate STING inside Lamp1+. Scale bars, 500 nm (ac).
Fig. 3
Fig. 3. Evidence of ‘direct encapsulation’ of STING by CLEM.
ag, Sting−/− MEFs stably expressing mRuby3-STING (magenta) and Lamp1-EGFP (green) were treated with DMXAA in the presence of E64d/pepstatin A/orlistat (lipase inhibitor): Lamp1-positive endosomes/lysosomes and STING-positive vesicles (or structures) were identified by Airyscan super-resolution microscopy before processing for transmission EM to examine their ultrastructure (a); magnification of the boxed areas in a (be), with orange arrowheads in b and c indicating the membrane that surrounds STING vesicles (for EM images of serial sections, see Extended Data Fig. 5); a graphical image of lysosome containing membrane-encapsulated STING vesicles (f) (green arrowheads indicate limiting membrane of lysosome); the diameter of STING-positive membrane vesicles was measured and plotted as histograms (g). h, Sting−/− MEFs stably expressing mRuby3-STING (magenta), Lamp1-EGFP (cyan) and Halo-Rab11a (green) were treated with DMXAA for 6 h in the presence of E64d/pepstatin A/orlistat. i, The fluorescence intensity of Halo-Rab11a in lysosomes (Lamp1-positive areas) or in whole cell was quantified. Data are presented in box-and-whisker plots with the minimum, maximum, sample median and first versus third quartiles as the ratio (%) of [Halo-Rab11a in Lamp1+]/[Halo-Rab11a in whole cell]. j, Sting−/− MEFs stably expressing EGFP-STING (green) were treated with or without DMXAA. Cells were immunostained with anti-clathrin-heavy chain (CHC) antibody (magenta). k, TfnR-EGFP (green) and mRuby3-STING (magenta) were stably expressed in Sting−/− MEFs. Cells were treated with the indicated siRNAs, and then stimulated with DMXAA. Scale bars, 10 µm (a,j,k), 500 nm in (be,h) and 500 nm (magnified images in j and k). The sample size (n) represents the number of cells (i) or vesicles (g). Source numerical data are available in source data. Source data
Fig. 4
Fig. 4. Mammalian Vps genes essential for STING degradation and termination of type I interferon response.
a, Schematic overview of the screening procedures. b, Screening of mammalian Vps genes required for STING degradation. Sting−/− MEFs reconstituted with mRuby3-STING were treated with siRNA against individual Vps genes, and stimulated with DMXAA for 18 h. Cells were analysed by flow cytometry. MFI of mRuby3 in stimulated cells was divided by MFI of mRuby3 in the corresponding unstimulated cells. The calculated value from cells treated with Vps siRNA was then normalized to that of cells treated with control siRNA. The top 25 genes are highlighted in red. Bright red bars indicate the genes that were also ranked within top 25 in c. c, Screening for mammalian Vps genes required for suppression of STING-dependent type I interferon response. MEFs were treated with siRNA against individual Vps genes, and stimulated with DMXAA for 10 h. Cell supernatants were analysed for type I interferon (IFN). IFN activity from cells treated with Vps siRNA was normalized to that of cells treated with control siRNA. The top 25 genes are highlighted in blue. Bright blue bars indicate the genes that were also ranked within top 25 in b. d, Vps genes ranked within top 25 both in b and c are shown. e, The expression of Cxcl10 in MEFs that were treated with siRNA against the indicated Vps genes, and then stimulated with DMXAA for 12 h. Data are presented as mean ± standard deviation (s.d.). Statistical significances between control siRNA/DMXAA (+) and the indicated siRNAs/DMXAA (+) were determined by performing Student’s unpaired t-test with Bonferroni multiple correction. f, FLAG-STING-reconstituted Sting−/− MEFs were stimulated with DMXAA for 3 h, and lysed. FLAG-STING in the lysates was immunoprecipitated. Co-immunoprecipitated proteins were identified by MS. The ratio of abundance of identified proteins before and after stimulation was then calculated individually. The listed are lysosomal proteins that showed increased abundance after stimulation. Gene Ontology analysis in Uniprot was performed to identify lysosomal proteins. N/A indicates a protein that was not detected without stimulation. The sample size (n) represents the number of the biological replicates (e). Source numerical data are available in source data. Source data
Fig. 5
Fig. 5. ESCRT proteins are required for encapsulation of STING into the lumen of Lamp1-positive compartments.
a, TfnR-EGFP (cyan) and mRuby3-STING (magenta) were stably expressed in Sting−/− MEFs. Cells were treated with the indicated siRNAs, and then stimulated with DMXAA. Cells were immunostained with anti-pTBK1 (yellow) antibody. b, The Pearson’s correlation coefficient between mRuby3-STING and pTBK1, or between mRuby3-STING and TfnR-EGFP in a is shown. Data are presented in box-and-whisker plots with the minimum, maximum, sample median and first versus third quartiles. cf, CLEM analysis of STING-positive vesicles. Sting−/− MEFs stably expressing mRuby3-STING (magenta) and Lamp1-EGFP (green) were treated with siRNA against Tsg101 (c,d) or Vps4a/b (e,f), and then stimulated with DMXAA. Lamp1-positive lysosomes and STING-positive membranes were identified by Airyscan super-resolution microscopy before processing for transmission EM to examine their ultrastructure (c,e). The yellow boxed areas in c and e are magnified in the right panels, respectively. The red boxed areas in EM images are magnified in the bottom right panels, respectively. STING-positive vesicles in c and e are indicated by magenta arrows. The diameters of STING-positive vesicles in Tsg101- or Vps4a/b-depleted cells were measured and plotted as histogram (d and f). Scale bars, 10 µm (a), 500 nm (magnified images in a), 1 µm (left CLEM images in c and e), 500 nm (fluorescence images in c and e), 100 nm (magnified EM images in c and e). The sample size (n) represents the number of cells (b) or vesicles (d,f). Source numerical data are available in source data. Source data
Fig. 6
Fig. 6. The physiological roles of Tsg101 in STING degradation and termination of type I interferon response.
a, MRC-5 cells were treated with siRNAs, and then stimulated with HT-DNA for the indicated times. Cell lysates were analysed by western blot. b, MRC-5 cells were treated with the indicated siRNAs, and then stimulated with HT-DNA. Cells were immunostained with anti-STING (magenta) and anti-pSTING (green) antibodies. c, The fluorescence intensity of STING or pSTING in b was quantified. d, Schematic representation of the experiments with human primary T cells. e, Knockdown efficiency of TSG101 gene in human primary T cells from a representative donor. Data are presented as mean ± s.d. f, The expression of IFIT1 or IFI27 was quantitated with qRT–PCR. Data are presented as mean ± s.d. g, Primary MEFs were treated with siRNAs, and then infected with HSV-1 (MOI 10) for the indicated times. Cell lysates were analysed by western blot. h, Primary MEFs were treated with the indicated siRNAs, and then stimulated with HSV-1 infection (MOI 10) for 8 h. Cells were immunostained with anti-STING (magenta), anti-Lamp1 (green) and anti-ICP4 antibodies. i, The fluorescence intensity of STING in h was quantified. Scale bars, 10 µm (b,h) and 500 nm (magnified images in h). Data are presented in box-and-whisker plots with the minimum, maximum, sample median and first versus third quartiles (c,i). The sample size (n) represents the number of cells (c,i) or the biological replicates (e,f). Source numerical data and unprocessed blots are available in source data. Source data
Fig. 7
Fig. 7. Ubiquitination on K288 of STING is required for STING degradation and termination of type I interferon response.
a, Sting−/− MEFs reconstituted with EGFP-STING were stimulated with DMXAA for the indicated times. EGFP-STING was immunoprecipitated with anti-GFP antibody. The cell lysates and the immunoprecipitated proteins were analysed by western blot. IP, immunoprecipitation. b, Sting−/− MEFs stably expressing mRuby3-STING and mNeonGreen (mNG)-ubiquitin were imaged every 5 min after DMXAA stimulation. c, Quantitation of the number of mNG-ubiquitin puncta (see also Supplementary Video 3). d, Sting−/− MEFs reconstituted with EGFP-STING (WT, K19R, K150/151R, K235R, K288R or K337R) were stimulated with DMXAA. EGFP-STING was immunoprecipitated with anti-GFP antibody. The cell lysates and the immunoprecipitated proteins were analysed by western blot. e, The fluorescence intensity of EGFP-STING (WT or K288R) under the indicated conditions was quantified. NS, not significant. f, Sting−/− MEFs reconstituted with EGFP-STING (WT or K288R) were stimulated with DMXAA. Cells were immunostained with anti-GM130 or anti-Rab11 antibodies. The Pearson’s correlation coefficient between EGFP-STING (WT or K288R) and GM130, or between EGFP-STING (WT or K288R) and Rab11, is shown. g, Cells were stimulated with DMXAA. Cell lysates were analysed by western blot. The band intensities were quantified. [STING/tubulin], [pTBK1/TBK1] and [pIRF3/IRF3] were calculated. h, Cells were stimulated with DMXAA or HT-DNA for 12 h. The expression of Cxcl10 was quantitated with qRT–PCR. Data are presented as mean ± s.d. i, Sting−/− MEFs reconstituted with EGFP-STING (WT or K288R) were stimulated with DMXAA. Cells were immunostained with anti-K63 ubiquitin antibody. j, The Pearson’s correlation coefficient between EGFP-STING (WT or K288R) and K63 ubiquitin is shown. k, Cells were stimulated with DMXAA. Cell lysates were prepared, and EGFP-STING was immunoprecipitated with anti-GFP antibody. The cell lysates and the immunoprecipitated proteins were analysed by western blot. Scale bars, 10 µm (b,f,i) and 500 nm (magnified images in b and i). Data are presented in box-and-whisker plots with the minimum, maximum, sample median and first versus third quartiles (e,f,j). The sample size (n) represents the number of cells (e,f,j) or the biological replicates (h). Source numerical data and unprocessed blots are available in source data. Source data
Fig. 8
Fig. 8. Ubiquitin-binding domain of Tsg101 is required for STING degradation and termination of type I interferon response.
a, Sting−/− MEFs reconstituted with EGFP-STING were treated with control siRNA or Tsg101 siRNA. Cells were then incubated with DMXAA. EGFP-STING was immunoprecipitated with anti-GFP antibody. The cell lysates and the immunoprecipitated proteins were analysed by western blot. b, Sting−/− MEFs reconstituted with mRuby3-STING were treated with control siRNA or Tsg101 siRNA, and then stimulated with DMXAA. Cells were immunostained with anti-K63 ubiquitin antibody (cyan) and anti-Lamp1 (yellow). The boxed areas are magnified in the bottom row. c, Sting−/− MEFs reconstituted with mRuby3-STING were treated with indicated siRNAs, and then stimulated with DMXAA. The fluorescence intensity of mRuby3-STING under the indicated conditions was quantified. d, The fluorescence intensity of mRuby3-STING that was not associated with Lamp1+ in b was quantified. e, The Pearson’s correlation coefficient between mRuby3-STING and K63 ubiquitin in b is shown. f, EGFP-Tsg101 (WT or ΔUEV) and mRuby3-STING were stably expressed in Sting−/− MEFs. Cells were treated with DMXAA. The boxed areas are magnified in the bottom row. g, The Pearson’s correlation coefficient between mRuby3-STING and EGFP-Tsg101 (WT or ΔUEV) in f is shown. NS, not significant. h, LgBiT-Tsg101 (WT or ΔUEV) and SmBiT-STING were stably expressed in Sting−/− MEFs. Cells were treated with DMXAA for 4 h. Data are presented as mean ± s.d. NS, not significant. i, The expression of Cxcl10 was quantitated with qRT–PCR. Data are presented as mean ± s.d. j, A graphical abstract illustrating ESCRT-driven microautophagy. Scale bars, 10 µm (b,f) and 500 nm (magnified images in b and f). Data are presented in box-and-whisker plots with the minimum, maximum, sample median and first versus third quartiles (ce,g). The sample size (n) represents the number of cells for (ce,g) or the biological replicates (h,i). Source numerical data and unprocessed blots are available in source data. Source data
Extended Data Fig. 1
Extended Data Fig. 1. Atg5-dependent macroautophagy was not involved in STING degradation.
a, Sting−/− MEFs stably expressing mRuby3-STING and Lamp1-EGFP were treated with DMXAA for 12 h. For the inhibition of lysosomal proteolysis, E64d and pepstatin A were added to the medium. The boxed areas in the top panels are magnified in the bottom panels. b, Fluorescence intensity profile along the white dotted line in (a) is shown. c, Cells were stimulated with DMXAA for the indicated times. The fluorescence intensity of mRuby3-STING in cells was quantified. d, Sting−/− MEFs stably expressing mRuby3-STING and Lamp1-EGFP were treated with HT-DNA for 12 h. The cells were then treated with DMXAA and protease inhibitors for 12 h. The boxed area is magnified in the right panel. e, The ratio (%) of [mRuby3-STING inside or outside Lamp1+]/[mRuby3-STING in whole cell] is indicated. f, Atg5 Tet-off cells were cultured with or without Doxycycline (Dox). Cells were stimulated with dsDNA for the indicated times. Cell lysates were analyzed by western blotting. g, mRuby3-STING and Lamp1-EGFP were stably expressed in Atg5 Tet-off cells. Cells were cultured with or without Dox for 4 days. The cells were then treated with DMXAA and protease inhibitors for 12 h. The boxed areas are magnified and shown. Fluorescence intensity profiles along the yellow lines are shown. h, The ratio (%) of [mRuby3-STING inside or outside Lamp1+]/[mRuby3-STING in whole cell] in (g) is indicated. Data are presented in box-and-whisker plots with the minimum, maximum, sample median, and first vs. third quartiles (c, e, and h). Scale bars, 10 µm in (a, d, and g), 500 nm in the magnified images in (a, d, and g). NS, not significant. The sample size (n) represents the number of cells (c, e, and h). Source numerical data and unprocessed blots are available in source data. Source data
Extended Data Fig. 2
Extended Data Fig. 2. PI3K inhibitors did not inhibit STING degradation.
a, MEFs were incubated with DMEM or EBSS for 2 h. For the inhibition of PI3K (phosphatidylinositol-3 kinase), wortmannin (1 µM) or 3-methyladenine (1 µM) was added to the medium. Cells were fixed, permeabilized, and immunostained with anti-LC3 antibody. b, Sting−/− MEFs stably expressing mRuby3-STING were treated with DMXAA (25 µg ml−1) for 0 or 12 h in the presence of wortmannin (1 µM) or 3-methyladenine (1 µM). Cells were fixed and imaged. c, MEFs were treated with DMXAA (25 µg ml−1) or HT-DNA (4 µg ml−1) for 12 h in the presence of wortmannin (1 µM) or 3-methyladenine (1 µ M). Cell lysates were then prepared and analyzed by western blotting. d, Atg5 Tet-off cells were cultured with or without Doxycycline (Dox) (10 ng ml−1). Cells were stimulated with HT-DNA (4 µg ml−1) for the indicated times in the presence of wortmannin (1 µM). Cell lysates were then prepared and analyzed by western blotting. e, Sting−/− MEFs stably expressing mRuby3-STING (magenta) and Lamp1-EGFP (green) were treated with DMXAA (25 µg ml−1) or HT-DNA (4 µg ml−1) for 0 or 12 h. For the inhibition of lysosomal proteolysis, E64d (30 µg ml−1) and pepstatin A (40 µg ml−1) were added to the medium. For the inhibition of PI3K, wortmannin (1 µM) or 3-methyladenine (1 µM) was added to the medium. Cells were fixed and imaged by Airyscan super-resolution microscopy. Scale bars, 10 µm in (a, b, and e), 500 nm in the magnified images in (e). Unprocessed blots are available in source data. Source data
Extended Data Fig. 3
Extended Data Fig. 3. STING co-localized with TfnR-EGFP after stimulation.
a, Sting−/− MEFs stably expressing mRuby3-STING and TfnR-EGFP were imaged by Airyscan super-resolution microscopy every 1 min after stimulation with DMXAA. Selected images from the movie are shown. See also Supplementary video 1. The boxed areas in the merged images are magnified and shown. b, TfnR-EGFP (cyan) and mRuby3-STING (magenta) were stably expressed in Sting−/− MEFs. Cells were treated with DMXAA for 3 h and then with LysoTracker Deep Red (yellow). Live cell imaging was performed with Airyscan super-resolution microscopy. The boxed areas in the top panels are magnified in the bottom panels. c, The Pearson’s correlation coefficient between mRuby3-STING and TfnR-EGFP is presented in box-and-whisker plots with the minimum, maximum, sample median, and first vs. third quartiles. d, Sting−/− MEFs stably expressing TfnR-EGFP were treated with DMXAA (25 µg ml−1) or HT-DNA (4 µg ml−1) for 3 h. Cells were fixed, permeabilized, and immunostained with anti-Lamp1 antibody. The fluorescence intensity of TfnR-EGFP in Lamp1-positive compartments (Lamp1+) or in whole cell was quantified. Data are presented in box-and-whisker plots with the minimum, maximum, sample median, and first vs. third quartiles. Scale bars, 10 μm in (a, b, and d), 1 µm in the magnified images in (a, b, and d). The sample size (n) represents the number of cells (c and d). Source numerical data are available in source data. Source data
Extended Data Fig. 4
Extended Data Fig. 4. STING was directly encapsulated by Lamp1+ compartments.
a, EGFP-Rab5a (green) and mRuby3-STING (magenta) were stably expressed Sting−/− MEFs. Cells were treated with DMXAA for the indicated times. Cells were fixed and imaged by Airyscan super-resolution microscopy. The yellow boxed areas are magnified and shown in the right panels. b, Sting−/− MEFs stably expressing mRuby3-STING were treated with DMXAA (25 µg ml−1) as indicated. Cells were then fixed, permeabilized, and immunostained with anti-EEA1 or anti-LBPA antibody. Data are presented in box-and-whisker plots with the minimum, maximum, sample median, and first vs. third quartiles as the ratio (%) of [mRuby3-STING inside endosome]/[mRuby3-STING in whole cell]. The white boxes are magnified and shown in the bottom panels. c-e, Cells were imaged by Airyscan super-resolution microscopy every 5 seconds from 3 hours after DMXAA stimulation. The time-lapse images of the regions outlined by the yellow boxes in (c) are shown sequentially in (d) and (e). The dotted green lines indicate the limiting membrane of lysosome. Scale bars 10 μm in (a, b, and c), 500 nm in (d and e), 500 nm in the magnified images in (a and b). The sample size (n) represents the number of cells (b). Source numerical data are available in source data. Source data
Extended Data Fig. 5
Extended Data Fig. 5. CLEM analysis of cluster of STING vesicles.
Serial EM pictures and a selected CLEM image are shown. Panels a, b, c, and d correspond to Fig. 3b–e, respectively. The number (#) indicates the order in the serial section. LY, Lysosomes; Scale bars, 500 nm.
Extended Data Fig. 6
Extended Data Fig. 6. STING co-localized with Rab11 within lysosomes.
a, Sting−/− MEFs stably expressing mRuby3-STING (magenta), Lamp1-EGFP (cyan) were treated with or without HaloTag SaraFluor 650 T ligand (yellow) (the left 4 panels). Sting−/− MEFs stably expressing mRuby3-STING (magenta), Lamp1-EGFP (cyan), and Halo-Rab11a (yellow) were treated with or without HaloTag SaraFluor 650 T ligand (the right 4 panels). Scale bars, 10 µm. b, The far-red fluorescence intensity of the cells was quantified. Data are presented in box-and-whisker plots with the minimum, maximum, sample median, and first vs. third quartiles. c, Sting−/− MEFs stably expressing mRuby3-STING (magenta), Lamp1-EGFP (cyan), and Halo-Rab11a (green) were treated with DMXAA for 6 h in the presence of E64d/pepstatin A/orlistat. Scale bars, 500 nm. The sample size (n) represents the number of cells (b). Source numerical data are available in source data. Source data
Extended Data Fig. 7
Extended Data Fig. 7. Vps genes involved in STING degradation and the termination of type I interferon response.
a, The data related to Fig. 4b are shown. The top 25 genes are highlighted in red. The genes that were also ranked within top 25 in ‘type I interferon assay’ are highlighted in bright red. b, The data related to Fig. 4c are shown. The top 25 genes are highlighted in blue. The genes that were also ranked within top 25 in ‘STING degradation assay’ are highlighted in bright blue. c, Knockdown efficiency of Vps genes. Cells were treated with the indicated siRNAs for 72 hours, and qRT-PCR was performed. Gapdh was used as an internal control. Data are presented as mean values +/− SEM. The sample size (n) represents the number of the biological replicates (c). Source numerical data are available in source data. Source data
Extended Data Fig. 8
Extended Data Fig. 8. CLEM analyses of Tsg101- or Vps4a/b-depleted cells.
a, The magnified EM picture of Fig. 5c. b, The magnified EM picture of Fig. 5e. c and d, Serial EM pictures and a selected CLEM image are shown. Panels (c) and (d) correspond to Fig. 5c, e, respectively. The number (#) indicates the order in the serial section. LY, Lysosomes; Scale bars, 500 nm.
Extended Data Fig. 9
Extended Data Fig. 9. STING co-localized with mNeonGreen-ubiquitin at Rab11-positive REs after stimulation.
a, mNeonGreen-ubiquitin (mNG-Ub, cyan) and mRuby3-STING (magenta) were stably expressed in Sting−/− MEFs. Cells were stimulated with DMXAA for the indicated times. Cells were then fixed, permeabilized, and immunostained with anti-GM130 (a Golgi protein, yellow) or anti-Rab11 (a recycling endosomal protein, yellow) antibodies. Scale bars, 10 μm, 1 µm in the magnified images. b, c, Fluorescence intensity profiles along the red lines in (a) are shown. d, The Pearson’s correlation coefficient between mNeonGreen-ubiquitin and GM130, or between mNeonGreen-ubiquitin and Rab11 are presented in box-and-whisker plots with the minimum, maximum, sample median, and first vs. third quartiles. e, Sting−/− MEFs reconstituted with mRuby3-STING were treated with indicated siRNAs. Cells were then incubated with DMXAA for 12 h. The fluorescence intensity of mRuby3-STING inside or outside Lamp1-positive compartments (Lamp1+) was quantified. Data are presented in box-and-whisker plots with the minimum, maximum, sample median, and first vs. third quartiles. f, Sting−/− MEFs stably expressing mRuby3-STING and Lamp1-EGFP were treated with indicated siRNAs. Cells were then incubated with DMXAA and E64d/pepstatin A for 12 h. The fluorescence intensity of mRuby3-STING inside or outside Lamp1-positive compartments (Lamp1+) was quantified. Data are presented in box-and-whisker plots with the minimum, maximum, sample median, and first vs. third quartiles. The sample size (n) represents the number of cells (d, e, and f). Source numerical data are available in source data. Source data
Extended Data Fig. 10
Extended Data Fig. 10. ESCRT-driven microautophagy terminates STING signaling.
a, Two cell lines [Sting−/− MEFs expressing mRuby3-STING, and Sting−/− MEFs expressing mRuby3-STING and siRNA resistant EGFP-Tsg101 (WT)] were mixed, treated with Tsg101 siRNA, and stimulated with DMXAA for 12 h. b, siRNA-resistant EGFP-Tsg101 (WT or ΔUEV) and mRuby3-STING were stably expressed in Sting−/− MEFs. Cells were treated with Tsg101 siRNA, and stimulated with DMXAA for 12 h. c, Sting−/− MEFs expressing mRuby3-STING were treated with the indicated siRNAs and stimulated with DMXAA for 12 h. Cells were then fixed, permeabilized, and immunostained with anti-Lamp1. Scale bars, 10 µm, 500 nm in the magnified images. d, qRT-PCR of the expression of Cxcl10 in MEFs that were treated with the indicated siRNAs followed by stimulation with DMXAA for 12 h. Data are presented as mean values +/− SD. e, Western blots of cell lysates of MEFs stimulated with DMXAA for the indicated times. The sample size (n) represents the number of the biological replicates (d). Source numerical data and unprocessed blots are available in source data. f, (Control cells) Active STING/TBK1 complex is encapsulated into the lumen of Lamp1-positive compartments by microautophgy. Thus the signalling is terminated. (ATP6v1b2- or Lamp2-depleted cells) The encapsulation of active STING/TBK1 complex proceeds (Extended Data Fig. 10c). Thus the signalling is terminated (Extended Data Fig. 10d). Please be noted that STING degradation is impaired because of the defect in the ability of lysosomal proteolysis. (ESCRT-depleted cells) The encapsulation is impaired, thus active STING/TBK1 complex remains in the cytosol, leading to the duration of the signalling. Recent studies indicate the involvement of C9orf72 (PMID: 32814898), BLOC1(PMID: 29033128), NPC1(PMID: 34290407) in the STING degradation. The exact site of action of these proteins in the membrane traffic that STING follows, namely, ‘ER-the Golgi-REs-lysosomes’ remains to be elucidated. Source data

Comment in

References

    1. Barber GN. STING: infection, inflammation and cancer. Nat. Rev. Immunol. 2015;15:760–770. doi: 10.1038/nri3921. - DOI - PMC - PubMed
    1. Wu J, et al. Cyclic GMP–AMP is an endogenous second messenger in innate immune signaling by cytosolic DNA. Science. 2013;339:826–830. doi: 10.1126/science.1229963. - DOI - PMC - PubMed
    1. Sun L, Wu J, Du F, Chen X, Chen ZJ. Cyclic GMP–AMP synthase is a cytosolic DNA sensor that activates the type I interferon pathway. Science. 2013;339:786–791. doi: 10.1126/science.1232458. - DOI - PMC - PubMed
    1. Kemmoku H, Kuchitsu Y, Mukai K, Taguchi T. Specific association of TBK1 with the trans-Golgi network following STING stimulation. Cell Struct. Funct. 2022;47:19–30. doi: 10.1247/csf.21080. - DOI - PMC - PubMed
    1. Ishikawa H, Barber GN. STING is an endoplasmic reticulum adaptor that facilitates innate immune signalling. Nature. 2008;455:674–678. doi: 10.1038/nature07317. - DOI - PMC - PubMed

Publication types

MeSH terms

Substances