. 2023 Mar;25(3):381-389.
doi: 10.1038/s41556-023-01095-y. Epub 2023 Mar 13.

A multi-organoid platform identifies CIART as a key factor for SARS-CoV-2 infection

Affiliations

A multi-organoid platform identifies CIART as a key factor for SARS-CoV-2 infection

Xuming Tang et al. Nat Cell Biol. 2023 Mar.

Abstract

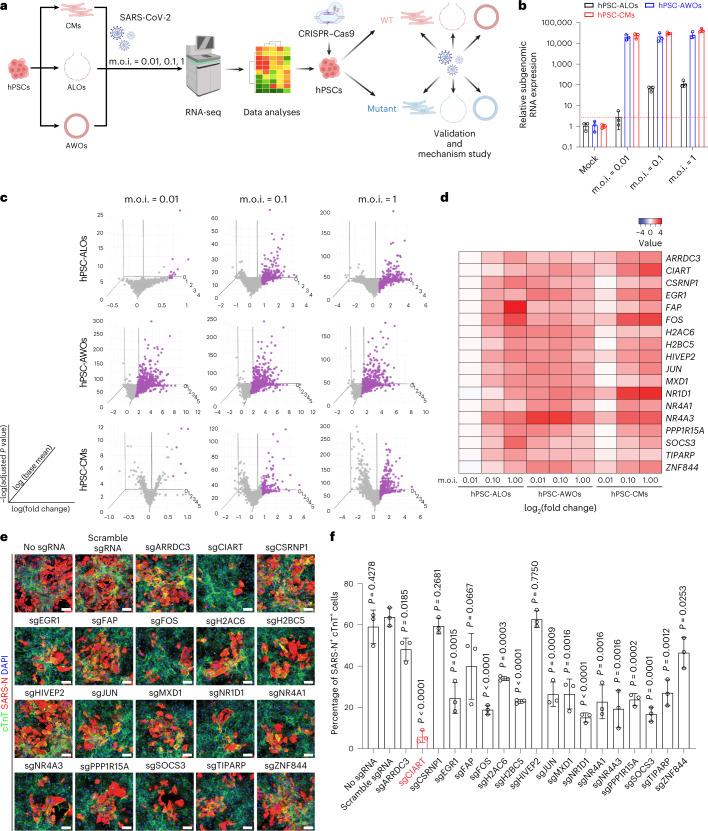
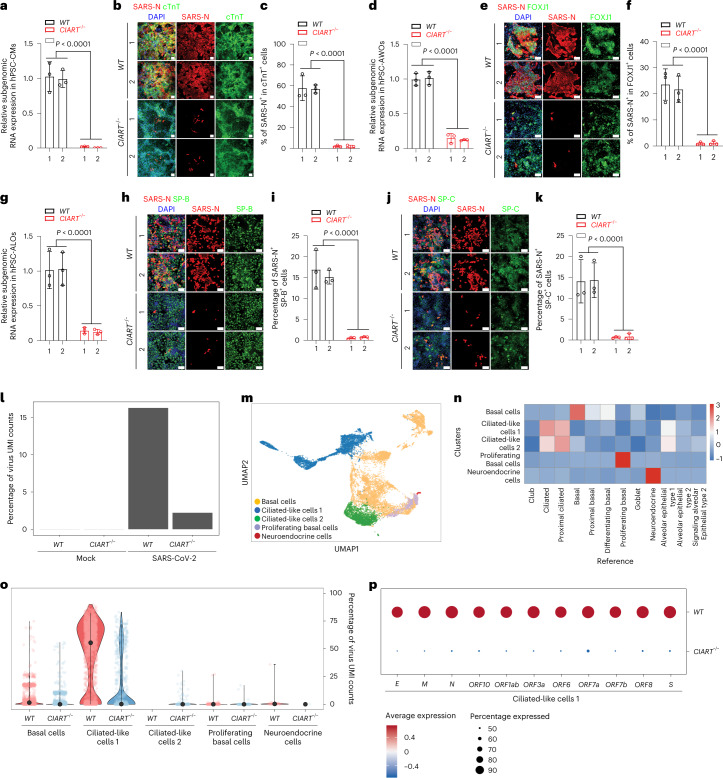
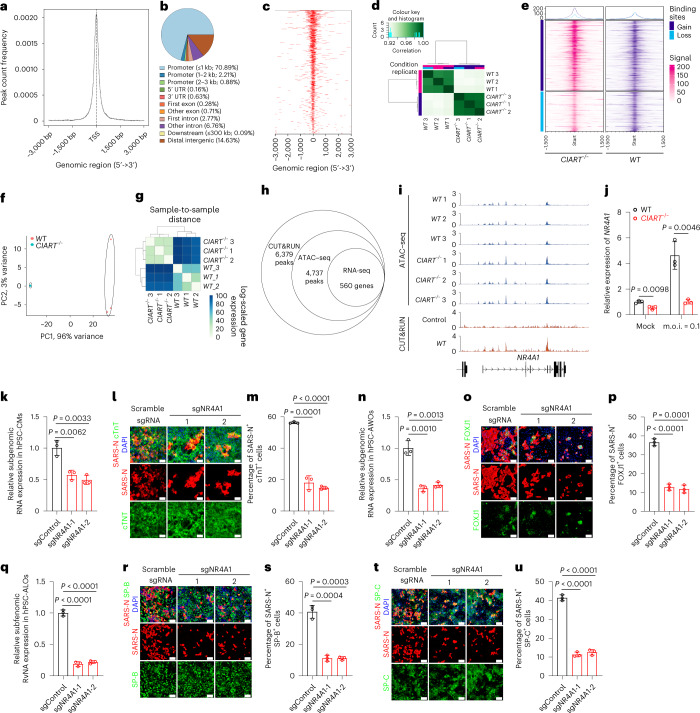
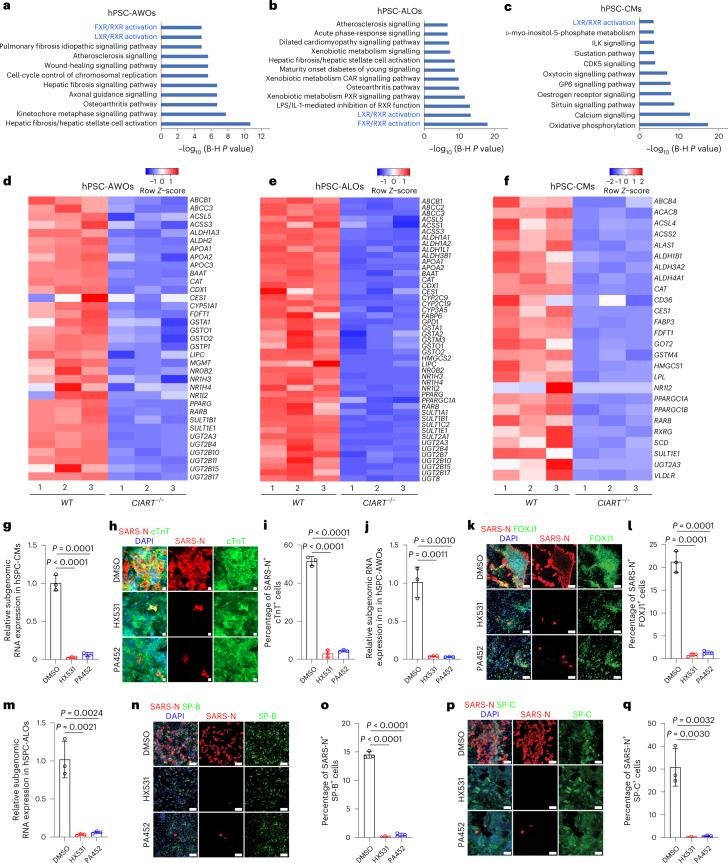
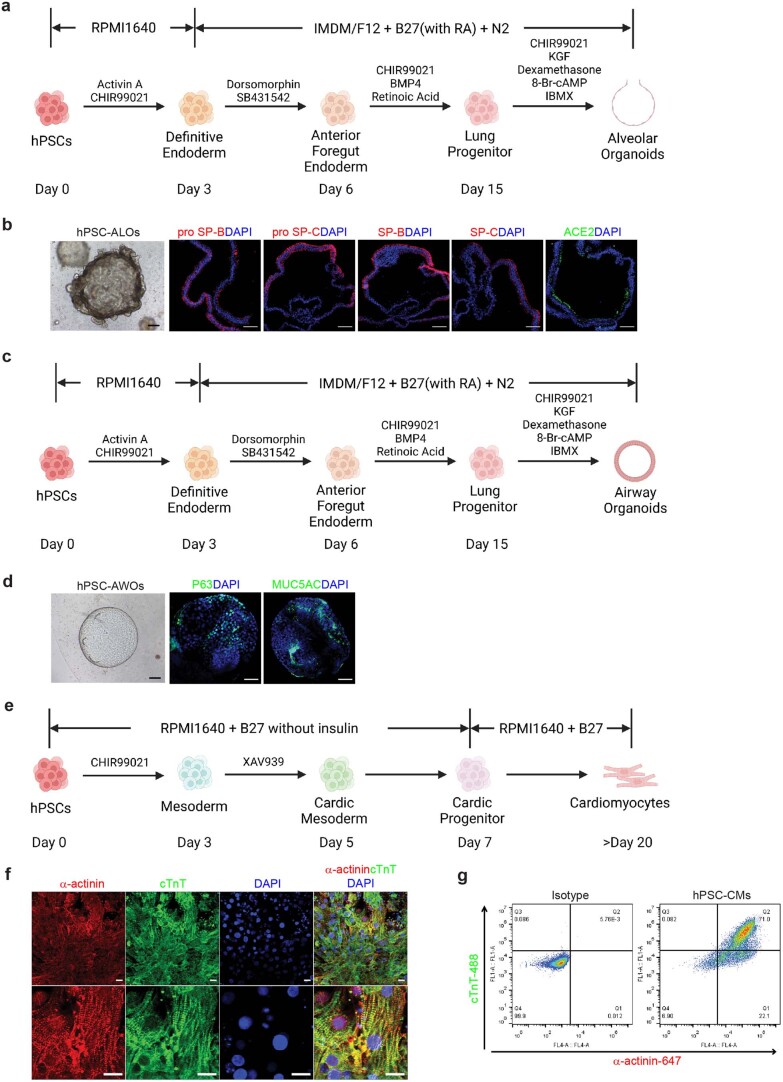
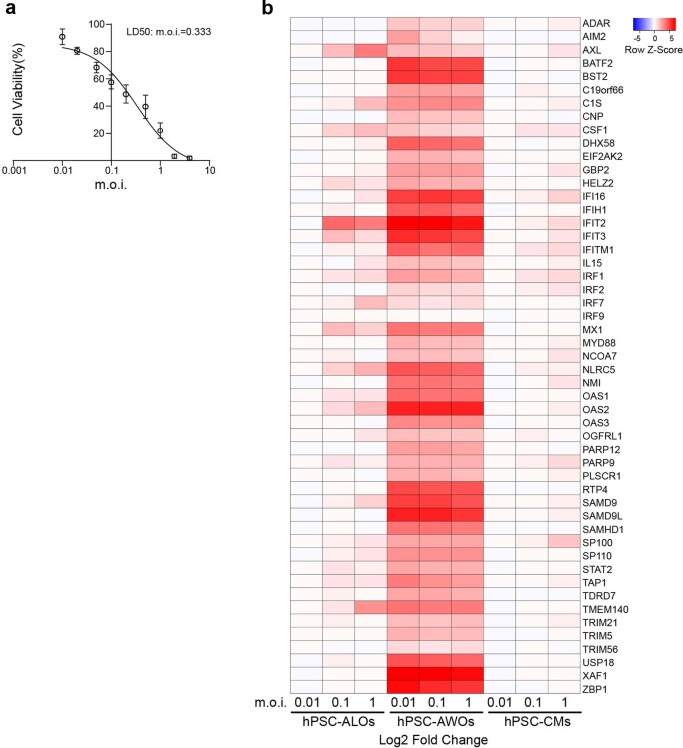
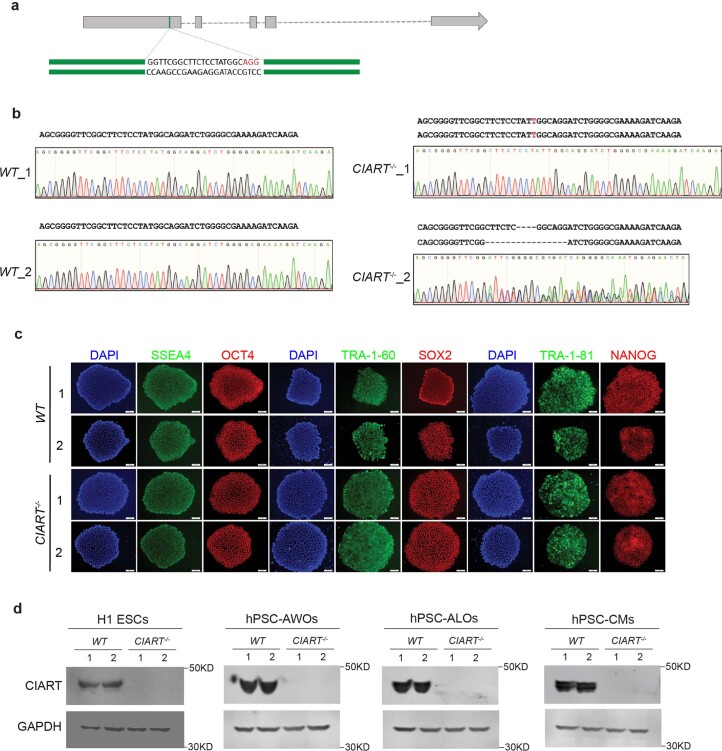
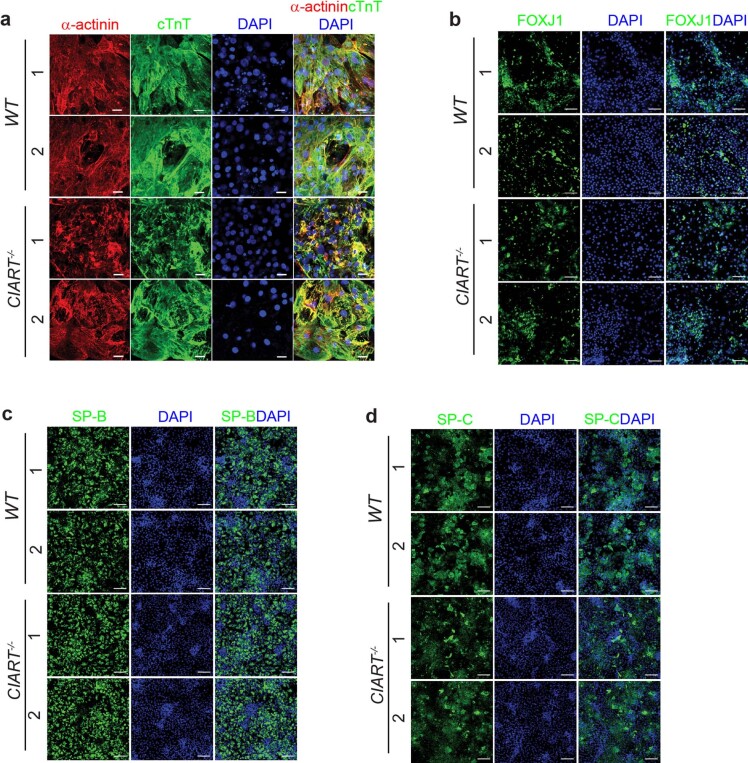
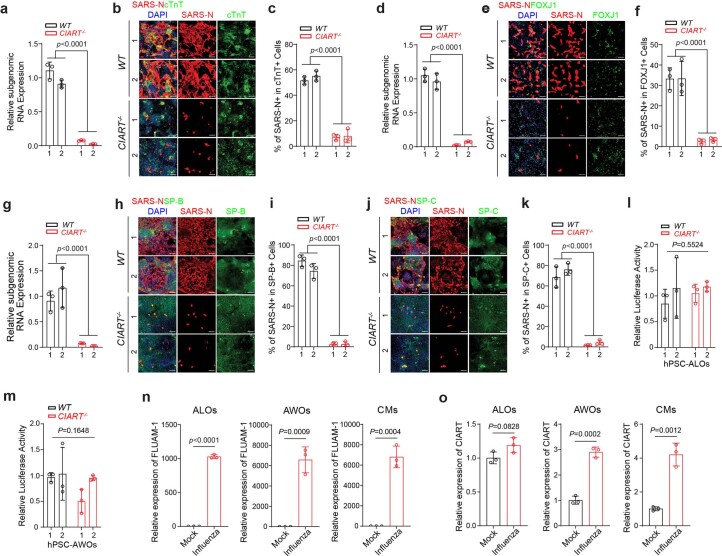
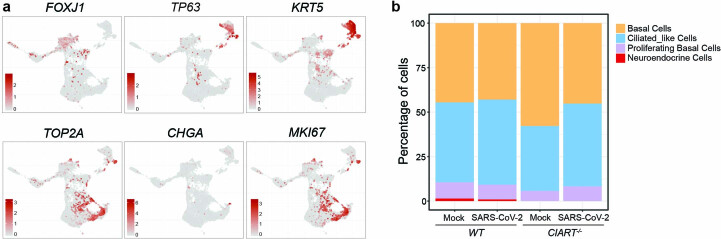
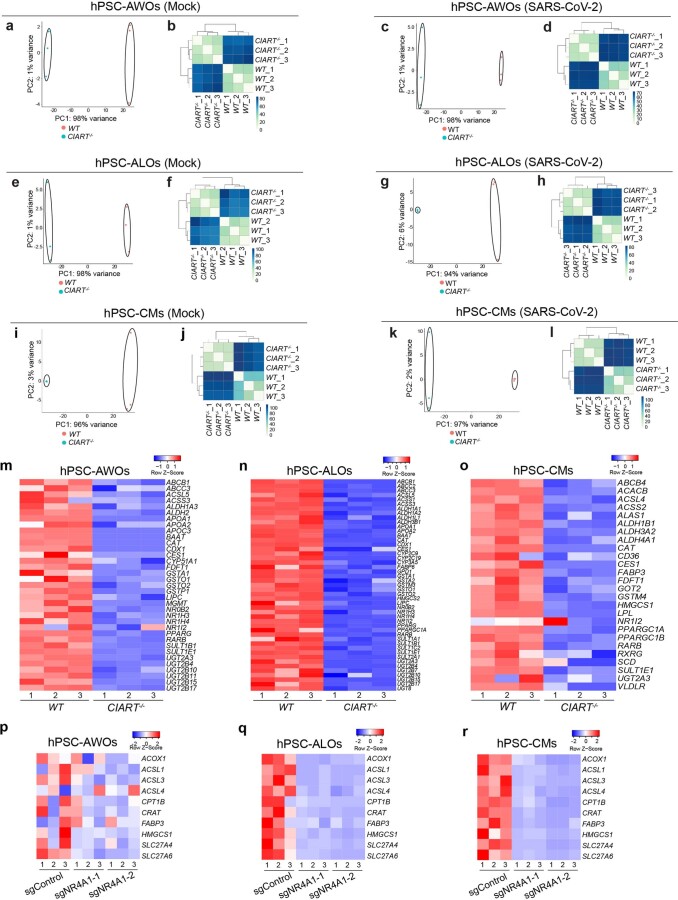
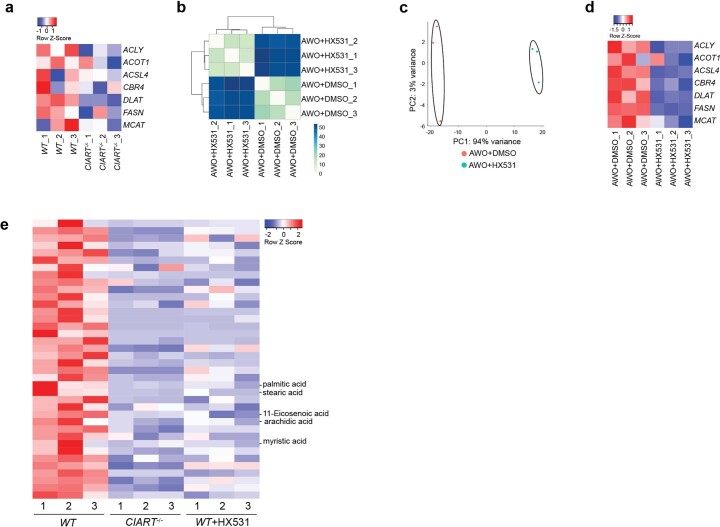
COVID-19 is a systemic disease involving multiple organs. We previously established a platform to derive organoids and cells from human pluripotent stem cells to model SARS-CoV-2 infection and perform drug screens1,2. This provided insight into cellular tropism and the host response, yet the molecular mechanisms regulating SARS-CoV-2 infection remain poorly defined. Here we systematically examined changes in transcript profiles caused by SARS-CoV-2 infection at different multiplicities of infection for lung airway organoids, lung alveolar organoids and cardiomyocytes, and identified several genes that are generally implicated in controlling SARS-CoV-2 infection, including CIART, the circadian-associated repressor of transcription. Lung airway organoids, lung alveolar organoids and cardiomyocytes derived from isogenic CIART-/- human pluripotent stem cells were significantly resistant to SARS-CoV-2 infection, independently of viral entry. Single-cell RNA-sequencing analysis further validated the decreased levels of SARS-CoV-2 infection in ciliated-like cells of lung airway organoids. CUT&RUN, ATAC-seq and RNA-sequencing analyses showed that CIART controls SARS-CoV-2 infection at least in part through the regulation of NR4A1, a gene also identified from the multi-organoid analysis. Finally, transcriptional profiling and pharmacological inhibition led to the discovery that the Retinoid X Receptor pathway regulates SARS-CoV-2 infection downstream of CIART and NR4A1. The multi-organoid platform identified the role of circadian-clock regulation in SARS-CoV-2 infection, which provides potential therapeutic targets for protection against COVID-19 across organ systems.


Conflict of interest statement

R.E.S. is on the scientific advisory board of Miromatrix Inc, and is a paid consultant and speaker for Alnylam Inc. S.C. and T.E. are the co-founders of OncoBeat, LLC. S.C. is a consultant for Vesalius Therapeutics. The remaining authors declare no competing interests.

Figures

Fig. 1
Fig. 1. A multi-organoid platform to identify genes involved in SARS-CoV-2 infection.
a, Schematic of the experimental design. b, Levels of subgenomic viral transcripts, determined by qRT-PCR, in hPSC-derived AWOs, ALOs and CMs at 48 h.p.i. with SARS-CoV-2 at different m.o.i. (m.o.i. = 0.01, 0.10 and 1.00). The dashed red line indicates the detection limit. c, Three-dimensional analysis of transcriptional changes in hPSC-derived AWOs, ALOs and CMs infected at 48 h.p.i. (m.o.i. = 0.01, 0.10 and 1.00). The genes that were significantly changed (log2(fold change) > 0.75, base mean > 10 and adjusted P < 0.05) in each condition are highlighted in purple. d, Heatmap of the protein-coding genes that were increased for at least seven of nine conditions in hPSC-derived AWOs, ALOs and CMs at 48 h.p.i. (m.o.i. = 0.01, 0.10 and 1.00). c,d, Data are presented as an integration of all biological replicates. e,f, Representative confocal images (e) and the calculated percentage of SARS-N+ cells in the cTnT+ subpopulation (f) of hPSC-CMs infected with lentivirus carrying Cas9 and sgRNAs targeting hit genes. P values were calculated using an unpaired two-tailed Student’s t-test. The red text and red bar highlight that knockout of CIART showed the greatest resistance to SARS-CoV-2 infection. b,e,f, Data are the mean ± s.d. b,cf, n = 3 independent biological replicates. Source data
Fig. 2
Fig. 2. Loss of CIART decreases SARS-CoV-2 infection.
a, Relative expression levels of viral RNA in WT and CIART−/− hPSC-CMs at 24 h.p.i. with SARS-CoV-2 (m.o.i. = 0.3). b,c, Representative confocal images (b) and calculated percentages (c) of SARS-N+ cells within the cTnT+ cell populations of WT and CIART−/− hPSC-CMs at 24 h.p.i. with SARS-CoV-2 (m.o.i. = 0.3). d, Relative expression levels of viral RNA in WT and CIART−/− hPSC-AWOs at 24 h.p.i. with SARS-CoV-2 (m.o.i. = 0.3). e,f, Representative confocal images (e) and calculated percentages (f) of SARS-N+ cells within the FOXJ1+ cell populations of WT and CIART−/− hPSC-AWOs at 24 h.p.i. with SARS-CoV-2 (m.o.i. = 0.3). g, Relative expression levels of viral RNA in WT and CIART−/− hPSC-ALOs at 24 h.p.i. with SARS-CoV-2 (m.o.i. = 0.3). h,i, Representative confocal images (h) and calculated percentages (i) of SARS-N+ cells in the mature SP-B+ cell populations of WT and CIART−/− hPSC-ALOs at 24 h.p.i. with SARS-CoV-2 (m.o.i. = 0.3). j,k, Representative confocal images (j) and calculated percentages (k) of SARS-N+ cells in the mature SP-C+ cell populations of WT and CIART−/− hPSC-ALOs at 24 h.p.i. with SARS-CoV-2 (m.o.i. = 0.3). ak, n = 3 independent biological replicates. l, Percentage of viral UMI counts in mock- and SARS-CoV-2-infected WT and CIART−/− hPSC-AWOs (m.o.i. = 0.1; 24 h.p.i.). m, Uniform manifold approximation and projection (UMAP) plot illustrating five cell clusters in the hPSC-AWOs. n, Correlation analysis of cell clusters in hPSC-AWOs and adult human lung. o, Percentage of viral UMI counts in each cluster of WT and CIART−/− hPSC-AWOs following SARS-CoV-2 infection (m.o.i. = 0.1; 24 h.p.i.). p, Levels of SARS-CoV-2 viral transcripts in ciliated-like cells 1 of WT and CIART−/− hPSC-AWOs following SARS-CoV-2 infection (m.o.i. = 0.1; 24 h.p.i.). Data are the mean ± s.d. P values were calculated using an unpaired two-tailed Student’s t-test. Scale bars, 100 μm. Source data
Fig. 3
Fig. 3. CIART promotes SARS-CoV-2 infection through NR4A1 regulation.
a, Average profile of CIART CUT&RUN peaks in WT hPSC-CMs around the TSS. b, Distribution of the genomic locations of CUT&RUN peaks in WT hPSC-CMs. c, Profile heatmap showing the distribution of CUT&RUN peaks in WT hPSC-CMs around the TSS. ac, Data are presented as an integration of all biological replicates; n = 2 independent biological replicates. d, Clustering analysis of ATAC-seq data of WT and CIART−/− hPSC-CMs. e, Profile ATAC-seq heatmap showing the enrichment of gain and loss sites in WT and CIART−/− hPSC-CMs. f,g, RNA-sequencing PCA (f) and sample clustering (g) analysis of WT and CIART−/− hPSC-AWOs under mock infection conditions. dg, Data are presented as the individual biological replicates (d,f,g) or an integration of all biological replicates (e); n = 3 independent biological replicates. h, Summary of peaks in the CUT&RUN, ATAC-seq and RNA-seq assays. i, Peaks associated with the NR4A1 gene in WT and CIART−/− hPSC-CMs in the ATAC-seq and CUT&RUN assays. Data are presented as individual biological replicates (n = 3 for ATAC-seq) and 2 for CUT&RUN). The schematic below the plots illustrates the exon and intron regions of gene NR4A1 in the genome. j, Expression levels, measured by qRT-PCR, of NR4A1 in WT and CIART−/− hPSC-CMs following mock or SARS-CoV-2 infection (m.o.i. = 0.1). km, Relative expression levels of SARS-CoV-2 RNA in hPSC-CMs (k) as well as representative confocal images (l) and calculated percentages (m) of SARS-N+ cells in the cTnT+ subsets of hPSC-CMs expressing scramble sgRNA or sgNR4A1 at 24 h.p.i. (m.o.i. = 0.1). np, Relative expression levels of SARS-CoV-2 viral RNA in hPSC-AWOs (n) as well as representative confocal images (o) and calculated percentages (p) of SARS-N+ cells within the FOXJ1+ cell populations of hPSC-AWOs expressing scramble sgRNA or sgNR4A1 at 24 h.p.i. (m.o.i. = 0.1). qs. Relative expression levels of SARS-CoV-2 RNA in hPSC-ALOs (q) as well as representative confocal images (r) and calculated percentages (s) of SARS-N+ cells within the mature SP-B+ cell populations of hPSC-ALOs expressing scramble sgRNA or sgNR4A1 at 24 h.p.i. (m.o.i. = 0.1). t,u, Representative confocal images (t) and calculated percentages (u) of SARS-N+ cells within mature SP-C+ cell populations of hPSC-ALOs expressing scramble sgRNA or sgNR4A1 at 24 h.p.i. (m.o.i. = 0.1). ju, Data are presented as the mean ± s.d. (j,k,m,n,p,q,s,u); n = 3 independent biological replicates. P values were calculated by unpaired two-tailed Student’s t-test. Scale bars, 100 μm. Source data
Fig. 4
Fig. 4. CIART regulates SARS-CoV-2 infection through the RXR pathway.
ac, Enriched pathways in CIART−/− hPSC-AWOs (a), hPSC-ALOs (b) and hPSC-CMs (c) relative to their WT counterparts. The B-H p-value was corrected by the Benjamini-Hochberg method. The text in blue highlights that the RXR signaling pathway was enriched in CIART−/− AWOs, ALOs and CMs. df, Heatmap of RXR pathway-associated genes comparing WT and CIART−/− hPSC-AWOs (d), hPSC-AWOs (e) and hPSC-CMs (f). g, Relative expression levels of SARS-CoV-2 RNA in hPSC-CMs treated with DMSO, HX531 or PA452 (24 h.p.i.; m.o.i. = 0.3). h,i, Representative confocal images (h) and calculated percentages (i) of SARS-N+ cells in the cTnT+ subsets of hPSC-CMs treated with DMSO, HX531 or PA452 (24 h.p.i.; m.o.i. = 0.3). j, Relative expression levels of SARS-CoV-2 RNA in hPSC-AWOs treated with DMSO, HX531 or PA452 (24 h.p.i.; m.o.i. = 0.3). k,l, Representative confocal images (k) and calculated percentages (l) of SARS-N+ cells within the FOXJ1+ cell populations of hPSC-AWOs treated with DMSO, HX531 or PA452 (24 h.p.i.; m.o.i. = 0.3). m, Relative expression levels of SARS-CoV-2 RNA in hPSC-ALOs treated with DMSO, HX531 or PA452 (24 h.p.i.; m.o.i. = 0.3). n,o, Representative confocal images (n) and calculated percentages (o) of SARS-N+ cells within the mature SP-B+ cell populations of hPSC-ALOs treated with DMSO, HX531 or PA452 (24 h.p.i.; m.o.i. = 0.3). p,q, Representative confocal images (p) and calculated percentages (q) of SARS-N+ cells within the mature SP-C+ cell populations of hPSC-ALOs treated with DMSO, HX531 or PA452 (24 h.p.i.; m.o.i. = 0.3). Data are presented as an integration of all biological replicates (ac), individual biological replicates (df) or the mean ± s.d. (g,i,j,l,m,o,q); n = 3 independent biological replicates. P values were calculated using a paired or an unpaired two-tailed Student’s t-test. Scale bars, 100 μm. Source data
Extended Data Fig. 1
Extended Data Fig. 1. Characterization of hPSC-ALOs, hPSC-AWOs and hPSC-CMs.
a, Scheme of hPSC-ALO differentiation. b, Representative confocal images of day 45 hPSC-ALOs. Scale bar, 100 μm. c, Scheme of hPSC-AWO differentiation. d, Representative confocal images of day 40 hPSC-AWOs. Scale bar, 100 μm. e, Scheme of hPSC-CMs differentiation. f, Representative confocal images of day 30 hPSC-CMs. Scale bar, 100 μm. g, Flow cytometry analysis of α-actinin and cTnT expression in day 30 hPSC-CMs. Source data
Extended Data Fig. 2
Extended Data Fig. 2. LD50 of hPSC-CMs and heatmap of IFN-1 genes.
a, Cell viability of hPSC-CMs at 48 h.p.i. with SARS-CoV-2 at different m.o.i. LD50, m.o.i. = 0.333. n = 3 independent biological replicates. Data are presented as the mean ± s.d. b, Heatmap showing induction of genes involved in the type 1 IFN signalling pathway in SARS-CoV-2-infected hPSC-ALOs, -AWOs and -CMs (m.o.i. = 0.01, 0.1 and 1). n = 3 independent biological replicates. Data are presented as an integration of all biological replicates. Source data
Extended Data Fig. 3
Extended Data Fig. 3. Characterization of WT and CIART−/− hPSCs.
a, Scheme of gene targeting. b, DNA sequencing of WT and CIART−/− hPSCs. c, Immunostaining of pluripotency markers of WT and CIART−/− hPSCs. Scale bar, 100 μm. d, Western blotting for CIART in lysates from WT and CIART−/− H1 ESCs, hPSC-AWOs, hPSC-ALOs and hPSC-CMs. Source data
Extended Data Fig. 4
Extended Data Fig. 4. Differentiation of WT and CIART−/− hPSCs.
a, Representative confocal images of α-actinin+cTnT+ cells of WT and CIART−/− hPSC-CMs. Scale bar, 100 μm. b, Representative confocal images of FOXJ1+ cells of WT and CIART−/− hPSC-AWOs. Scale bar, 100 μm. c, Representative confocal images of mature SP-B+ cells of WT and CIART−/− hPSC-ALOs. Scale bar, 100 μm. d, Representative confocal images of mature SP-C+ cells of WT and CIART−/− hPSC-ALOs. Scale bar, 100 μm.
Extended Data Fig. 5
Extended Data Fig. 5. Loss of CIART decreases SARS-CoV-2 infection at 48 h.p.i.
a, Relative SARS-CoV-2 viral RNA expression levels (at 48 h.p.i.) of WT and CIART−/− hPSC-CMs infected with SARS-CoV-2 (m.o.i. = 0.3). n = 3 independent biological replicates. b,c, Representative confocal images (b) and quantification (c) of SARS-N+ cells in cTnT+ cells (at 48 h.p.i.) of WT and CIART−/− hPSC-CMs infected with SARS-CoV-2 virus (m.o.i. = 0.3). Scale bar, 100 μm. n = 3 independent biological replicates. d, Relative SARS-CoV-2 viral RNA expression levels at 48 h.p.i. in WT and CIART−/− hPSC-AWOs infected with SARS-CoV-2 (m.o.i. = 0.3). n = 3 independent biological replicates. e,f, Representative confocal images (e) and quantification (f) of SARS-N+ cells in FOXJ1+ cells (at 48 h.p.i.) of WT and CIART−/− hPSC-AWOs infected with SARS-CoV-2 (m.o.i. = 0.3). Scale bar, 100 μm. n = 3 independent biological replicates. g, Relative SARS-CoV-2 viral RNA expression levels (at 48 h.p.i.) of WT and CIART−/− hPSC-ALOs infected with SARS-CoV-2 (m.o.i. = 0.3). n = 3 independent biological replicates. h,i, Representative confocal images (h) and quantification (i) of SARS-N+ cells in mature SP-B+ cells (at 48 h.p.i.) of WT and CIART−/− hPSC-ALOs infected with SARS-CoV-2 (m.o.i. = 0.3). Scale bar, 100 μm. n = 3 independent biological replicates. j,k, Representative confocal images (j) and quantification (k) of SARS-N+ cells in mature SP-C+ cells (at 48 h.p.i.) of WT and CIART−/− hPSC-ALOs infected with SARS-CoV-2 (m.o.i. = 0.3). Scale bar, 100 μm. n = 3 independent biological replicates. l, Relative luciferase activity (at 24 h.p.i.) for hPSC-ALOs infected with SARS-CoV-2 pseudo-typed entry reporter virus (m.o.i. = 0.01). n = 3 independent biological replicates. m, Relative luciferase activity (at 24 h.p.i.) for hPSC-AWOs infected with SARS-CoV-2 pseudo-typed entry reporter virus (m.o.i. = 0.01). n = 3 independent biological replicates. n, Relative influenza viral RNA expression level of mock- and influenza-infected hPSC-ALOs, -AWOs and -CMs at 48 h.p.i. (m.o.i. = 1). n = 3 independent biological replicates. o, Relative CIART expression level of mock- and influenza-infected hPSC-ALOs, -AWOs and -CMs at 48 h.p.i. (m.o.i. = 1). n = 3 independent biological replicates. Data are presented as the mean ± s.d. P values were calculated using an unpaired two-tailed Student’s t-test. Source data
Extended Data Fig. 6
Extended Data Fig. 6. scRNA-seq analysis of mock- and SARS-CoV-2-infected WT and CIART−/− hPSC-AWOs.
a, UMAP of marker genes in hPSC-AWOs. b, Percentage of each cell type in mock- and SARS-CoV-2-infected WT and CIART−/− hPSC-AWOs.
Extended Data Fig. 7
Extended Data Fig. 7. RNA-seq analysis of WT and CIART−/− hPSC-derived AWOs, ALOs and CMs.
a,b, PCA (a) and sample clustering (b) analysis of WT and CIART−/− hPSC-AWOs under mock infection conditions. c,d, PCA (c) and sample clustering (d) analysis of WT and CIART−/− hPSC-AWOs at 24 h.p.i. (m.o.i. = 0.1). e,f, PCA (e) and sample clustering (f) analysis of WT and CIART−/− hPSC-ALOs under mock infection conditions. g,h, PCA (g) and sample clustering (h) analysis of WT and CIART−/− hPSC-ALOs at 24 h.p.i. (m.o.i. = 0.1). i,j, PCA (i) and sample clustering (j) analysis of WT and CIART−/− hPSC-CMs under mock infection conditions. k,l, PCA (k) and sample clustering (l) analysis of WT and CIART−/− hPSC-CMs at 24 h.p.i. (m.o.i. = 0.1). mo, Heatmaps of RXR pathway-associated genes in WT and CIART−/− hPSC-derived AWOs (m), ALOs (n) and CMs (o) at 24 h.p.i. (m.o.i. = 0.1). n = 3 independent biological replicates. Data are presented as individual biological replicates. pr, Heatmap of RXR pathway-associated genes in control and sgNR4A1-infected hPSC-derived AWOs (p), ALOs (q) and CMs (r). n = 3 independent biological replicates. Data are presented as individual biological replicates. Source data
Extended Data Fig. 8
Extended Data Fig. 8. RNA-seq and metabolism profiling of WT and CIART−/− hPSC-AWOs.
a, Heatmap of genes involved in fatty-acid synthesis for WT and CIART−/− hPSC-AWOs. n = 3 independent biological replicates. b, Clustering analysis of DMSO- and HX531-treated hPSC-AWOs. n = 3 independent biological replicates. c, PCA of DMSO- and HX531-treated hPSC-AWOs. n = 3 independent biological replicates. d, Heatmap of genes involved in fatty-acid synthesis for DMSO- and HX531-treated WT hPSC-AWOs. n = 3 independent biological replicates. e, Heatmap of metabolic profiles for WT, CIART−/− and HX531-treated hPSC-AWOs. n = 3 independent biological replicates. Source data

Comment in

References

    1. Yang L, et al. A human pluripotent stem cell-based platform to study SARS-CoV-2 tropism and model virus infection in human cells and organoids. Cell Stem Cell. 2020;27:125–136. doi: 10.1016/j.stem.2020.06.015. - DOI - PMC - PubMed
    1. Han Y, et al. Identification of SARS-CoV-2 inhibitors using lung and colonic organoids. Nature. 2021;589:270–275. doi: 10.1038/s41586-020-2901-9. - DOI - PMC - PubMed
    1. Samuel RM, et al. Androgen signaling regulates SARS-CoV-2 receptor levels and is associated with severe COVID-19 symptoms in men. Cell Stem Cell. 2020;27:876–889. doi: 10.1016/j.stem.2020.11.009. - DOI - PMC - PubMed
    1. Tiwari SK, Wang S, Smith D, Carlin AF, Rana TM. Revealing tissue-specific SARS-CoV-2 infection and host responses using human stem cell-derived lung and cerebral organoids. Stem Cell Rep. 2021;16:437–445. doi: 10.1016/j.stemcr.2021.02.005. - DOI - PMC - PubMed
    1. Pei R, et al. Host metabolism dysregulation and cell tropism identification in human airway and alveolar organoids upon SARS-CoV-2 infection. Protein Cell. 2021;12:717–733. doi: 10.1007/s13238-020-00811-w. - DOI - PMC - PubMed

Publication types

Substances