

Overall childbirth experience: what does it mean? A comparison between an overall childbirth experience rating and the Childbirth Experience Questionnaire 2
- PMID: 36918812
- PMCID: PMC10012290
- DOI: 10.1186/s12884-023-05498-5
Overall childbirth experience: what does it mean? A comparison between an overall childbirth experience rating and the Childbirth Experience Questionnaire 2
Abstract
Background: In clinical settings and research studies, childbirth experience is often measured using a single-item question about overall experience. Little is known about what women include in this rating, which complicates the design of adequate follow-up, as well as the interpretation of research findings based on ratings of overall childbirth experience. The aim of this study was to examine which known dimensions of childbirth experience women include in the rating on a single-item measure.
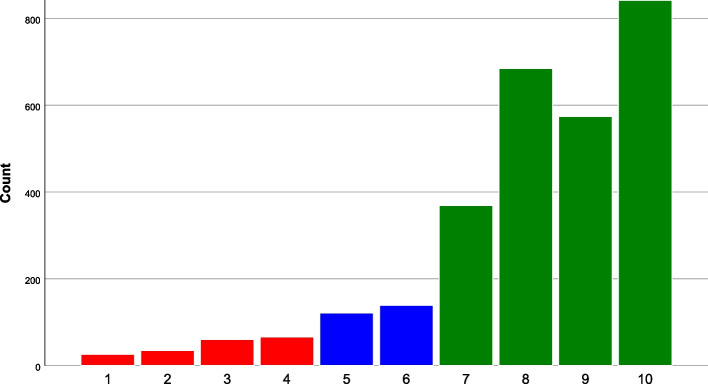
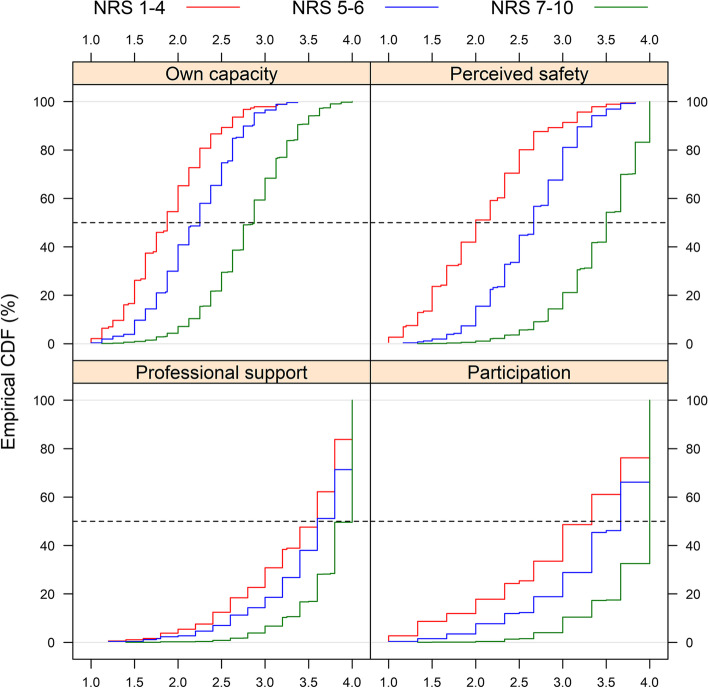
Methods: Ratings of overall childbirth experience on a 10-point numeric rating scale (NRS) from 2953 women with spontaneous or induced onset of labour at two Swedish hospitals were evaluated against the validated Childbirth Experience Questionnaire 2 (CEQ2), completed on one of the first days postpartum. The CEQ2 measures four childbirth experience domains: own capacity, perceived safety, professional support and participation. Internal consistency for CEQ2 was evaluated by calculating Cronbach's alpha. NRS ratings were explored in relation to CEQ2 using empirical cumulative distribution function graphs, where childbirth experience was defined as negative (NRS ratings 1-4), mixed (NRS ratings 5-6) or positive (NRS ratings 7-10). A multiple linear regression analysis, presented as beta coefficients (B) and 95% confidence intervals (CI), was also performed to explore the relationship between the four domains of the CEQ2 and overall childbirth experience.
Results: The prevalence of negative childbirth experience was 6.3%. All CEQ2-subscales reached high or acceptable reliability (Cronbach's alpha = 0.78; 0.81; 0.69 and 0.66, respectively). Regardless of overall childbirth experience, the majority of respondents scored high on the CEQ2 subscale representing professional support. Overall childbirth experience was mainly explained by perceived safety (B = 1.60, CI 1.48-1.73), followed by own capacity (B = 0.65, CI 0.53-0.77) and participation (B = 0.43, CI 0.29-0.56).
Conclusions: In conclusion, overall childbirth experience rated by a single-item measurement appears to mainly capture experiences of perceived safety, and to a lesser extent own capacity and participation, but appears not to reflect professional support. CEQ2 shows good psychometric properties for use shortly after childbirth, and among women with induced onset of labour, which increases the usability of the instrument.
Keywords: Birth satisfaction; CEQ2; Childbirth experience; Labour; Psychological birth trauma; Questionnaires; Single-item; VAS; Visual Analogue Scale.
© 2023. The Author(s).
Conflict of interest statement
Over the past five years, Inger Sundström Poromaa has occasionally served on advisory boards or been an invited speaker at scientific meetings for Bayer Health Care, Gedeon Richter, Sandoz and Novartis outside the submitted work. The other authors declare that they have no known competing financial interests or personal relationships that could have influenced the work reported in this paper.
Figures
References
-
- Viirman F, Hesselman S, Wikström AK, Skoog Svanberg A, Skalkidou A, SundströmPoromaa I, et al. Negative childbirth experience – what matters most? a register-based study of risk factors in three time periods during pregnancy. Sex Reprod Healthc. 2022;1(34):100779. doi: 10.1016/j.srhc.2022.100779. - DOI - PubMed
MeSH terms
LinkOut - more resources
Full Text Sources
Medical
