. 2023 Apr;43(4):455-479.
doi: 10.1002/cac2.12414. Epub 2023 Mar 14.

Cancer-associated fibroblast-derived secreted phosphoprotein 1 contributes to resistance of hepatocellular carcinoma to sorafenib and lenvatinib

Affiliations

Cancer-associated fibroblast-derived secreted phosphoprotein 1 contributes to resistance of hepatocellular carcinoma to sorafenib and lenvatinib

Jung Woo Eun et al. Cancer Commun (Lond). 2023 Apr.

Abstract

Background: Cancer-associated fibroblasts (CAFs) play an important role in the induction of chemo-resistance. This study aimed to clarify the mechanism underlying CAF-mediated resistance to two tyrosine kinase inhibitors (TKIs), sorafenib and lenvatinib, and to identify a novel therapeutic target for overcoming TKI resistance in hepatocellular carcinoma (HCC).

Methods: We performed a systematic integrative analysis of publicly available gene expression datasets and whole-transcriptome sequencing data from 9 pairs of CAFs and para-cancer fibroblasts isolated from human HCC and para-tumor tissues, respectively, to identify key molecules that might induce resistance to TKIs. We then performed in vitro and in vivo experiments to validate selected targets and related mechanisms. The associations of plasma secreted phosphoprotein 1 (SPP1) expression levels before sorafenib/lenvatinib treatment with progression-free survival (PFS) and overall survival (OS) of 54 patients with advanced HCC were evaluated using Kaplan-Meier and Cox regression analysis.

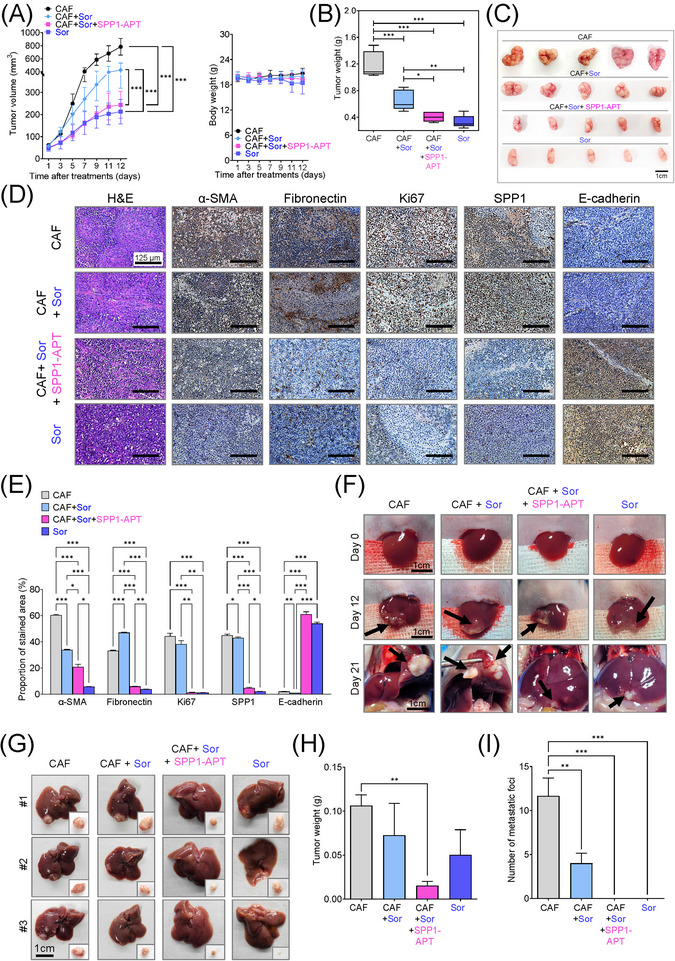
Results: Bioinformatic analysis identified CAF-derived SPP1 as a candidate molecule driving TKI resistance. SPP1 inhibitors reversed CAF-induced TKI resistance in vitro and in vivo. CAF-derived SPP1 activated rapidly accelerated fibrosarcoma (RAF)/mitogen-activated protein kinase (MAPK) and phosphatidylinositol 3-kinase (PI3K)/protein kinase B (AKT)/mammalian target of rapamycin (mTOR) through the integrin-protein kinase C-alpha (PKCα) signaling pathway and promoted epithelial-to-mesenchymal transition (EMT). A high plasma SPP1 level before TKI treatment was identified as an independent predictor of poor PFS (P = 0.026) and OS (P = 0.047) in patients with advanced HCC after TKI treatment.

Conclusions: CAF-derived SPP1 enhances TKI resistance in HCC via bypass activation of oncogenic signals and EMT promotion. Its inhibition represents a promising therapeutic strategy against TKI resistance in HCC. Moreover, plasma SPP1 level before TKI treatment represents a potential biomarker for treatment response prediction.

Keywords: drug resistance; epithelial-to-mesenchymal transition; hepatocellular carcinoma; secreted phosphoprotein 1.


Conflict of interest statement

The authors have declared that no conflict of interest exists.

Figures

FIGURE 1
FIGURE 1
CAFs suppressed the sensitivity of HCC cells to sorafenib and lenvatinib. (A) Immunofluorescence analysis for the levels of α‐SMA in isolated fibroblasts. (B‐D) CAF‐CM‐incubated HCC cells (Hep3B and Huh‐7 cells) showed significantly lower sensitivity to sorafenib (15 μmol/L) or lenvatinib (5 μmol/L) compared to para‐cancer fibroblast‐CM‐ or NF‐CM‐incubated HCC cells based on cell viability (B), cell proliferation (C), and caspase 3/7 activity assays (D). (E) Comparison of changes in mean tumor volume (top) and body weight (bottom) during sorafenib treatment between the groups. (mean ± SEM; One‐way ANOVA test; *P < 0.05; **P < 0.01; ***P < 0.001). Abbreviations: α‐SMA, alpha smooth muscle actin; DAPI, 4′, 6‐diamidino‐2‐phenylindole; NF, normal fibroblast; CAFs, cancer‐associated fibroblasts; PAF, para‐cancer fibroblast; CM, culture medium; Sor, sorafenib; Len, lenvatinib; BrdU, 5‐bromo‐2'‐deoxyuridine‐5'‐monophosphate.
FIGURE 2
FIGURE 2
Identification of the CAF‐derived molecules that induce resistance to sorafenib or lenvatinib in patients with HCC. (A) Heat map of 790 genes overexpressed in CAFs. (B) GSEA of the genes overexpressed in CAFs. (C) Process of candidate gene selection. (D) Expression levels of the 9 candidate genes according to sorafenib response in the GSE109211 dataset. (E) Comparison of SPP1 expression between sorafenib responders and non‐responders in the GSE109211 and GSE143233 datasets. (F) Immunofluorescence staining of α‐SMA and SPP1 in tumor tissues from patients with HCC. (G) Comparison of SPP1 expression between CAFs and their paired para‐cancer fibroblasts in the WTS data from the 9 pairs of CAF and para‐cancer fibroblasts. (H) Representative H&E and SPP1 IHC images of the tumor (T), tumor stroma (S) (left), and non‐tumor fibrous tissue (middle) in an SPP1‐high patient. Scale bar, 50 μm. Comparison of SPP1 IHC staining intensity according to tumor location in the SPP1‐high group (right). (I) Representative H&E and SPP1 IHC images of tumor (T), tumor stroma (S) (left), and non‐tumor fibrous tissue (middle) in an SPP1‐low patient. Comparison of SPP1 IHC staining intensity according to tumor location in the SPP1‐low group (right). (Mean ± SEM; unpaired Welch's t‐test; *P < 0.05; **P < 0.01; ***P < 0.001). Abbreviations: HCC, hepatocellular carcinoma; NF, normal fibroblast; CAFs, cancer‐associated fibroblasts; ELISA, enzyme linked immunosorbent assay; H&E, hematoxylin and eosin; α‐SMA, alpha smooth muscle actin; SPP1, secreted phosphoprotein 1; DAPI, 4′, 6‐diamidino‐2‐phenylindole; PAF, para‐cancer fibroblast; S, tumor stroma; T, tumor; IHC, immunohistochemistry.
FIGURE 3
FIGURE 3
Effect of CAF‐derived SPP1 and SPP1‐BP on HCC sensitivity to sorafenib or lenvatinib in terms of wound healing, migration, and invasion. (A‐F) Changes in the capacity for wound healing (A, D), migration (B, E), and invasion (C, F) in Huh‐7 cells treated with CAF‐CM, rSPP1, sorafenib (15 μmol/L), lenvatinib (5 μmol/L), and SPP1‐BP alone or in different combinations. (Mean ± SEM; One‐way ANOVA test; *P < 0.05; **P < 0.01; ***P < 0.001). Abbreviations: Ctrl, control; CAF, cancer‐associated fibroblast; CM, culture medium; rSPP1, recombinant SPP1; Sor, sorafenib; Len, lenvatinib; SPP1‐BP, SPP1‐blocking peptide.
FIGURE 4
FIGURE 4
Effect of CAFs and SPP1 aptamer on HCC resistance to sorafenib in vivo. (A) Changes in tumor volume (left) and body weight (right) during sorafenib treatment. (B‐C) Comparison of tumor weight between the groups (B) and macrograph of resected tumors (C). (D) H&E and IHC staining of α‐SMA, Fibronectin, Ki67, SPP1, and E‐cadherin in the tumor sections. (E) Comparison of IHC staining intensity for α‐SMA, Fibronectin, Ki67, SPP1, and E‐cadherin between the groups. (F) Representative images of liver and orthotopic tumors in each group on day 0, 12, and 21 after cell injection. (G) Representative images of orthotopic tumors in each group. (H) Comparison of orthotopic tumor weight between the groups. (I) Comparison of the intrahepatic metastatic foci number between the groups. (Mean ± SEM; Two‐way ANOVA test; *P < 0.05; **P < 0.01; ***P < 0.001). Abbreviations: CAF, cancer‐associated fibroblast; Sor, sorafenib; SPP1‐APT, SPP1‐aptamer; H&E, hematoxylin and eosin; α‐SMA, alpha smooth muscle actin; SPP1, secreted phosphoprotein 1.
FIGURE 5
FIGURE 5
Integrin complexes (integrin αVβ5, α5β1, and αVβ1) on HCC cells were identified as binding proteins of SPP1. (A) Western blotting of SPP1 receptor‐binding protein expression in HCC cells. (B) Measurement of CD44 and integrin expression in Hep3B and Huh‐7 cells by fluorescent intensity. (C‐E) Co‐IP of SPP1 after CAF‐CM treatment, followed by Western blotting for SPP1, ITGA5, ITGAV, ITGB1, and ITGB5 in HCC cells (C), HCC cells silenced for ITGB1 and/or ITGB5 (D), and HCC cells incubated with/without SPP1‐BP (E). Abbreviations: ITGA4, integrin subunit α4; ITGA5, integrin subunit α5; ITGA8, integrin subunit α8; ITGA9, integrin subunit α9; ITGAV, integrin subunit αV; ITGB1, integrin subunit β1; ITGB3, integrin subunit β3; ITGB5, integrin subunit β; GAPDH, glyceraldehyde 3‐phosphate dehydrogenase; RFU, relative fluorescence units; IgG, immunoglobulin G; SPP1, secreted phosphoprotein 1; CAF, cancer‐associated fibroblast; CM, culture medium; IB, immunoblotting; siCtrl, negative control; SPP1‐BP, SPP1‐blocking peptide.
FIGURE 6
FIGURE 6
Molecular mechanism underlying CAF‐derived SPP1‐induced resistance to sorafenib or lenvatinib. (A‐B) Changes in the expression levels of PKCα, BRAF/ERK/STAT3, and PI3K/AKT/mTOR pathway proteins in CAF‐CM‐incubated Huh‐7 cells treated with sorafenib (15 μmol/L; A) or lenvatinib alone (5 μmol/L; B) and in combination with SPP1‐BP. (C‐D) Changes in the phosphorylation of AKT, mTOR, BRAF, and ERK1/2 under ITGB1 and/or ITGB5 silencing in Hep3B and Huh‐7 cells treated with sorafenib (C) or lenvatinib (D) in combination with CAF‐CM. (Mean ± SEM; Two‐way ANOVA test; *P < 0.05; **P < 0.01; ***P < 0.001). Abbreviations: DMSO, dimethyl sulfoxide; CAF, cancer‐associated fibroblast; CM, culture medium; Sor, sorafenib; SPP1‐BP, SPP1‐blocking peptide, PKCα, protein kinase C α; BRAF,v‐Raf murine sarcoma viral oncogene homolog B; ERK, extracellular signal‐related kinase; STAT3, signal transducer and activator of transcription 3; GAPDH, glyceraldehyde 3‐phosphate dehydrogenase; PI3K, phosphatidylinositol‐3‐kinase; AKT, protein kinase B; mTOR, mammalian target of rapamycin; Len, lenvatinib; siCtrl, negative control; ITGB1, integrin subunit β1; ITGB5, integrin subunit β5.
FIGURE 7
FIGURE 7
Prognostic relevance of SPP1 expression in TCGA LIHC data and enrichment of EMT‐related genes in the SPP1‐positive CAF cluster in GSE151530. (A) SPP1 expression in HCC and adjacent non‐tumor tissues of TCGA LIHC (left), SPP1 expression according to histologic grade and clinical status of liver disease in TCGA LIHC (middle) and Catholic LIHC (right). (B) Kaplan‐Meier plots of OS (left) and DFS (right) based on SPP1 expression in TCGA LIHC. (C) Heatmap of SPP1‐related genes in TCGA LIHC (left). Comparison of OS and DFS between clusters divided by SPP1‐related gene expression patterns (right). (D) GSEA of SPP1‐related gene signatures. (E) UMAP plot depicting cells of the human HCC microenvironment. (F) Expression heatmap of the top 100 enriched genes in subclusters of fibroblasts (C0 to C5). (G) UMAP plot visualizing subclusters of fibroblasts. (H) Violin plot showing SPP1 expression levels in fibroblast subclusters. (I) Bar graph showing the top 10 enriched terms in C4 fibroblasts using the ‘MSigDB Hallmark’ database. (Mean ± SEM; One‐way ANOVA test; *P < 0.05; **P < 0.01; ***P < 0.001). Abbreviations: SPP1, secreted phosphoprotein 1; TCGA LIHC, The Cancer Genome Atlas liver hepatocellular carcinoma project; Catholic LIHC, Catholic University of Korea's liver hepatocellular carcinoma project; NT, non‐tumor; T, tumor; NL, normal liver; CH, chronic hepatitis; LC, liver cirrhosis; eHCC, early HCC; avHCC, advanced HCC; OS, overall survival; DFS, disease free survival; HR, hazard ratio; CI, confidence interval; UMAP, Uniform manifold approximation and projection; CAFs, cancer‐associated fibroblasts; TAMs, Tumor‐associated macrophages; TECs, thymic epithelial cells; MSigDB, the Molecular Signatures Database.
FIGURE 8
FIGURE 8
Clinicopathological features in association with response to sorafenib and lenvatinib and Kaplan‐Meier analysis of PFS and OS as per plasma SPP1 levels in patients with HCC treated with sorafenib or lenvatinib. (A) Swimmer plot of time on treatment for enrolled patients (n = 54). Individual patient data are presented by each lane. (B) Computed tomography image of three responders showing tumor reduction after sorafenib or lenvatinib treatment. (C) PFS according to plasma SPP1 levels in all included patients (n = 54, left), patients treated with sorafenib (n = 36, middle), and patients treated with lenvatinib (n = 18, right). (D) OS according to plasma SPP1 levels in all included patients (n = 54, left), patients treated with sorafenib (n = 36, middle), and lenvatinib (n = 18, right). Abbreviations: PR, partial response; SD, stable disease; PD, progressive disease; AFP, alpha‐fetoprotein; Sor, sorafenib; Len, lenvatinib; PFS, progression free survival; OS, overall survival.
FIGURE 9
FIGURE 9
Schematic diagram illustrating the mechanism of CAF‐derived SPP1 in HCC resistance to sorafenib/lenvatinib. Abbreviations: SPP1, secreted phosphoprotein 1; HCC, hepatocellular carcinoma; CAF, cancer‐associated fibroblast; TKR, receptor tyrosine kinase; PKC, protein kinase C; RAF, rapidly accelerated fibrosarcoma; PI3K, phosphatidylinositol‐3‐kinase; ERK, extracellular signal‐related kinase; AKT, protein kinase B; STAT3, signal transducer and activator of transcription 3; mTOR, mammalian target of rapamycin; NTM, neurotrimin; COMP, cartilage oligomeric matrix protein; FAP, fibroblast activation protein alpha.

References

    1. Yang JD, Hainaut P, Gores GJ, Amadou A, Plymoth A, Roberts LR. A global view of hepatocellular carcinoma: trends, risk, prevention and management. Nat Rev Gastroenterol Hepatol. 2019;16(10):589‐604. - PMC - PubMed
    1. European Association for the Study of the Liver. Electronic address eee, European Association for the Study of the L. EASL Clinical Practice Guidelines: Management of hepatocellular carcinoma. J Hepatol. 2018;69(1):182‐236. - PubMed
    1. Llovet JM, Villanueva A, Marrero JA, Schwartz M, Meyer T, Galle PR, et al. Trial Design and Endpoints in Hepatocellular Carcinoma: AASLD Consensus Conference. Hepatology. 2021;73 Suppl 1:158‐91. - PubMed
    1. Cheng AL, Hsu C, SL Chan, Choo SP, Kudo M. Challenges of combination therapy with immune checkpoint inhibitors for hepatocellular carcinoma. J Hepatol. 2020;72(2):307‐19. - PubMed
    1. Faivre S, Rimassa L, Finn RS. Molecular therapies for HCC: Looking outside the box. J Hepatol. 2020;72(2):342‐52. - PubMed

Publication types

MeSH terms