. 2023 Mar 15;133(6):e151601.
doi: 10.1172/JCI151601.

HMGA1 induces FGF19 to drive pancreatic carcinogenesis and stroma formation

Affiliations

HMGA1 induces FGF19 to drive pancreatic carcinogenesis and stroma formation

Lionel Chia et al. J Clin Invest. .

Abstract

High mobility group A1 (HMGA1) chromatin regulators are upregulated in diverse tumors where they portend adverse outcomes, although how they function in cancer remains unclear. Pancreatic ductal adenocarcinomas (PDACs) are highly lethal tumors characterized by dense desmoplastic stroma composed predominantly of cancer-associated fibroblasts and fibrotic tissue. Here, we uncover an epigenetic program whereby HMGA1 upregulates FGF19 during tumor progression and stroma formation. HMGA1 deficiency disrupts oncogenic properties in vitro while impairing tumor inception and progression in KPC mice and subcutaneous or orthotopic models of PDAC. RNA sequencing revealed HMGA1 transcriptional networks governing proliferation and tumor-stroma interactions, including the FGF19 gene. HMGA1 directly induces FGF19 expression and increases its protein secretion by recruiting active histone marks (H3K4me3, H3K27Ac). Surprisingly, disrupting FGF19 via gene silencing or the FGFR4 inhibitor BLU9931 recapitulates most phenotypes observed with HMGA1 deficiency, decreasing tumor growth and formation of a desmoplastic stroma in mouse models of PDAC. In human PDAC, overexpression of HMGA1 and FGF19 defines a subset of tumors with extremely poor outcomes. Our results reveal what we believe is a new paradigm whereby HMGA1 and FGF19 drive tumor progression and stroma formation, thus illuminating FGF19 as a rational therapeutic target for a molecularly defined PDAC subtype.

Keywords: Cancer; Growth factors; Oncogenes; Oncology.


Figures
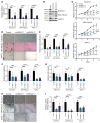
Figure 1
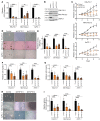
Figure 1. HMGA1 knockdown disrupts oncogenic properties in PDAC cell lines.
(A) HMGA1 expression in PDAC cell lines (E3LZ10.7, MIA PaCa-2, AsPC-1) comparing controls (transduced with empty lentiviral vector) to HMGA1 silencing via lentiviral delivery of shRNA targeting 2 different sequences (shHMGA1 1, shHMGA1 2) from 3 experiments performed in triplicate. (B) Representative immunoblots (n = 3 experiments) of HMGA1 in PDAC cells with and without HMGA1 silencing. (C) Proliferation (by MTT) comparing PDAC cells with and without HMGA1 silencing from 3 experiments performed in triplicate. (D) Representative images of soft agar clonogenicity assay in PDAC cells with and without HMGA1 silencing (E3LZ10.7, n = 2; MIA PaCa-2 and AsPC-1, n = 3). Scale bars: 200 μm. (E) Clonogenic efficiency comparing PDAC cell lines with and without HMGA1 silencing from experiments performed in triplicate (E3LZ10.7, n = 2; MIA PaCa-2 and AsPC-1, n = 3). (F) Migration comparing PDAC cells with and without HMGA1 silencing following treatment with 10 μM cytosine β-D-arabinoside (AraC) for 1 hour to mitigate effects of proliferation from experiments performed in triplicate (E3LZ10.7 and MIA PaCa-2, n = 2; AsPC-1, n = 3). (G) Invasion comparing PDAC cells with and without HMGA1 silencing following treatment with 10 μM AraC for 1 hour to mitigate effects of proliferation from experiments performed in triplicate (MIA PaCa-2, n = 2; E3LZ10.7 and AsPC-1, n = 3). (H) Representative images (n = 3 experiments) of 3D sphere formation in PDAC cell lines with and without HMGA1 silencing. Scale bars: 200 μm. (I) 3D sphere formation comparing PDAC cell lines with and without HMGA1 silencing from 3 experiments performed in triplicate. Data are presented as mean ± standard deviation (SD). *P < 0.05, **P < 0.01, ***P < 0.001, ****P < 0.0001 by 1-way ANOVA with Dunnett’s multiple-comparison test (A, C, EG, and I). Scale bars: 200 μm.
Figure 2
Figure 2. HMGA1 knockdown disrupts tumorigenesis and depletes tumor-initiating cells.
(A) Xenograft tumorigenicity at limiting dilutions comparing E3LZ10.7 cell HMGA1 silencing (n = 10/condition). (B) Xenograft tumorigenicity at limiting dilutions comparing AsPC-1 cells with and without HMGA1 silencing (n = 10/condition). (C) Comparison of tumors dissected at the completion of experiment with 1 × 10⁴ PDAC cells with and without HMGA1 silencing (left) and calculated frequency of tumor-initiating cells (right) in PDAC cells (E3LZ10.7, AsPC-1) with and without HMGA1 silencing. Tumor-initiating cell frequency was calculated by extreme limiting dilution analysis (ELDA; ref. 102). Data shown as mean ± standard error of the mean (SEM). *P < 0.05, **P < 0.01, ***P < 0.001 by Mann-Whitney test (A and B) or χ2 test (C).
Figure 3
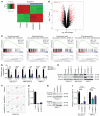
Figure 3. HMGA1 induces FGF19 expression and secretion in PDAC cell lines.
(A) Heatmap from hierarchical, supervised clustering of differentially expressed genes (DEGs) comparing control E3LZ10.7 cells to those with HMGA1 silencing (performed in duplicate in 1 RNA sequencing experiment). (B) Volcano plot of DEGs in E3LZ10.7 with and without HMGA1 silencing reveals FGF19 among the genes most repressed with HMGA1 silencing. Thresholds are shown as dashed red lines; genes (dots) with significant differential expression are shown in red. P < 0.05, log2(fold change) > 1.5. (C) GSEA of DEGs induced by HMGA1 in E3LZ10.7 controls (high HMGA1) compared to those with HMGA1 silencing show enrichment for gene sets associated with proliferation (E2F targets, G2/M checkpoint, mitotic spindle) and bile acid metabolism (MSigDb Hallmark). Normalized enrichment score (NES), false discovery rate (FDR), and P values are shown. (D) FGF19 expression in PDAC cells (E3LZ10.7, MIA PaCa-2, AsPC-1) with and without HMGA1 silencing from 3 experiments performed in triplicate. (E) Representative immunoblots (n = 3 experiments) of FGF19 levels in PDAC cells with and without HMGA1 silencing. (F) Cytokine arrays of secreted protein in E3LZ10.7 cells when HMGA1 is silenced. (G) Secreted FGF19 (relative pixel density) of duplicate spots on a single cytokine array per condition (control versus HMGA1 silencing via shHMGA1 1 or shHMGA1 2). (H) Representative immunoblots (n = 3 experiments) of secreted FGF19 in PDAC cells (E3LZ10.7, AsPC-1) with and without HMGA1 silencing. (I) Secreted FGF19 comparing PDAC cells (E3LZ10.7, AsPC-1) with and without HMGA1 silencing by ELISA from experiments performed in duplicate (E3LZ10.7, n = 3; AsPC-1, n = 2). Data are presented as mean ± SD. **P < 0.01, ***P < 0.001, ****P < 0.0001 by 1-way ANOVA with Dunnett’s multiple-comparison test (D and I).
Figure 4
Figure 4. FGF19 knockdown recapitulates most phenotypes associated with HMGA1 deficiency in PDAC cell lines.
(A) FGF19 expression in PDAC cells (E3LZ10.7, MIA PaCa-2, AsPC-1) comparing controls (empty lentiviral vector) to those with FGF19 silencing via lentiviral delivery of shRNA targeting 2 different sequences (shFGF19 1, shFGF19 2) from 3 experiments performed in triplicate. (B) Representative immunoblots (n = 3 experiments) of FGF19 protein levels in PDAC cells with and without FGF19 silencing. (C) MTT proliferation assays comparing PDAC cells with and without FGF19 silencing from 2 experiments performed in triplicate. (D) Representative images of clonogenicity assay comparing PDAC cells with and without FGF19 silencing (E3LZ10.7, MIA PaCa-2, n = 2; AsPC-1, n = 3). Scale bars: 200 μm. (E) Clonogenic efficiency comparing PDAC cell lines with and without HMGA1 silencing from experiments performed in triplicate (E3LZ10.7, MIA PaCa-2, n = 2; AsPC-1, n = 3). (F) Migration assay comparing PDAC cells with and without FGF19 silencing following treatment with 10 μM β-D-arabinoside (AraC) for 1 hour to mitigate effects of proliferation silencing from experiments performed in triplicate (MIA PaCa-2, n = 2; E3LZ10.7, AsPC-1, n = 3). (G) Invasion assay comparing PDAC cells with and without FGF19 silencing following treatment with 10 μM AraC for 1 hour to mitigate effects of proliferation silencing from experiments performed in triplicate (MIA PaCa-2, n = 2; E3LZ10.7, AsPC-1, n = 3). Scale bars: 200 μm. (H) Representative images (n = 3 experiments) of 3D sphere-formation assay comparing PDAC cells with and without HMGA1 silencing. (I) 3D sphere formation comparing PDAC cell lines with and without HMGA1 silencing from 3 experiments performed in triplicate. Data are presented as mean ± SD. *P < 0.05, **P < 0.01, ***P < 0.001, ****P < 0.0001 by 1-way ANOVA with Dunnett’s multiple-comparison test (A, C, EG, and I). Scale bars: 200 μm.
Figure 5
Figure 5. FGF19 knockdown disrupts tumorigenesis and depletes tumor-initiating cells, similar to phenotypes observed with HMGA1 silencing in PDAC xenografts.
(A) Xenograft tumorigenicity at limiting dilutions comparing E3LZ10.7 cells with and without FGF19 silencing (n = 10/condition). (B) Xenograft tumorigenicity at limiting dilutions comparing AsPC-1 cells with and without FGF19 silencing (n = 10/condition). (C) Comparison of tumors dissected at the completion of experiment with 1 × 10⁴ PDAC cells (E3LZ10.7, AsPC-1) with and without FGF19 silencing (left) and calculated frequency of tumor-initiating cells (right) among PDAC cells. Tumor-initiating cell frequency calculated by ELDA (102). Data shown as mean ± SEM. *P < 0.05, **P < 0.01 by Mann-Whitney test (A and B) or χ2 test (C).
Figure 6
Figure 6. HMGA1 induces FGF19 expression by binding to the FGF19 promoter and recruiting active histone marks.
(A) Schematic representation of the FGF19 promoter; R1 includes predicted HMGA1 binding site A; R2 includes predicted HMGA1 sites B and C. (B) ChIP-PCR comparing HMGA1 occupancy on the FGF19 promoter in E3LZ10.7 cells with and without HMGA1 silencing. (C) ChIP-PCR comparing HMGA1 occupancy on the FGF19 promoter in MIA PaCa-2 cells with and without HMGA1 silencing. (D) ChIP-PCR comparing HMGA1 occupancy on the FGF19 promoter in AsPC-1 cells with and without HMGA1 silencing. In BD, histone H3 served as a positive control for chromatin pull-down and the GAPDH promoter sequence as a negative control. (E) ChIP-PCR of control IgG at R1 and R2 in PDAC cells (E3LZ10.7, MIA PaCa-2, AsPC-1) with and without HMGA1 silencing. (F) ChIP-PCR for the H3K4me3 active histone mark on the FGF19 promoter in PDAC cells (E3LZ10.7, MIA PaCa-2, AsPC-1) with and without HMGA1 silencing. (G) ChIP-PCR for the H3K27Ac active histone mark on the FGF19 promoter in PDAC cells with and without HMGA1 silencing. All ChIP-PCR results are shown from 2 experiments performed in triplicate. Data are presented as mean ± SD. Significance was evaluated by 1-way ANOVA with Dunnett’s multiple-comparison test (BE), 2-tailed Student’s t test (E3LZ10.7, AsPC-1 cells; data normally distributed) and Mann-Whitney test (MIA Paca-2 cells; data not normally distributed) (F), or Mann-Whitney test (G). *P < 0.05, **P < 0.01, ****P < 0.0001.
Figure 7
Figure 7. HMGA1 binds to the FGF19 promoter to induce FGF19 expression.
(A) Reporter gene activity (via dual-luciferase assay) in E3LZ10.7 cells transfected with FGF19 promoter constructs. (B) Reporter gene activity (via dual-luciferase assay) in E3LZ10.7 cells after cotransfection with dominant-negative HMGA1 or control vector and FGF19 promoter constructs. (C) Reporter gene activity (via dual-luciferase assay) in E3LZ10.7 cells after cotransfection with HMGA1 silencing or control vector and FGF19 promoter constructs. Data shown as mean ± SD from 2 independent experiments performed in triplicate. **P < 0.01, ***P < 0.001, ****P < 0.0001 by 1-way ANOVA with Dunnett’s multiple-comparison test (AC). RLU, relative luminescence units.
Figure 8
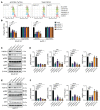
Figure 8. HMGA1 signals through the canonical FGF19/FGFR4 pathway.
(A) Representative flow cytometric profiles (n = 3 experiments) of phosphorylated FGFR4 (p-FGFR4) and total FGFR4 in PDAC cell lines (E3LZ10.7, AsPC-1) with and without HMGA1 silencing, FGF19 silencing, or treatment with the FGFR4 inhibitor BLU9931 (10 μM). (B) Comparison of mean fluorescence intensities (MFIs) of phosphorylated FGFR4 (p-FGFR4) and total FGFR4 in PDAC cell lines (E3LZ10.7, AsPC-1) with and without HMGA1 silencing, FGF19 silencing, or treatment with BLU9931 (10 μM). (C) Representative immunoblots (n = 3 experiments) and (D) relative protein levels of FGFR4 and downstream signaling molecules (ERK, AKT), including total protein and phosphorylated proteins in E3LZ10.7 cells with and without HMGA1 or FGF19 silencing. (E) Representative immunoblots (n = 3 experiments) and (F) relative protein levels of FGFR4 and downstream signaling molecules in AsPC-1 cells with and without HMGA1 or FGF19 silencing. Data shown as mean ± SD from 3 independent experiments performed in triplicate. *P < 0.05, **P < 0.01, ***P < 0.001, ****P < 0.0001 by 1-way ANOVA with Dunnett’s multiple-comparison test (B, D, and F).
Figure 9
Figure 9. HMGA1 and FGF19 induce fibrotic stroma formation, proliferation (Ki-67), and modulate CAF composition during PDAC xenograft tumorigenesis.
(A) Representative images (n = 10 per condition) of HMGA1 (IHC, top row), FGF19 (IHC, second row), fibrosis (trichrome, third row), and Ki-67 (IHC, bottom row) in E3LZ10.7 xenografts with and without HMGA1 or FGF19 silencing. (B) Quantitative comparison of stroma scores in E3LZ10.7 xenografts with and without HMGA1 or FGF19 silencing. Fibrosis scores based on 3-point system (0, <5%; 1, 5%–30%; 2, 30%–60%; 3, >60%) (n = 16 images taken from 3 control tumors, 2 shHMGA1 tumors, and 4 shFGF19 tumors). (C) Comparison of Ki-67–positive cell number in xenografts (5 fields at ×20 magnification of tumors from 2 different mice/group, with n = 10 per condition). (D) Representative IF images to compare CAF composition in E3LZ10.7 xenografts with and without HMGA1 or FGF19 silencing. (E) Total CAF numbers were ascertained by costaining with DAPI and for PDPN; α-SMA, CD74, and IL-6 were used to identity different subtypes of CAFs. Data in D and E were based on 10 fields at ×20 magnification (n = 10 per condition). Data presented as mean ± SD. **P < 0.01, ****P < 0.0001 by 1-way ANOVA with Dunnett’s multiple-comparison test (B, C, and E). Scale bars: 200 μm.
Figure 10
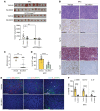
Figure 10. Hmga1 haploinsufficiency within the pancreatic ductal epithelium is sufficient to mitigate tumorigenesis and fibrotic stroma formation in KPC mice.
(A) Kaplan-Meier plot showing survival in KPC mice (n = 26, 11 males) compared to KPC with pancreatic ductal epithelial heterozygous Hmga1 deficiency, KPC/Hmga1fl/+ (n = 5, 3 males), or KPC mice with pancreas-specific homozygous Hmga1 deficiency KPC/Hmgafl/fl (n = 7, 5 males). Median survivals are indicated. (B) Representative images showing H&E (top row), HMGA1 (second row), FGF15 (third row), fibrosis (trichrome; fourth row), and Ki-67 (bottom row). Scale bars: 200 μm. (C) Comparison of stroma fibrosis scores in KPC models. (D) Comparison of Ki-67–positive cells in KPC models with or without pancreas-specific Hmga1 deficiency. (E) CAF composition and (F) representative IF images in KPC models with or without pancreas-specific Hmga1 deficiency. Total CAF number ascertained by costaining with DAPI and for PDPN; α-SMA, CD74, and IL-6 were used to identity percentages of total CAFs positive for each marker. In BF, data were based on 5 fields at ×20 magnification of tumors from 2 mice/genotype, n = 10 per condition. Data presented as mean ± SD from independent mice. **P < 0.01, ***P < 0.001, ****P < 0.0001 by log-rank (Mantel-Cox) test (A), 1-way ANOVA with Dunnett’s multiple-comparison test (C and D), or 2-tailed Student’s t test for α-SMA+ and CD74+ CAFs (data normally distributed) and Mann-Whitney test for IL-6+ CAFs (data not normally distributed) (E). Scale bars: 200 μm.
Figure 11
Figure 11. Overexpression of both HMGA1 and FGF19 in human PDAC defines a molecular subclass with extremely poor outcomes.
(A) HMGA1 and FGF19 mRNA levels in paired nonmalignant tissue (labeled normal) and primary PDAC tumors (GSE15471); n = 36 for PDAC tumors and n = 36 for nonmalignant tissue. (B) HMGA1 and FGF19 expression is positively correlated in PDAC tumors (GSE15471; n = 36). (C) Kaplan-Meier plot showing poor overall survival of PDAC patients with both high HMGA1 and FGF19 expression (red, n = 26), high HMGA1 and low FGF19 expression (green, n = 25), low HMGA1 and high FGF19 expression (blue, n = 25), and low HMGA1 and FGF19 expression (black, n = 26) from GSE21501. Data presented as mean ± SD. Significance was evaluated by 2-tailed Student’s t test (A), Pearson’s analysis (B), or log-rank (Mantel-Cox) test (C). ****P < 0.0001.
Figure 12
Figure 12. FGFR4 inhibition with BLU9931 decreases tumorigenesis and stroma formation in human PDAC orthotopic implants.
(A) Tumors (top) and volume comparisons (bottom) from orthotopic implantation of E3LZ10.7 cells in mice treated with BLU9931 or vehicle control. Data presented as mean ± SEM. (B) Representative images (n = 10 per condition) of tumors stained with H&E (top row) and for HMGA1 (second row), FGF19 (third row), fibrosis (trichrome; fourth row), and Ki-67 (bottom row) in E3LZ10.7 orthotopic implants of mice treated with BLU9931 or vehicle. (C) Comparison of stromal fibrosis scores in E3LZ10.7 orthotopic implants based on a 3-point system. (D) Comparison of Ki-67+ cells in E3LZ10.7 orthotopic implants of mice treated with BLU9931 or with vehicle control. (E) Representative IF images of CAFs in E3LZ10.7 orthotopic implants of mice treated with BLU9931 or with vehicle. (F) Comparison of CAFs in E3LZ10.7 orthotopic implants of mice treated with BLU9931 or vehicle. Total CAF number ascertained by costaining with DAPI and for PDPN; α-SMA, CD74, and IL-6 were used to identify percentage of total CAFs positive for each marker. Data in CD were based on 10 fields from 3 different mice/group at x20 magnification (n = 10/condition); data in E were based on 10 fields from 1 mouse/group at x20 magnification (n = 10/condition). Data presented as mean ± SD (C, D, and F). Significance was evaluated by Mann-Whitney test (A, C, and D) or 2-tailed Student’s t test for α-SMA+ and CD74+ CAFs (data normally distributed) and Mann-Whitney for IL-6+ CAFs (data not normally distributed) (F). **P < 0.01, ****P < 0.0001. Scale bars: 200 μm.
Figure 13
Figure 13. BLU9931 mitigates tumorigenesis and stroma formation in orthotopic implants from KPC PDAC cells.
(A) Tumors (top) and volume comparisons (bottom) from orthotopic implantation of KPC xenografts mice treated with BLU9931 or vehicle control. Data presented as mean ± SEM. (B) Representative images (n = 10 per condition) of tumors stained with H&E (top row) and for HMGA1 (second row), FGF15 (third row), fibrosis (trichrome, fourth row), and Ki-67 (fifth row) in KPC orthotopic implants of mice treated with BLU9931 or vehicle control. (C) Stromal fibrosis scores shown as violin plots in KPC orthotopic implants based on a 3-point system. (D) Comparison of Ki-67+ cells in KPC orthotopic implants of mice treated with BLU9931 or vehicle control. (E) Representative IF images of CAFs. (F) Comparison of CAFs in KPC orthotopic implants of mice treated with BLU9931 or vehicle control. Total CAF number ascertained by costaining with DAPI and for PDPN; α-SMA, CD74, and IL-6 were used to identify different subtypes of CAFs positive for each marker. Data in CD were based on 10 fields from 3 different mice/group at x20 magnification (n = 10/condition); data in E were based on 10 fields from 1 mouse/group at x20 magnification (n = 10/condition). Data presented as mean ± SD (C, D, and F). Significance was evaluated by Significance was evaluated by 1-way ANOVA with Tukey’s multiple-comparison test (A), Mann-Whitney test (C), 2-tailed Student’s t test (D), or 2-tailed Student’s t test for α-SMA+ and CD74+ CAFs (data normally distributed) and Mann-Whitney test for IL-6+ CAFs (data not normally distributed) (F). *P < 0.05, **P < 0.01, ***P < 0.001, ****P < 0.0001.

References

    1. Kleeff J, et al. Pancreatic cancer. Nat Rev Dis Primers. 2016;2:16022. doi: 10.1038/nrdp.2016.22. - DOI - PubMed
    1. Siegel RL, et al. Cancer statistics, 2020. CA Cancer J Clin. 2020;70(1):7–30. doi: 10.3322/caac.21590. - DOI - PubMed
    1. Wood LD, et al. Genetics of familial and sporadic pancreatic cancer. Gastroenterology. 2019;156(7):2041–2055. doi: 10.1053/j.gastro.2018.12.039. - DOI - PubMed
    1. Collisson EA, et al. Molecular subtypes of pancreatic cancer. Nat Rev Gastroenterol Hepatol. 2019;16(4):207–220. doi: 10.1038/s41575-019-0109-y. - DOI - PubMed
    1. Waddell N, et al. Whole genomes redefine the mutational landscape of pancreatic cancer. Nature. 2015;518(7540):495–501. doi: 10.1038/nature14169. - DOI - PMC - PubMed

Publication types