. 2023 Apr 15;12(4):bio059615.
doi: 10.1242/bio.059615. Epub 2023 Apr 6.

Metabolic shift towards oxidative phosphorylation reduces cell-density-induced cancer-stem-cell-like characteristics in prostate cancer in vitro

Affiliations

Metabolic shift towards oxidative phosphorylation reduces cell-density-induced cancer-stem-cell-like characteristics in prostate cancer in vitro

Hung Wei Lai et al. Biol Open. .

Abstract

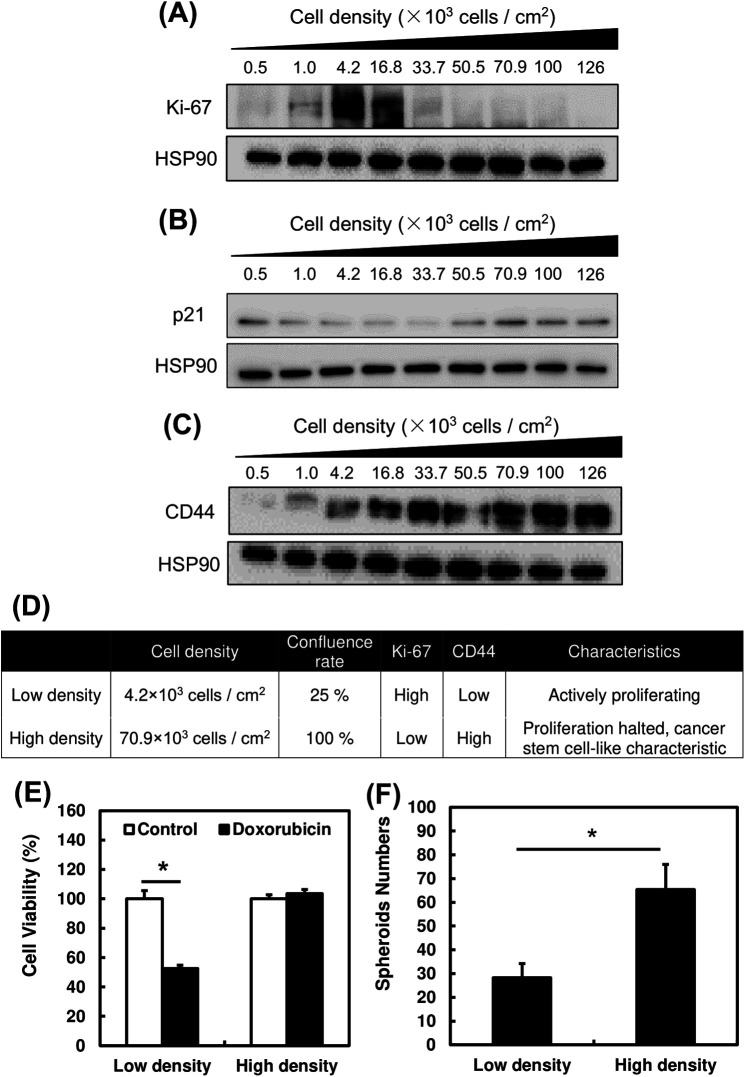
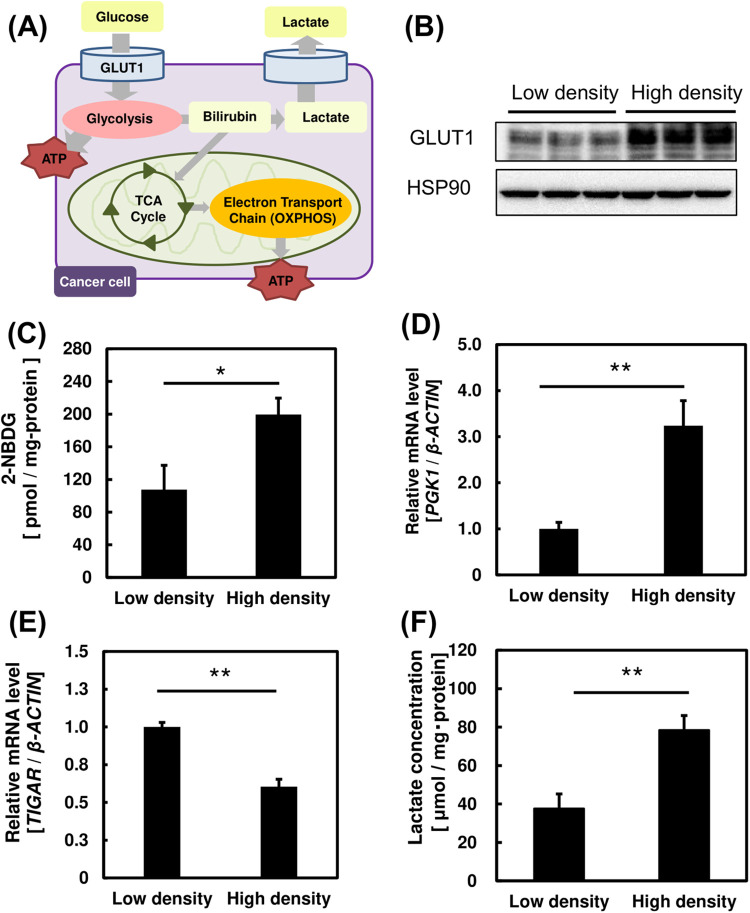
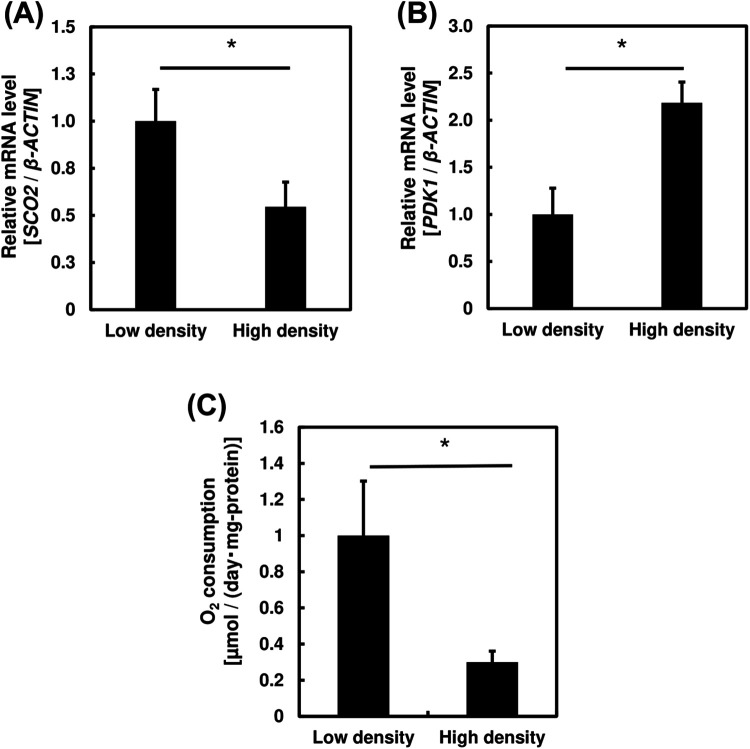
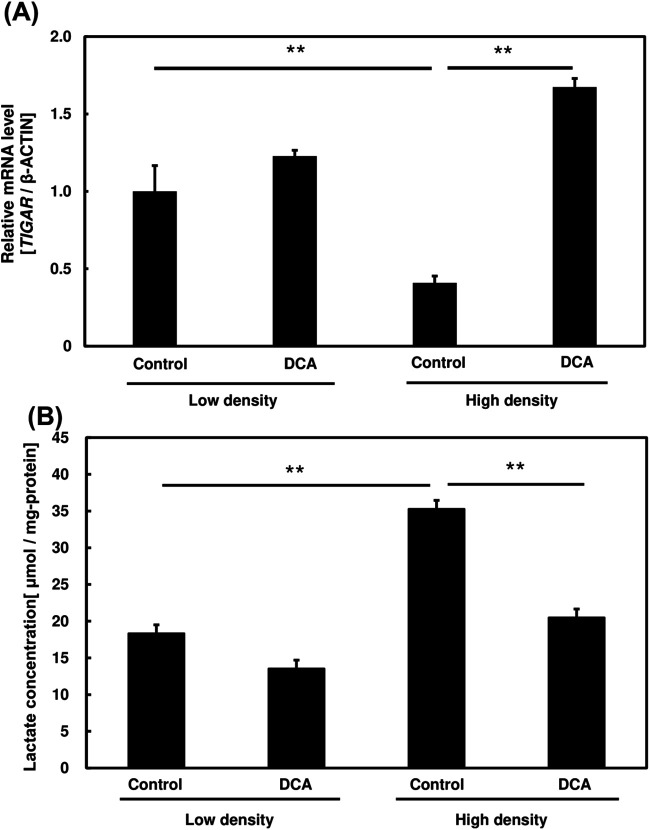
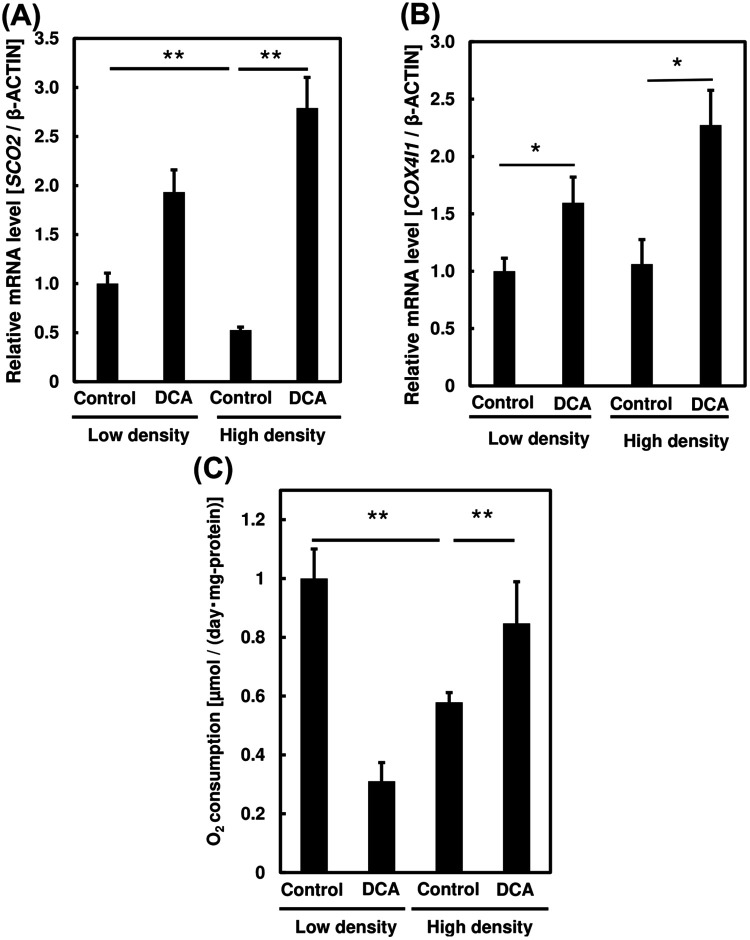
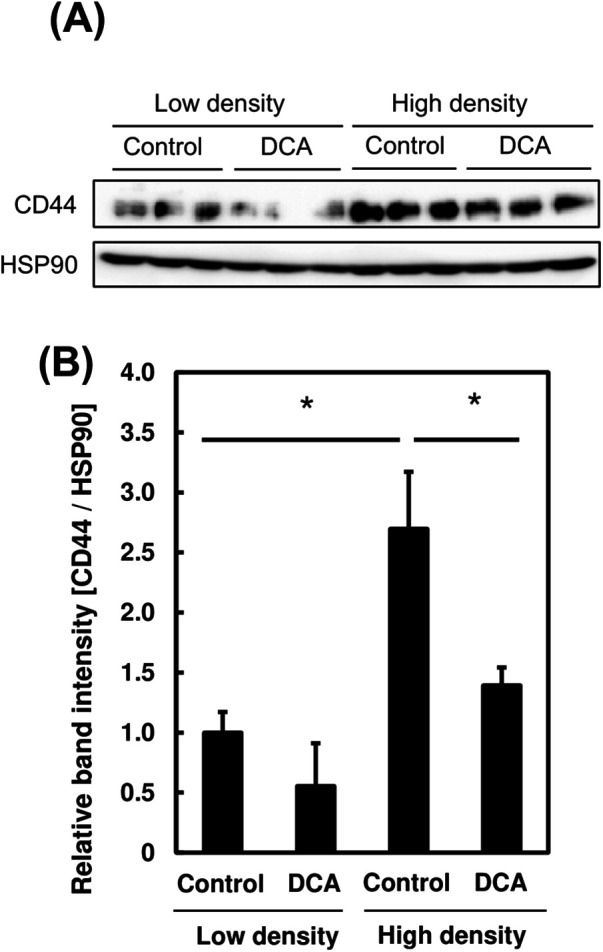
Numerous cancer patients undergoing conventional cancer therapies such as radiotherapy, chemotherapy and surgical tumour removal face relapses several years or even decades later. This may be due to the presence of cancer stem cells (CSCs) that survived said therapies. In this study, we aimed to uncover the relationship between cell density and CSCs, and the role of the Warburg effect in regulating CSC-like characteristics. A prostate cancer cell line, PC3, was used in this study. To investigate the Warburg effect effect and CSC-like characteristics in prostate cancer, we measured the expression levels of glycolysis and OXPHOS-related genes, and performed spheroid forming, cell viability and various glycolysis and OXPHOS-assays. We observed that increased cell density caused a metabolic shift from glycolysis to OXPHOS and higher CSC-like characteristics. However, the use of dichloroacetate (DCA), an inhibitor of the Warburg effect, significantly inhibited the cell-density-induced metabolic shift and CSC-like characteristics. Changes in cell density strongly influenced the preferred metabolic pathway of prostate cancer cells, regulating their CSC-like characteristics. It is possible that DCA, an inhibitor of the Warburg effect, could be a novel drug used to treat CSCs by distinguishing Warburg effect, preventing future cancer relapses.

Keywords: Cancer stem cell; Glycolysis; Oxidative phosphorylation; Prostate cancer; Warburg effect.


Conflict of interest statement

Competing interests The authors declare no competing or financial interests.

Figures

Fig. 1.
Fig. 1.
Microscopy images showing the morphological changes in PC3 cells when cultured at different cell densities. Scale bars: 500 uM.
Fig. 2.
Fig. 2.
Evaluation of cancer stem-like properties in PC3 cells at different cell densities. (A,B) Changes in protein expression levels of proliferation and cancer-stem-cell markers of cells incubated at different cell densities. (C) Table evaluating the confluence rate and characteristics of PC3 cells when incubated at high (70.9×10³ cells/cm2) and low (4.2×10³ cells/cm2) cell densities. (D) Cell viability of PC3 cells treated with doxorubicin at high and low cell density respectively. (E) Number of spheroids of PC3 cells grown in ultra-low adhesion dishes at high and low cell densities. A one-way ANOVA (Tukey's test) was performed for each data set to identify differences in mean values between treated and untreated samples; *P<0.05. n=3. Bars represent standard deviation (s.d.). Blots are cropped to ease visualization. Unprocessed original blot scans are shown in Fig. S1.
Fig. 3.
Fig. 3.
Changes in glycolytic metabolism in PC3 cells at high and low cell density. (A) Schematic illustration showing the energy metabolism in cancer cells. (B) Protein expression level of glucose transporter 1 (GLUT1) when incubated at high and low cell density tested by western blotting. (C-E) Bar graphs showing 2-NBDG concentration in PC3 cells grown at high and low cell densities (C); mRNA expression levels of the glycolysis-related gene, PGK1 (D), and glycolysis inhibitory gene, TIGAR, at high and low cell densities (E). (F) Bar graph showing lactate production of PC3 cells grown at high and low cell densities. A one-way ANOVA (Tukey's test) was used for each data set to calculate differences in mean values between treated and untreated samples; *P<0.05; **P<0.01. n=3. Bars represent standard deviation (s.d.). Blots are cropped to ease visualization. Unprocessed original scans of blots are shown in Fig. S2.
Fig. 4.
Fig. 4.
Bar graphs showing effect of cell density on oxidative phosphorylation in PC3 cells. (A) mRNA expression levels of the oxidative phosphorylation-related gene, SCO2, in cells incubated at high and low cell densities. (B) mRNA expression levels of the oxidative phosphorylation inhibitory gene, PDK1, in cells when incubated at high and low cell density. (C) Oxygen consumption of PC3 cells when incubated at high and low cell density. One-way ANOVA (Tukey's test) was used to calculate differences in mean values between treated and untreated samples; *P<0.05; **P<0.01. n=3. Bars represent standard deviation (s.d.).
Fig. 5.
Fig. 5.
Effect of dichloroacetate (DCA) addition on glycolytic pathways in PC3 cells at different cell densities. (A) mRNA expression levels of the glycolysis inhibitory gene, TIGAR, in cells incubated at high and low density in the presence or absence of DCA. (B) Lactate production of PC3 cells treated with or without DCA. One-way ANOVA (Tukey's test) was used to calculate differences in mean values between treated and untreated samples; **P<0.01. n=3. Bars represent standard deviation (s.d.).
Fig. 6.
Fig. 6.
Effect of dichloroacetate (DCA) addition on oxidative phosphorylation in PC3 cells. mRNA expression levels of the oxidative phosphorylation-related genes, (A) SCO2, and (B) COX4I1, following DCA addition in cells incubated at high and low density. (C) Oxygen consumption of PC3 cells following DCA addition in cells incubated at high and low density. One-way ANOVA (Tukey's test) was used to calculate differences in mean values between treated and untreated samples; *P<0.05; **P<0.01. n=3. Bars represent standard deviation (s.d.).
Fig. 7.
Fig. 7.
Changes in energy metabolism in PC3 cells after dichloroacetate (DCA) addition at high and low cell density. (A) Lactate production of PC3 cells grown at high and low density. (B) Oxygen consumption of PC3 cells at high and low cell density. (C,D) Changes in protein expression level of cancer stem cell markers in the presence or absence of DCA at high and low cell density. One-way ANOVA (Tukey's test) was used to calculate differences in mean values between treated and untreated samples; *P<0.05. n=3. Bars represent standard deviation (s.d.). Blots are cropped to ease visualization. Unprocessed original scans of blots are shown in Fig. S3.

Similar articles

Cited by

References

    1. Aguirre-Ghiso, J. A. (2007). Models, mechanisms and clinical evidence for cancer dormancy. Nat. Rev. Cancer 7, 834-846. 10.1038/nrc2256 - DOI - PMC - PubMed
    1. Atas, E., Oberhuber, M. and Kenner, L. (2020). The implications of PDK1–4 on tumor energy metabolism, aggressiveness and therapy resistance. Front. Oncol. 10, 583217. 10.3389/fonc.2020.583217 - DOI - PMC - PubMed
    1. Atashzar, M. R., Baharlou, R., Karami, J., Abdollahi, H., Rezaei, R., Pourramezan, F. and Zoljalali Moghaddam, S. H. (2020). Cancer stem cells: a review from origin to therapeutic implications. J. Cell. Physiol. 235, 790-803. 10.1002/jcp.29044 - DOI - PubMed
    1. Bahmad, H. F., Cheaito, K., Chalhoub, R. M., Hadadeh, O., Monzer, A., Ballout, F., El-Hajj, A., Mukherji, D., Liu, Y. N., Daoud, G.et al. (2018). Sphere-formation assay: three-dimensional in vitro culturing of prostate cancer stem/progenitor sphere-forming cells. Front. Oncol. 8, 347. 10.3389/fonc.2018.00347 - DOI - PMC - PubMed
    1. Bensaad, K., Tsuruta, A., Selak, M. A., Vidal, M. N. C., Nakano, K., Bartrons, R., Gottlieb, E. and Vousden, K. H. (2006). TIGAR, a p53-inducible regulator of glycolysis and apoptosis. Cell 126, 107-120. 10.1016/j.cell.2006.05.036 - DOI - PubMed

Publication types