A methylation clock model of mild SARS-CoV-2 infection provides insight into immune dysregulation
- PMID: 36919946
- PMCID: PMC10167476
- DOI: 10.15252/msb.202211361
A methylation clock model of mild SARS-CoV-2 infection provides insight into immune dysregulation
Abstract
DNA methylation comprises a cumulative record of lifetime exposures superimposed on genetically determined markers. Little is known about methylation dynamics in humans following an acute perturbation, such as infection. We characterized the temporal trajectory of blood epigenetic remodeling in 133 participants in a prospective study of young adults before, during, and after asymptomatic and mildly symptomatic SARS-CoV-2 infection. The differential methylation caused by asymptomatic or mildly symptomatic infections was indistinguishable. While differential gene expression largely returned to baseline levels after the virus became undetectable, some differentially methylated sites persisted for months of follow-up, with a pattern resembling autoimmune or inflammatory disease. We leveraged these responses to construct methylation-based machine learning models that distinguished samples from pre-, during-, and postinfection time periods, and quantitatively predicted the time since infection. The clinical trajectory in the young adults and in a diverse cohort with more severe outcomes was predicted by the similarity of methylation before or early after SARS-CoV-2 infection to the model-defined postinfection state. Unlike the phenomenon of trained immunity, the postacute SARS-CoV-2 epigenetic landscape we identify is antiprotective.
Keywords: DNA methylation; SARS-CoV-2; machine learning model; temporal dynamics; trained immunity.
© 2023 The Authors. Published under the terms of the CC BY 4.0 license.
Conflict of interest statement
SG reports past consultancy or advisory roles for Merck and OncoMed; research funding from Boehringer Ingelheim, Bristol Myers Squibb, Celgene, Genentech, Janssen R&D, Pfizer, Regeneron Pharmaceuticals, and Takeda. SCS is a founder of GNOMX, Corp. Other authors declare that they have no conflict of interest. The views expressed in this article are those of the authors and do not necessarily reflect the official policy or position of the Department of the Navy, Department of Defense, nor the US Government. AGL, CWG, and DLW are a military service member or employee of the US Government. This work was prepared as part of their official duties. Title 17, U.S.C., §105 provides that copyright protection under this title is not available for any work of the US Government. Title 17, U.S.C., §101 defines a US Government work as a work prepared by a military service member or employee of the US Government as part of that person's official duties.
Figures

- A
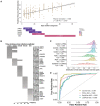
Schematic of the SARS‐CoV‐2 study design and alignment of human subjects by infection timing. Examples of 3 subject trajectories are shown arranged by study time (top) and infection pseudotime, aligned by diagnosis (bottom).
- B
Number of DMS or DEG in each pseudotime period vs. preinfection controls (nominal P < 10−4). Numbers were either corrected for cell‐type proportions or uncorrected. See Fig EV2.
- C
Scatter plots of differential methylation at the sites in (B) for asymptomatic (n = 68) vs. mild (n = 65) infections. For each differential contrast, we first selected DMS in Fig 1B (all subjects) that were also differentially methylated (FDR < 0.05) within symptomatic or asymptomatic groups. See Fig EV2B.
- D
Principal component analysis of the Mid vs. Control DEG or DMS (with FDR < 0.05 and fold change > 1.5 for DEG) at all time periods. Other DMS, are DMS that do not map to a DEG. We note that for gene expression, Post time points are very close to Control, while this is not the case for methylation. Moreover, the pattern is similar for DEG‐associated and other differential probes.
- E
Scatter plots of differential expression (log2 fold change) or methylation (normalized delta beta) at the indicated periods for the DEG and DMS in (D). Performed assays were RNA‐seq and methylation microarray, and the limma method was applied for differential analysis of either dataset.


The number of differentially expressed genes (DEG) and differentially methylated sites (DMS) during each infection period compared with preinfection levels (uncorrected P < 1e−4) are plotted separately by direction of regulation. Analysis corrected for cell‐type proportions and uncorrected are shown separately.
Scatter plots comparing the changes in methylation levels compared with control following asymptomatic (n = 68) and mildly symptomatic (n = 65) infections for the First and Mid time period. These plots correspond to the same analysis shown for EarlyPost and LatePost in Fig 1C.
Principal component analysis of the Mid vs. Control DEG or DMS (with FDR < 0.05 and fold change > 1.5 for DEG) at all time periods. Other DMS, unannotated DMS. These plots correspond to Fig 1D.

Z‐scored levels at DMS clustered by temporal trajectory relative to the first PCR‐positive test. Plotted is the average of each cluster over time.
Enrichment of TFBS by cluster within a 200‐bp window centered at each DMS.
Top five pathways showing enrichment of DMS‐associated genes in each cluster. (B, C) FDR < 0.05 for at least one cluster. Fold = fold enrichment.

Schematic showing the features evaluated by enrichment analysis for association with postinfection hypomethylated sites in each DMS cluster from Fig 2.
Correlation of DMS in each cluster with Blueprint cell‐type methylation markers. (See Materials and Methods).
Enrichment analysis with respect to the Pearson correlations of DMS in each cluster with inferred cell‐type proportions. Fold enrichment for each cluster is indicated in comparison with all clusters (see Materials and Methods).
Enrichment analysis showing the top five enriched cell markers from single‐cell RNA‐seq for DMS in each cluster. Cell markers with FDR < 0.05 are highlighted.
Enrichment analysis for CpG island categories. Results with FDR < 0.05 are highlighted.
Enrichment analysis for gene region feature categories. Results with FDR < 0.05 are highlighted.
Enrichment analysis of gene region feature categories aggregated into promoter region (TSS1500, TSS200, 1st Exon, 5'UTR) and gene body (3'UTR, Body, ExonBnd). IGR is also included. Results with FDR < 0.05 are highlighted.
Enrichment analysis of CG and GC content categories. Results with FDR < 0.05 are highlighted.
Enrichment analysis of distance to transcription start site (TSS). Results with FDR < 0.05 are highlighted.

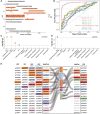
Top, Regression model predicting time since infection. Bottom, Correlation and significance of models restricted to shorter time windows. The results shown were trained with mean squared error but are depicted as a correlation plot to facilitate interpretation.
Comparison of the 10 most frequently utilized sites when regression models are repeatedly generated for each time window.
Accuracy of binary blood methylation classification models as the AUC, in distinguishing samples from preinfection, infection, and postinfection pseudotime periods.
Accuracy of blood methylation multiclass classifier in classifying samples from time periods relative to infection.

Schematic of the processing pipeline used for RNA‐Seq data normalization.
Schematic of the processing pipeline used for Methylation data normalization.
Schematic of the procedure utilized for nested cross‐validation of all machine learning models generated. The left panel indicates one outer iteration for developing the model M built from the training set. The right side gives the data summary derived from all outer iterations.

- A
Performance of a binary classifier trained to distinguish postinfection (EarlyPost or LatePost) vs. controls in other datasets. * marks current study datasets. “SARS‐CoV‐2 Sero− vs. Sero+”: retrospective study dataset of Marine recruits exposed during late March‐early April 2020, assayed for blood DNA methylation in mid‐July, and distinguished by SARS‐CoV‐2 serology status. “Arrival at Quarantine vs. Later”: PCR‐negative study participants upon arrival vs. later during training. See Materials and Methods for details.
- B
Receiver operator curve and significance of AUC for datasets showing FDR < 0.05 in panel (A).
- C, D
Enrichment of 20 most significantly hypomethylated DMS ranked by absolute delta beta values relative to top hypomethylated DMS in EarlyPost (C) or LatePost (D) vs. Control.
- E
Top‐ranked hypomethylated DMS upon SARS‐CoV‐2 infection compared with other diseases showing enrichment in (C, D). Sites identified both in the SARS‐CoV‐2 study and at least one other condition are highlighted. Light gray sites were ranked in this study but not assayed in other studies. Gene annotations are indicated.

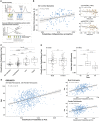
Schematic illustration of the trained immunity phenomenon and expectations of possible protective and antiprotective effects of the post‐SARS‐CoV‐2 methylation state.
Correlation between maximum relative viral level during infection and the probabilities of misclassification as EarlyPost (Left) using the multiclassifier model (see Fig 3D); correlation of two hypomethylated IFI44L sites with viral load (Right). A.U., arbitrary units, calculated as 80‐(minimum cycle threshold PCR result) for each participant. See Fig EV5B for plots of the correlation of misclassification probabilities for the other infection periods.
Postinfection‐like state is significantly associated with negative outcomes following SARS‐CoV‐2 infection in an older cohort with severe outcomes. As infection outcomes and postinfection probabilities (see panel E) are both associated with age, age was regressed out from the input methylation data for this analysis, showing these results are independent of subject age. The boxplot displays the 25th, 50th, and 75th percentiles, with whiskers that extend up to 1.5 times the interquartile range or the range of the data, whichever is smaller. P‐values are from the Wilcoxon rank‐sum test.
There is no significant difference comparing samples following BCG vaccination of human subjects or BCG stimulation in vitro with respect to the model prediction probabilities as post‐SARS‐CoV‐2 infection. The boxplot displays the 25th, 50th, and 75th percentiles, with whiskers that extend up to 1.5 times the interquartile range or the range of the data, whichever is smaller. P‐values are from the Wilcoxon rank‐sum test.
Applying the multiclass classifier on a reference methylation cohort shows a strong positive correlation between age and prediction probabilities as Post. Results are comparable in males and females.

Prediction probabilities generated by the multiclass classifier for all control samples are shown by bar plots. The results are in increasing order of the prediction probability obtained that each control sample is LatePost.
Correlation plot of maximum relative viral levels measured during infection with the probabilities of misclassification as PCR‐positive or LatePost using the classifier from Fig 3D of the control samples prior to infection from the same participants. A.U., arbitrary units calculated as 80‐(minimum cycle threshold PCR result) for each participant.
References
-
- Behrens L, Cherry JD, Heininger U, Swiss Measles Immune Amnesia Study Group (2020) The susceptibility to other infectious diseases following measles during a three year observation period in Switzerland. Pediatr Infect Dis J 39: 478–482 - PubMed
Publication types
MeSH terms
Associated data
- Actions
- Actions
Grants and funding
LinkOut - more resources
Full Text Sources
Other Literature Sources
Medical
Molecular Biology Databases
Miscellaneous

