. 2023 May 1;34(5):ar41.
doi: 10.1091/mbc.E22-04-0119. Epub 2023 Mar 15.

F-actin-rich territories coordinate apoptosome assembly and caspase activation during DNA damage-induced intrinsic apoptosis

Affiliations

F-actin-rich territories coordinate apoptosome assembly and caspase activation during DNA damage-induced intrinsic apoptosis

Virginia L King et al. Mol Biol Cell. .

Abstract

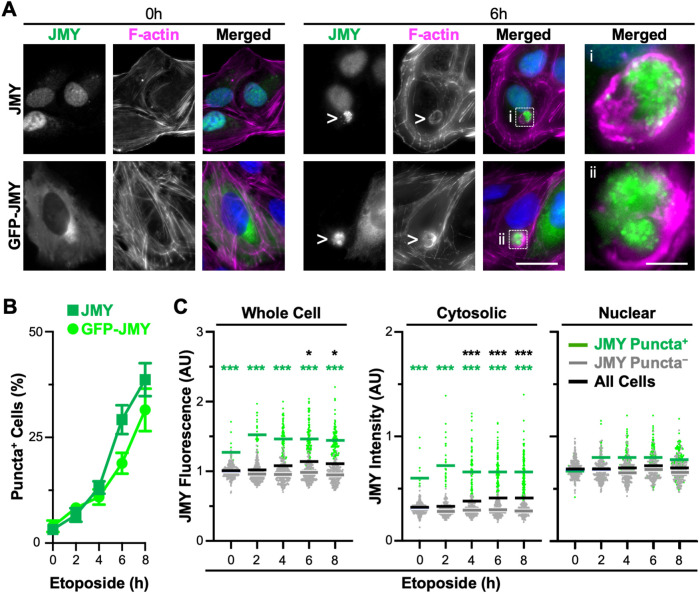
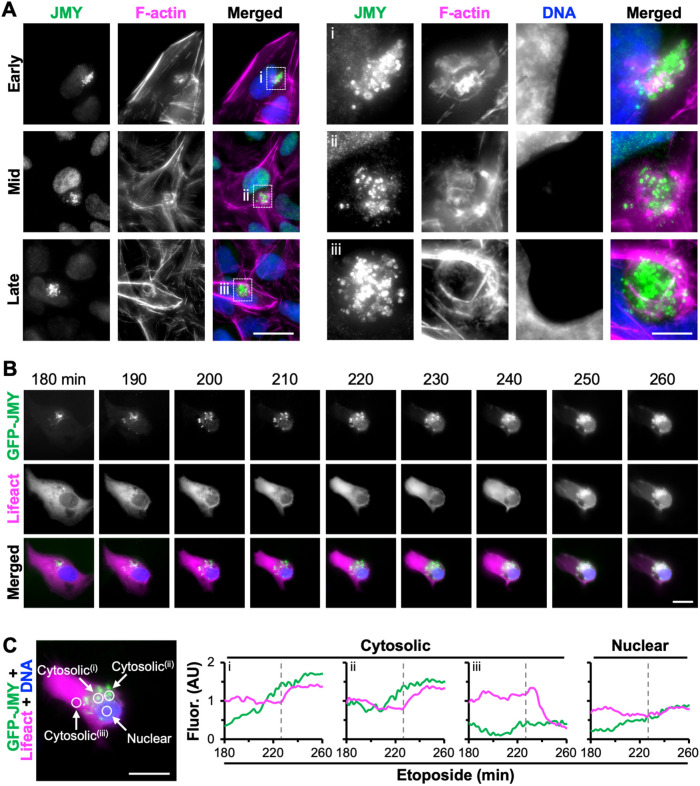
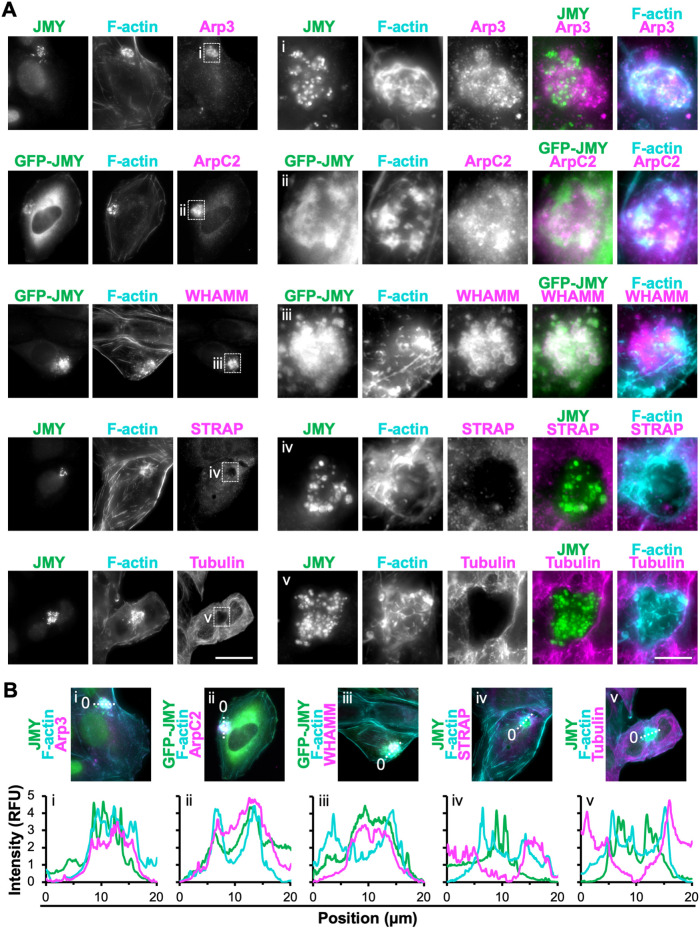
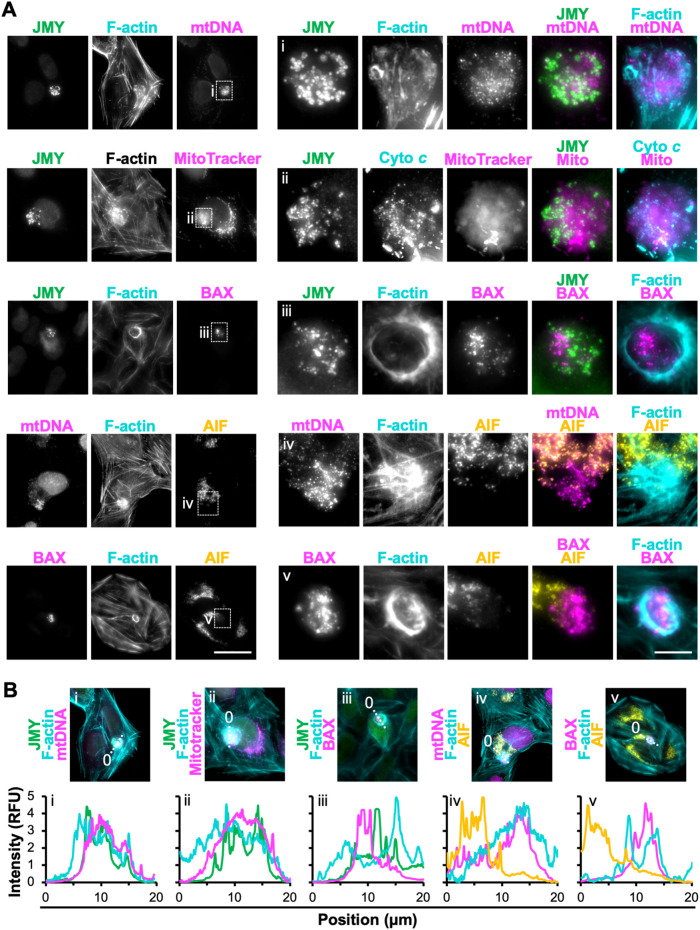
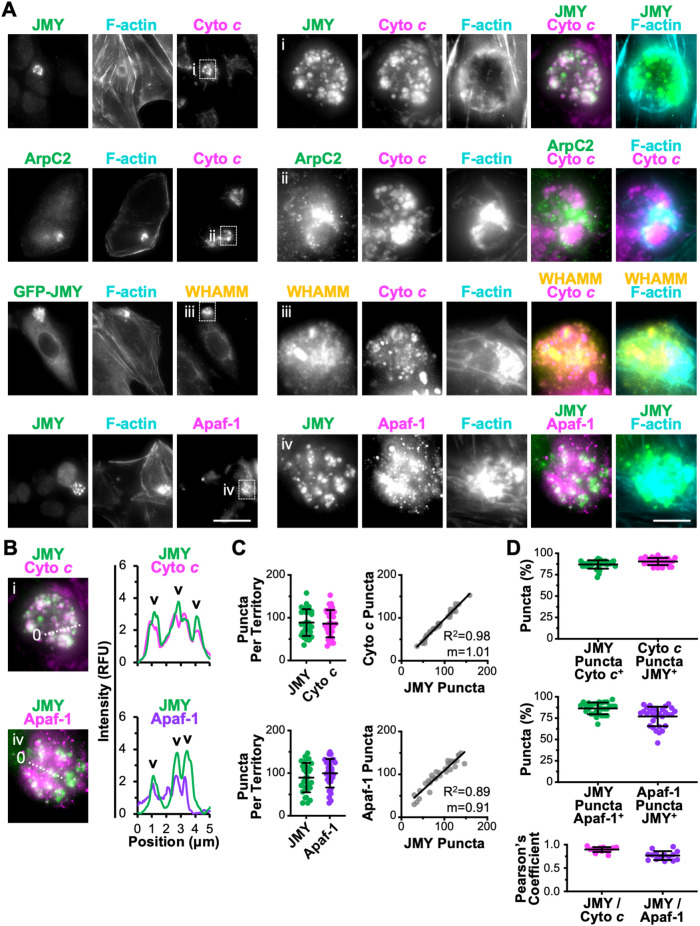
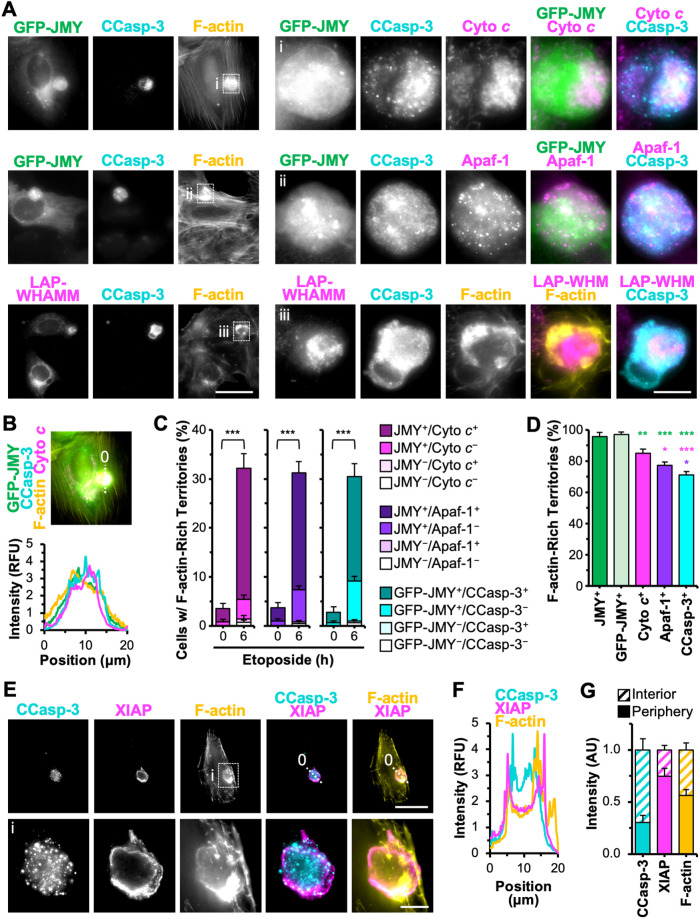
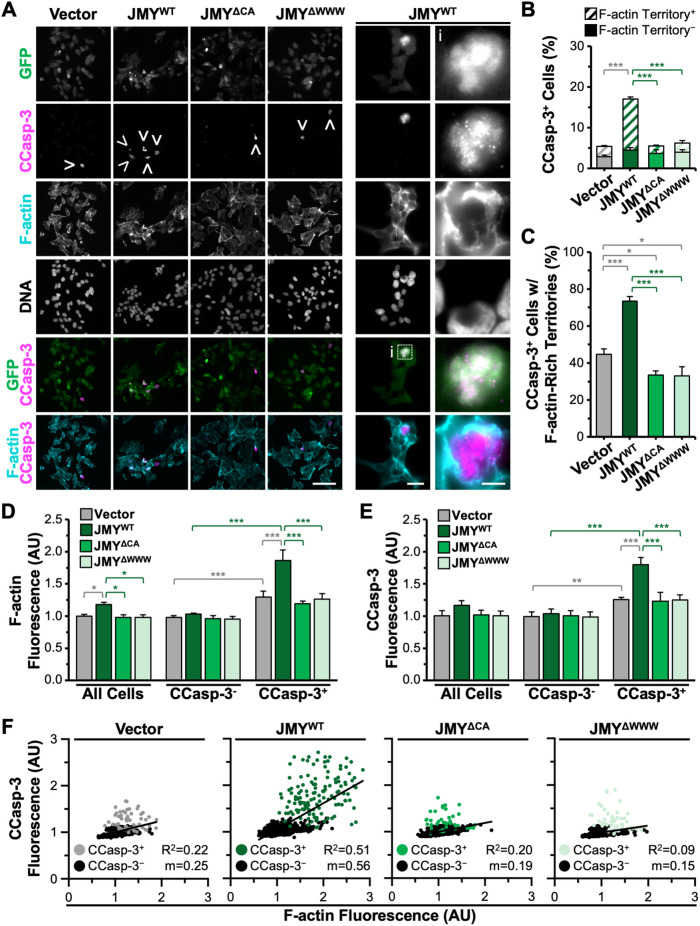
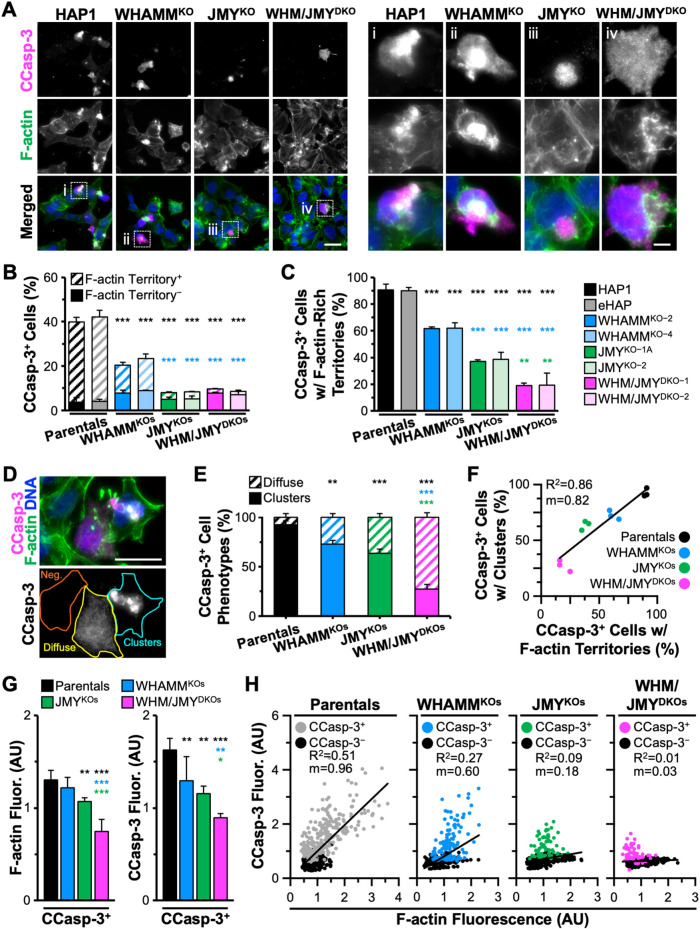
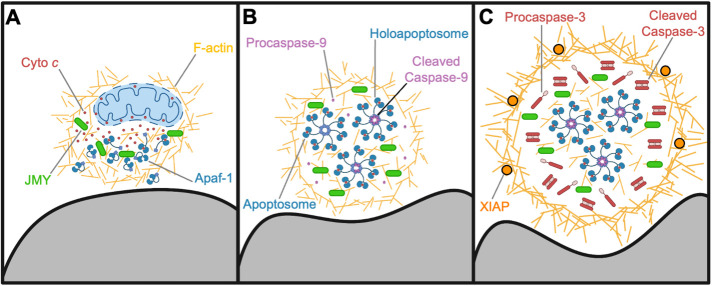
The actin cytoskeleton is a ubiquitous participant in cellular functions that maintain viability, but how it controls programmed cell death is not well understood. Here we show that in response to DNA damage, human cells form a juxtanuclear F-actin-rich territory that coordinates the organized progression of apoptosome assembly to caspase activation. This cytoskeletal compartment is created by the actin nucleation factors JMY, WHAMM, and the Arp2/3 complex, and it excludes proteins that inhibit JMY and WHAMM activity. Within the territory, mitochondria undergo outer membrane permeabilization and JMY localization overlaps with punctate structures containing the core apoptosome components cytochrome c and Apaf-1. The F-actin-rich area also encompasses initiator caspase-9 and clusters of a cleaved form of executioner caspase-3 but restricts accessibility of the caspase inhibitor XIAP. The clustering and potency of caspase-3 activation are positively regulated by the amount of actin polymerized by JMY and WHAMM. These results indicate that JMY-mediated actin reorganization functions in apoptotic signaling by coupling the biogenesis of apoptosomes to the localized processing of caspases.


Figures

FIGURE 1:
FIGURE 1:
JMY forms cytosolic puncta within juxtanuclear F-actin–rich territories during DNA damage–induced apoptosis. (A) U2OS cells were treated with 10 μM etoposide for 0–8 h before being fixed and stained with a JMY antibody to visualize endogenous JMY (green), phalloidin to visualize F-actin (magenta), and DAPI to detect DNA (blue). U2OS cells encoding GFP-JMY (green) were also stained with phalloidin and DAPI. Arrowheads and magnifications (i, ii) highlight examples of cytosolic JMY puncta. Scale bars: 25, 5 μm. (B) The percentage of cells with JMY or GFP-JMY puncta was calculated. Each point represents the mean ± SD from three experiments (n = 2084–3044 cells per point). (C) Whole cell, cytosolic, and nuclear JMY fluorescence values were measured in ImageJ. Each point represents one cell (n = 310–348 per timepoint), where green points are JMY puncta–positive cells and gray points are JMY puncta–negative cells. Green, gray, and black bars are the mean values for the positive, negative, and total populations, each from three experiments. Green significance stars refer to comparisons of the puncta-positive to puncta-negative population. Black stars refer to comparisons of the total population at each timepoint to the 0 h timepoint. AU = arbitrary units. *p < 0.05; ***p < 0.001 (ANOVA, Tukey post-hoc tests).
FIGURE 2:
FIGURE 2:
JMY forms cytosolic puncta before the assembly of juxtanuclear F-actin–rich territories. (A) U2OS cells were treated with 10 μM etoposide before being fixed and stained with a JMY antibody (green), phalloidin to visualize F-actin (magenta), and DAPI to detect DNA (blue). Images represent early-, mid-, and late-stage F-actin–rich territories. Magnifications (i–iii) highlight examples of JMY-associated territories. Scale bars: 25, 5 μm. (B) U2OS cells encoding GFP-JMY (green) and transiently expressing Lifeact-mCherry (magenta) were treated with etoposide for 3 h before incubation with Hoescht to visualize DNA (blue). Selected frames (taken from Supplemental Video S1) show the formation of punctate GFP-JMY structures and an F-actin–rich territory. Scale bar: 20 μm. (C) Circles (5 μm diameter) were drawn within a cytosolic region containing punctate GFP-JMY (i and ii), a cytosolic region without GFP-JMY puncta (iii), or the nucleus, and the pixel intensity profiles for GFP-JMY and Lifeact-mCherry were measured. Dashed gray lines show the time when F-actin territory formation begins.
FIGURE 3:
FIGURE 3:
Subset of actin nucleation and branching factors present within apoptotic F-actin–rich territories. (A) U2OS cells (rows 1, 4, and 5) or U2OS cells encoding GFP-JMY (rows 2 and 3; green) were treated with etoposide for 6 h, fixed, and stained with antibodies to JMY (rows 1, 4, and 5; green), antibodies to Arp3, ArpC2, WHAMM, STRAP, or tubulin (magenta), and with phalloidin (F-actin; cyan). Magnifications (i–iii) depict clusters of JMY and other nucleation factors in F-actin territories. Magnifications (iv and v) depict territories that exclude STRAP and tubulin. Scale bars: 25, 5 μm. (B) Lines (20 μm) were drawn through the images in A to measure the pixel intensity profiles. RFU = relative fluorescence units. See Supplemental Figure S3 for nucleation factors that were not enriched within F-actin territories.
FIGURE 4:
FIGURE 4:
Permeabilized mitochondria located within F-actin–rich territories. (A) U2OS cells were treated with etoposide for 6 h, fixed, and stained with antibodies to JMY (green), mitochondrial DNA (mtDNA; magenta), BAX (magenta), and AIF (yellow) and with phalloidin (F-actin; cyan). In row 2, MitoTracker Red (magenta) was added before fixation. Scale bars: 25, 5 μm. (B) Lines (20 μm) were drawn through the images in A to measure the pixel intensity profiles. RFU = relative fluorescence units.
FIGURE 5:
FIGURE 5:
Apoptosome components cyto c and Apaf-1 clustered within F-actin–rich territories. (A) U2OS cells (rows 1, 2, and 4) or U2OS cells encoding GFP-JMY (row 3; green) were treated with etoposide for 6 h, fixed, and stained with antibodies to JMY (rows 1, 2, and 4; green), cyto c or Apaf-1 (magenta), and/or WHAMM (yellow) and with phalloidin (F-actin; cyan). Magnifications (i–iv) depict JMY, WHAMM, cyto c, and Apaf-1 within F-actin territories. Scale bars: 25, 5 μm. (B) Lines (5 μm) were drawn through the magnified images in i and iv to measure the pixel intensity profiles. Arrowheads highlight examples of cytosolic cyto c or Apaf-1 puncta that overlap with JMY puncta. (C) For quantification of A, the JMY and cyto c or Apaf-1 puncta were counted per territory. Each point represents one cell (n = 30). The numbers of cyto c or Apaf-1 puncta per territory were plotted against the number of JMY puncta per territory. The slopes (m) in the linear trendline equations for cyto c (Y = 1.01X – 3.61) and Apaf-1 (Y = 0.91X + 18.02) were significantly nonzero (p < 0.001). (D) Quantifications show the percentage of JMY puncta per territory that overlapped with cyto c or Apaf-1 puncta (cyto c or Apaf-1 positive) and the percentage of cyto c or Apaf-1 puncta per territory that overlapped with JMY puncta (JMY-positive). The Pearson’s correlation coefficient for JMY with cyto c or Apaf-1 was calculated for puncta within territories. Each point represents the coefficient within a single territory (n = 15). Pearson’s coefficient for JMY/cyto c (0.90 ± 0.05) was significantly different from that for JMY/mtDNA (0.05 ± 0.04), and Pearson’s coefficient for JMY/Apaf-1 (0.77 ± 0.09) was significantly different from that for JMY/mtDNA (0.06 ± 0.04), p < 0.001 (t tests). See Supplemental Figure S4 for other factors that were not enriched in F-actin territories.
FIGURE 6:
FIGURE 6:
Active executioner caspase-3 concentrated within apoptosome-containing, F-actin–rich territories. (A) U2OS cells expressing GFP-JMY (green) or transfected with a plasmid encoding LAP-WHAMM (magenta) were treated with etoposide for 6 h, fixed, and stained with an antibody that recognizes CCasp-3 at Asp175 (cyan), with antibodies against cyto c or Apaf-1 (magenta), and with phalloidin (F-actin; yellow). Magnifications (i–iii) depict GFP-JMY, cyto c, Apaf-1, CCasp-3, and LAP-WHAMM within F-actin territories. Scale bars: 25, 5 μm. (B) A 20 μm line was drawn through an image from A to measure the pixel intensity profiles for GFP-JMY, CCasp-3, F-actin, and cyto c. (C, D) U2OS cells or U2OS cells expressing GFP-JMY were untreated or treated with etoposide, fixed, and stained with antibodies against JMY and cyto c, JMY and Apaf-1, or CCasp-3, all in conjunction with phalloidin. The percentage of cells harboring F-actin–rich territories containing JMY, GFP-JMY, cyto c, or Apaf-1 puncta or with CCasp-3 clusters was quantified. In C, the fractions of F-actin–rich territories that were doubly positive, singly positive, or doubly negative are shown. Each bar represents the mean ± SD from three experiments (n = 504–638 cells per bar). ***p < 0.001 (t tests). In D, each bar represents the mean ± SD from three experiments (n = 182–195 territories per bar). Green, magenta, and purple significance stars refer to comparisons to the JMY+ bar, cyto c+ bar, and Apaf-1+ bar, respectively. (E) U2OS cells were treated with etoposide, fixed, and stained with antibodies to CCasp-3 (cyan) and XIAP (magenta) and with phalloidin (F-actin; yellow). Magnifications (i) depict F-actin territories surrounded by XIAP. Scale bars: 25, 5 μm. (F) A 20 μm line was drawn through the image in E to measure the pixel intensity profiles for CCasp-3, XIAP, and F-actin. (G) CCasp-3, XIAP, and F-actin fluorescence intensities were measured in the whole territory as well as the interior and peripheral portions (n = 15 territories). *p < 0.05; **p < 0.01; ***p < 0.001 (ANOVA, Tukey post-hoc tests).
FIGURE 7:
FIGURE 7:
Localized activation of caspase-3 is controlled by JMY-dependent actin polymerization. (A) JMYKO cells encoding GFP (vector) or GFP-tagged JMY constructs (JMYWT, JMYΔCA, JMYΔWWW; green) were treated with etoposide for 5 h, fixed, and stained with an antibody to visualize CCasp-3 (magenta), phalloidin (F-actin; cyan), and DAPI to detect DNA. Arrowheads highlight examples of CCasp-3 staining, and magnifications (i) depict GFP-JMYWT and CCasp-3 surrounded by F-actin. Scale bars: 100, 25, 5 μm. (B) The percentage of cells with CCasp-3 staining was quantified and is displayed as the fraction of CCasp-3–positive cells that were (Territory+) or were not (Territory-) associated with F-actin. Each bar represents the mean ± SD from three experiments (n = 3447–6083 cells analyzed per construct). Gray significance stars refer to comparisons to the vector bar, and green significance stars are comparisons to the JMYWT bar. (C) The percentage of cells with CCasp-3 staining associated with F-actin was quantified from B. Each bar is the mean ± SD from three experiments (n = 1038 cells for WT and 190–230 for vector and mutant samples). (D, E) Whole cell fluorescence values for F-actin and CCasp-3 were measured, and the mean value for the vector sample was set to 1. Each bar is the mean ± SD from three experiments (n = 592–816 cells per sample). (F) Whole cell fluorescence values for F-actin and CCasp-3 were plotted against one another. Each point represents one cell (n = 592–816 cells per sample), where gray/green points are CCasp-3–positive cells and black points are CCasp-3–negative cells. The slopes (m) in the linear trendline regression equations for the total cell populations (vector: Y = 0.25X + 0.75; JMYWT: Y = 0.56X + 0.49; JMYΔCA: Y = 0.19X + 0.81; JMYΔWWW: Y = 0.15X + 0.84) were significantly nonzero (p < 0.001). *p < 0.05; **p < 0.01; ***p < 0.001 (ANOVA, Tukey post-hoc tests).
FIGURE 8:
FIGURE 8:
Amount of F-actin encompassing the caspase activation clusters enhanced by WHAMM. (A) Parental (HAP1, eHAP), WHAMMKO (WHAMMKO-2, WHAMMKO-4), JMYKO (JMYKO-1A, JMYKO-2), and WHAMM/JMYDKO (WHM/JMYDKO-1, WHM/JMYDKO-2) cells were treated with 5 μM etoposide for 6 h before fixing and staining with an antibody to visualize CCasp-3 (magenta), phalloidin (F-actin; green), and DAPI (blue). Magnifications (i–iv) show examples of CCasp-3 staining. Scale bars: 25, 5 μm. (B) The percentage of cells with CCasp-3 staining was quantified and is displayed as the fraction of CCasp-3–positive cells that were (Territory+) or were not (Territory-) associated with F-actin–rich territories. Each bar represents the mean ± SD from three experiments (n = 246–438 cells analyzed per bar). Black significance stars refer to comparisons to the parental bars, and blue significance stars are comparisons to the WHAMMKO bars. (C) The percentage of CCasp-3–positive cells with F-actin–rich territories is displayed. Each bar represents the mean ± SD from three experiments (n = 104–106 cells for parental bars; 66–73 cells for WHAMMKO bars; and 31–36 cells for JMYKO or WHM/JMYDKO bars). Black significance stars are comparisons to the parental bars, blue significance stars are to the WHAMMKO, and green significance stars are to the JMYKO. (D) A representative image of JMYKO cells highlights cells that are CCasp-3 negative (orange), CCasp-3 positive but diffuse (yellow), or CCasp-3 positive in clusters (cyan). Scale bar: 25 μm. (E) The percentage of CCasp-3–positive cells with clustered or diffuse phenotypes was quantified. Each bar represents the mean ± SD from three experiments (n = 63–98 cells per bar). (F) The percentage of CCasp-3–positive cells with a clustered phenotype was plotted against the percentage of CCasp-3–positive cells with F-actin territories. Each point represents the mean from an individual experiment (n = 18–39 cells per point; 63–98 cells per sample). The slope (m) in the linear trendline equation (Y = 0.82X + 20.97) was significantly nonzero (p < 0.001). (G) Whole cell fluorescence values for F-actin and CCasp-3 were measured in individual cells and normalized to the parental sample. Each bar is the mean ± SD from three experiments (n = 607–866 cells per sample). Total and CCasp-3–negative cell data appear in Supplemental Figure S8. (H) Whole cell fluorescence values for CCasp-3 and F-actin were plotted against one another. Each point represents one cell (n = 607–866 cells per plot), where gray, blue, green, or pink points are CCasp-3 positive, and black points are CCasp-3 negative. The slopes (m) in the linear trendline regression equations for Parentals (Y = 0.96X + 0.04), WHAMMKOs (Y = 0.60X + 0.20), and JMYKOs (Y = 0.18X + 0.53) were significantly nonzero (p < 0.001), while the slope for the WHAMM/JMYDKO sample (Y = 0.03X + 0.61) was not (p = 0.070). *p < 0.05; **p < 0.01; ***p < 0.001 (ANOVA, Tukey post-hoc tests in B–D, G; Fisher’s exact test in E).
FIGURE 9:
FIGURE 9:
Model for apoptotic F-actin–rich territory assembly in coordinating apoptosome biogenesis and caspase activation. (A) Mitochondrial outer membrane permeabilization and release of cyto c (red circles) into the cytosol result in recruitment of JMY (green) and Arp2/3 complex–mediated assembly of actin filaments (gold) in a juxtanuclear region. WHAMM enhances actin polymerization and branching, and the early F-actin–rich territory sequesters cyto c and enables interactions with Apaf-1 (blue monomers).  (B) F-actin remodeling and territory maturation create a microenvironment conducive to the biogenesis and concentration of apoptosomes (blue/red heptamers). Initiator procaspase-9 (light purple) incorporates into holoapoptosomes (heptamers with purple hubs), which are retained within the territory. (C) The F-actin–rich territory increases in density to create a transient subcellular compartment for optimizing holoapoptosome-mediated processing of executioner procaspase-3 (red monomers) into active CCasp-3 (red dimers). F-actin functions to cluster the caspase activation process in the internal portion of the territory, while dense peripheral F-actin networks and associated proteins restrict accessibility of the caspase inhibitor XIAP (orange circles). Eventually, active caspase-3 achieves high enough quantities to bypass XIAP, escape the territory, and trigger the rapid proteolysis of substrates throughout the rest of the cell. Note that the stoichiometry and size of organelles and macromolecules shown in the figure (e.g., mitochondria, F-actin, apoptosomes, proteins) are not drawn to scale.

Similar articles

Cited by

References

    1. Ahn JS, Jang IS, Kim DI, Cho KA, Park YH, Kim K, Kwak CS, Chul Park S (2003). Aging-associated increase of gelsolin for apoptosis resistance. Biochem Biophys Res Commun 312, 1335–1341. - PubMed
    1. Banani SF, Lee HO, Hyman AA, Rosen MK (2017). Biomolecular condensates: organizers of cellular biochemistry. Nat Rev Mol Cell Biol 18, 285–298. - PMC - PubMed
    1. Bhola PD, Mattheyses AL, Simon SM (2009). Spatial and temporal dynamics of mitochondrial membrane permeability waves during apoptosis. Biophys J 97, 2222–2231. - PMC - PubMed
    1. Bock FJ, Tait SWG (2020). Mitochondria as multifaceted regulators of cell death. Nat Rev Mol Cell Biol 21, 85–100. - PubMed
    1. Bolte S, Cordelières FP (2006). A guided tour into subcellular colocalization analysis in light microscopy. J Microsc 224, 213–232. - PubMed

Publication types