. 2023 May 1;34(5):ar42.
doi: 10.1091/mbc.E22-10-0466. Epub 2023 Mar 15.

Centromere proteins are asymmetrically distributed between newly divided germline stem and daughter cells and maintain a balanced niche in Drosophila males

Affiliations

Centromere proteins are asymmetrically distributed between newly divided germline stem and daughter cells and maintain a balanced niche in Drosophila males

Antje M Kochendoerfer et al. Mol Biol Cell. .

Abstract

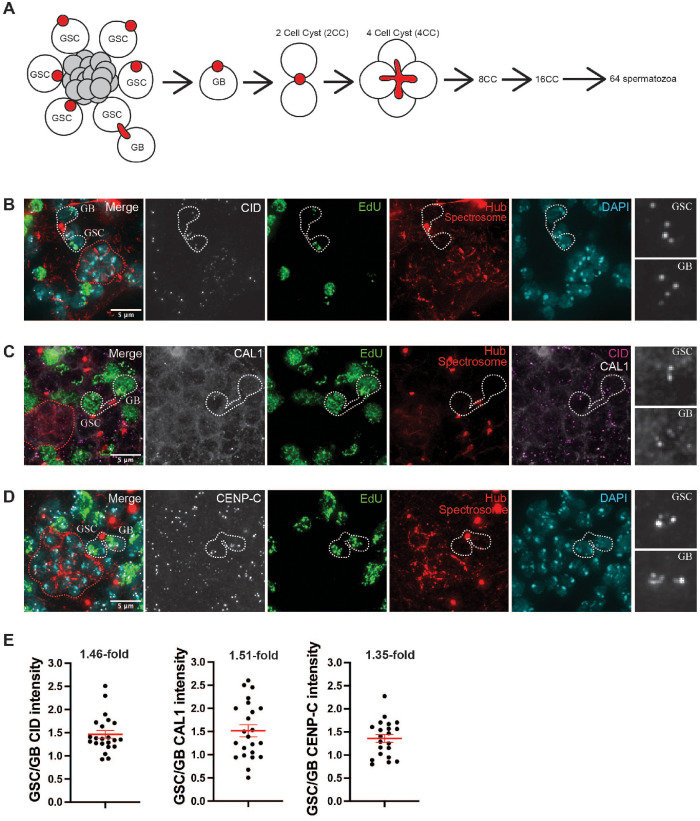
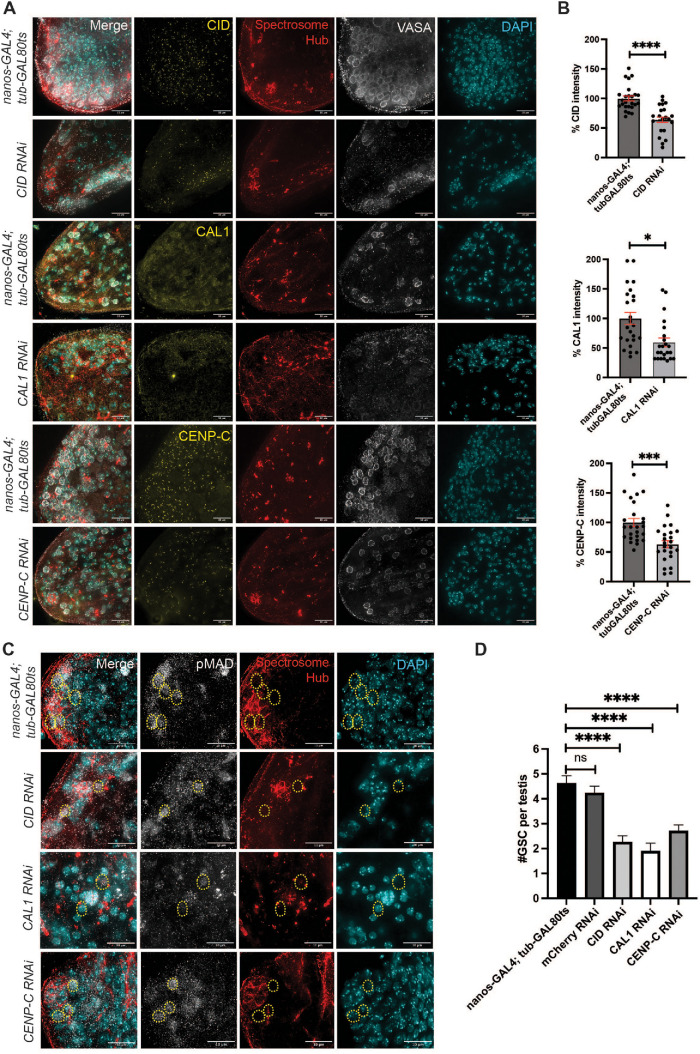
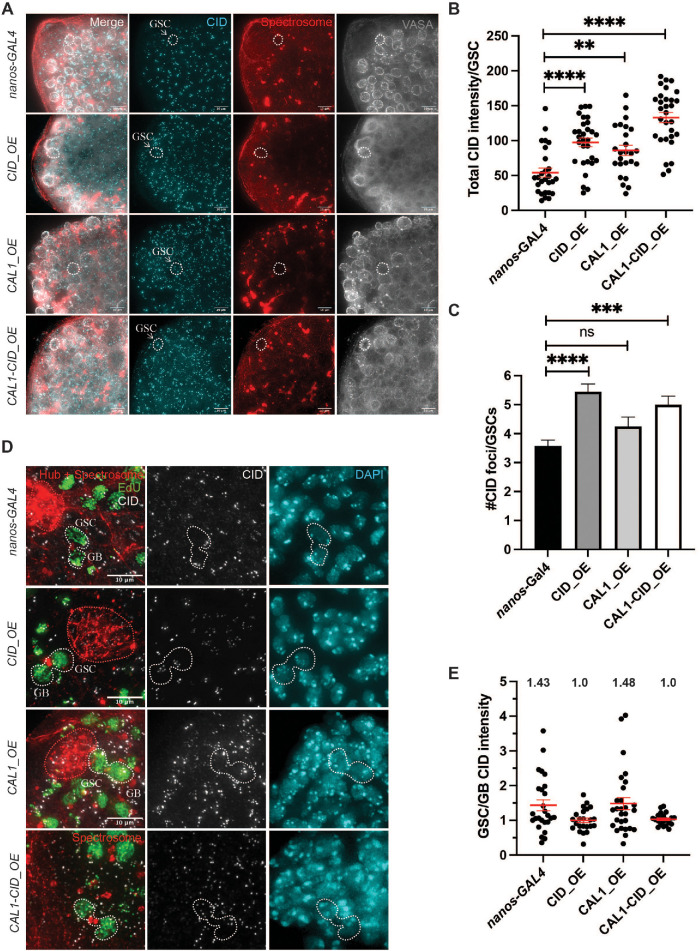
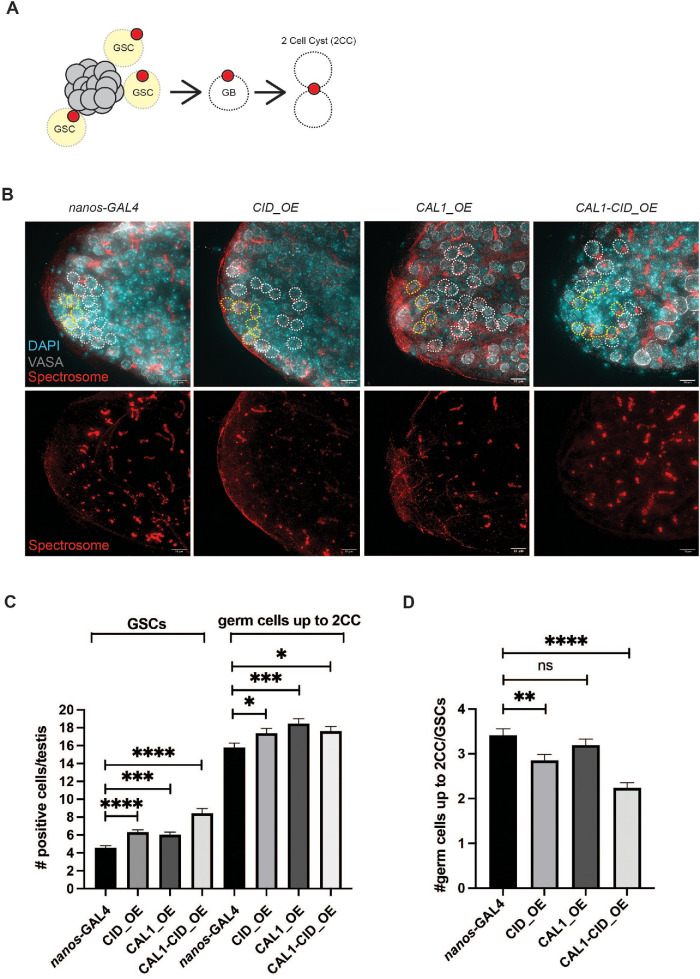
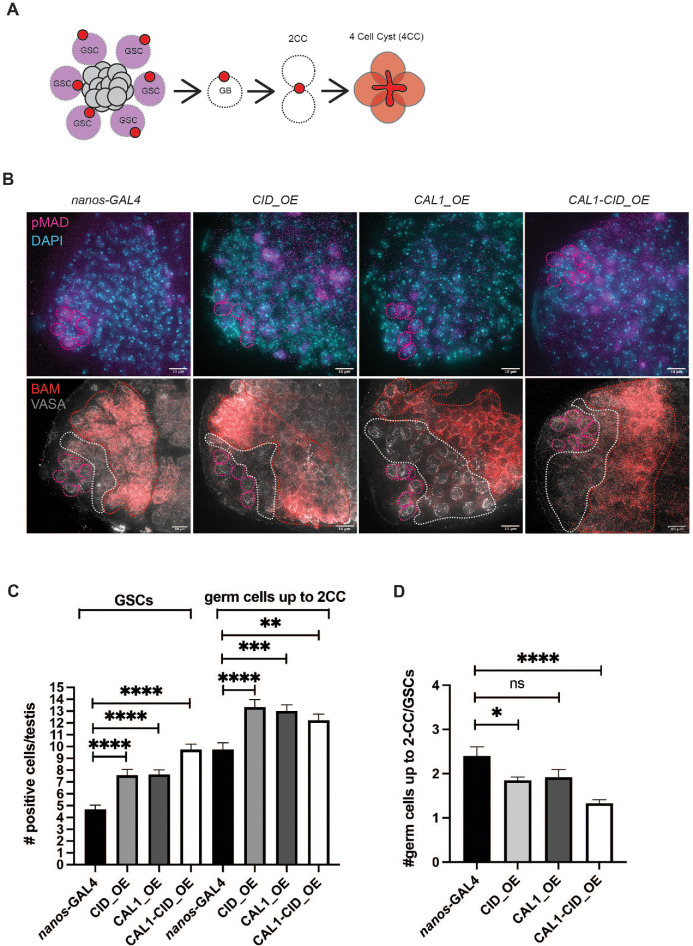
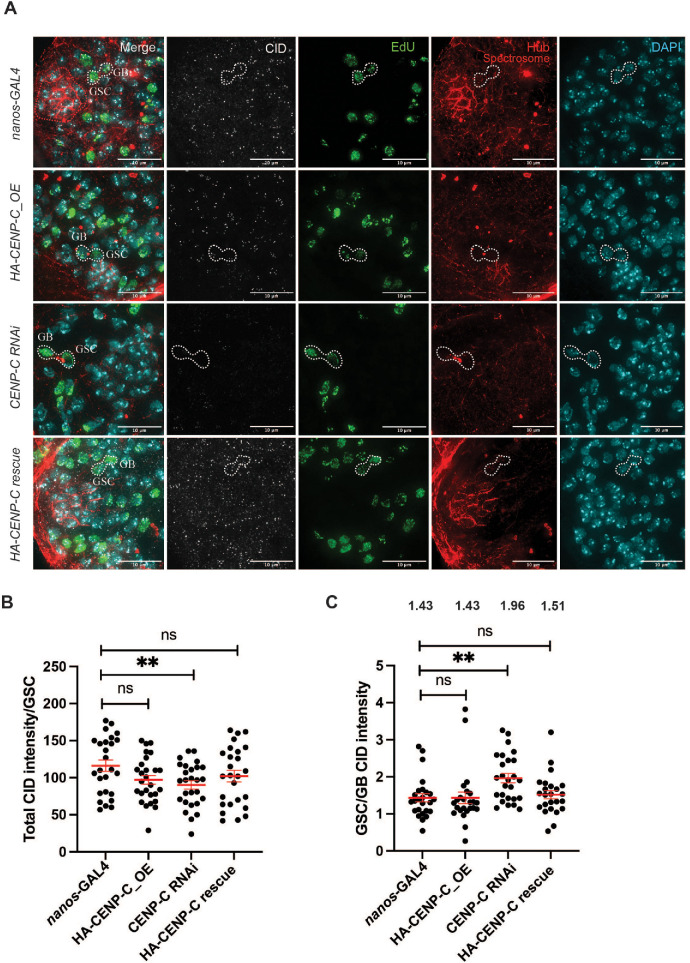
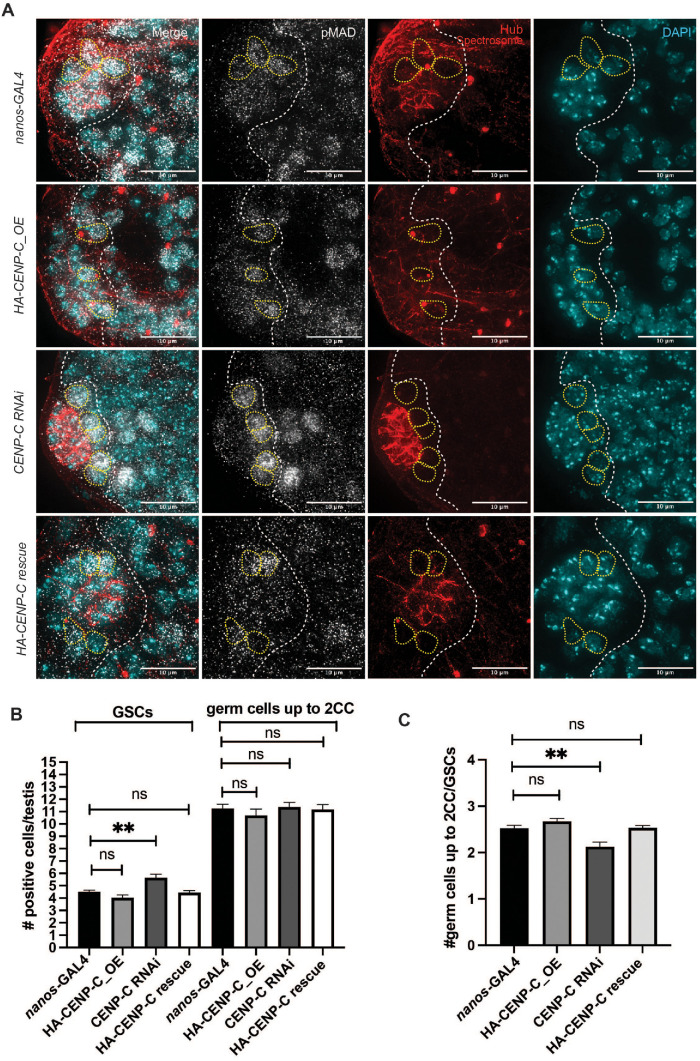
Stem cells can undergo asymmetric cell division (ACD) giving rise to one new stem cell and one differentiating daughter cell. In Drosophila germline stem cells (GSCs), the centromeric histone CENP-A (CID in flies) is asymmetrically distributed between sister chromatids such that chromosomes that end up in the GSC harbor more CID at centromeres. A model of "mitotic drive" has been proposed in GSCs such that stronger and earlier centromere and kinetochore interactions with microtubules bias sister chromatid segregation. Here we show that in Drosophila males, centromere proteins CID, CAL1, and CENP-C are asymmetrically distributed in newly divided GSCs and daughter cells in S phase. We find that overexpression of CID (either with or without CAL1) or CENP-C depletion disrupts CID asymmetry, with an increased pool of GSCs relative to daughter cells detectable in the niche. This result suggests a shift toward GSC self-renewal rather than differentiation, important for maintaining tissue homeostasis. Overexpression of CAL1 does not disrupt asymmetry, but instead drives germ cell proliferation in the niche. Our results in male GSCs are comparable to female GSCs, indicating that despite differences in signaling, organization, and niche composition, the effects of centromere proteins on GSC maintenance are conserved between the sexes.


Figures

FIGURE 1:
FIGURE 1:
(A) Schematic of the male germline stem cell (GSC) niche and cell divisions occurring in the Drosophila adult testis. GSCs are positioned in close contact with a patch of condensed nuclei that comprise the hub (gray circles). GSCs and daughter gonialblasts (GBs) can be identified by a round spectrin-rich organelle, the spectrosome. The spectrosome forms a bridged shape in S phase that connects newly divided GSC and GB pairs. GBs undergo four rounds of mitosis generating 2-, 4-, 8- and 16-cell cysts (CC). 16CC undergo meiosis to give bundles of 64 haploid spermatozoa. (B) Immunofluorescence image of the GSC niche of wild-type Drosophila testes stained for CID (white), the spectrosome together with the hub (red), DAPI (cyan), and pulse labeled with EdU (green). Scale bar = 5 μm. Red dashed line outlines the hub. White dashed line highlights a GSC and GB pair in S phase; zoom shows CID foci in highlighted GSC and GB nuclei. (C) Immunofluorescence image of the GSC niche of wild-type Drosophila testes stained for CAL1 (white), the spectrosome together with the hub (red), CID to mark centromeres (magenta), and pulse labeled with EdU (green). Scale bar = 5 μm. Red dashed line outlines the hub. White dashed line highlights a GSC and GB pair in S phase; zoom shows CAL1 foci in highlighted GSC and GB nuclei. Scale bar = 5 μm. (D) Immunofluorescence image of the GSC niche of wild-type Drosophila testes stained for CENP-C (white), the spectrosome together with the hub (red), DAPI (cyan), and pulse labeled with EdU (green). Scale bar = 5 μm. Red dashed line outlines the hub. White dashed line highlights a GSC and GB pair in S phase; zoom shows CENP-C foci in highlighted GSC and GB nuclei. (E) Quantitation of the ratio of total CID, CAL1, or CENP-C fluorescent intensity (integrated density) between GSC and GB S-phase pairs in the wild type. Each point represents the ratio of total intensity between GSC vs. its corresponding GB. Values 1.46 (for CID), 1.51 (for CAL1), and 1.35 (for CENP-C) indicate mean fold differences in intensity. At least 20 GSC-GB pairs were analyzed per quantitation.
FIGURE 2:
FIGURE 2:
(A) Immunofluorescence image of testis from nanos-GAL4; tubGAL80ts control, CID RNAi, CAL1 RNAi, and CENP-C RNAi 10 d after RNAi induction. Testes from respective RNAi experiments and controls are stained for either CID, CAL1, or CENP-C (yellow), the spectrosome together with the hub (red), VASA (gray), and DAPI (cyan). Scale bar = 10 μm. (B) Quantitation of CID, CAL1, and CENP-C knockdown in GSCs (n = 25–30) 10 d after respective RNAi induction. ****, p < 0.0001; ***, p < 0.001; *, p < 0.05; error bars = SEM. (C) Immunofluorescence image of testis from nanos-GAL4; tubGAL80ts control, CID RNAi, CAL1 RNAi, and CENP-C RNAi 10 d after RNAi induction. Testes are stained for pMAD (gray) and the spectrosome together with the hub (red). Yellow dashed circles indicate pMAD-positive GSCs with a round spectrosome located in contact with the hub selected for quantitation in 2D. Scale bar = 10 μm. (D) Quantitation of the number of GSCs per testes (n = 20–30) in the nanos-GAL4; tubGAL80ts control, nontarget mCherry RNAi control, CID RNAi, CAL1 RNAi, and CENP-C RNAi 10 d after RNAi induction. GSCs were identified as pMAD-positive cells with a round spectrosome that were attached to the hub. ****, p < 0.0001; ns, nonsignificant; error bars = SEM.
FIGURE 3:
FIGURE 3:
(A) Immunofluorescence image of control nanos-GAL4 testis, or testis overexpressing CID-mCherry (CID_OE), CAL1-YFP (CAL1_OE), and CAL1-YFP together with CID-mCherry (CAL1-CID_OE) stained for CID (cyan), the spectrosome (red), and VASA marking germ cells (gray). White arrows and dashed circles indicate typical GSCs isolated for quantitation that were VASA positive, with a round spectrosome and located adjacent to the hub (identified using DAPI; unpublished data). Scale bar = 10 μm. (B) Quantitation of total CID fluorescent intensity (integrated density) in GSCs (n = 25–30) in the control nanos-GAL4, and in CID_OE, CAL1_OE, or CAL1-CID_OE lines. ****, p < 0.0001; **, p < 0.01; error bars = SEM. n = 30 GSCs per quantitation. (C) Quantitation of total number of CID foci in GSCs (n = 28) in the control nanos-GAL4, and in CID_OE, CAL1_OE, or CAL1-CID_OE lines. ****, p < 0.0001; ***, p < 0.001; ns, nonsignificant; error bars = SEM. n = 30 GSCs per quantitation. (D) Immunofluorescence image of control nanos-GAL4 testis, or testis overexpressing CID-mCherry (CID_OE), CAL1-YFP (CAL1_OE), or CAL1-YFP together with CID-mCherry (CAL1-CID_OE) stained for CID (white), the spectrosome together with the hub (red), DAPI (cyan), and pulse labeled with EdU (green). Red dashed line outlines the hub. White dashed line highlights a GSC and GB pair in S phase. The cluster of DAPI-dense nuclei was used to identify the hub in CAL1-CID_OE. Scale bar = 10 μm. (E) Quantitation of the ratio of total CID fluorescent intensity (integrated density) between GSC and GB S-phase pairs in nanos-GAL4, CID_OE, or CAL1-CID_OE lines. Values 1.43 (for nanos-GAL4), 1.0 (for CID_OE), 1.0 (for CAL1-CID_OE), and 1.48 (for CAL1_OE) indicate mean fold differences in intensity. Between 25 and 30 GSC-GB pairs were analyzed per quantitation, with the exception of CAL1-CID (n = 21).
FIGURE 4:
FIGURE 4:
(A) Schematic of the assay used to quantify the balance of GSCs (in yellow), GBs and 2CC (in white) in Drosophila adult testis. (B) Immunofluorescence image of control nanos-GAL4 testis, or testis overexpressing CID-mCherry (CID_OE) or CAL1-YFP (CAL1_OE) or CAL1-YFP together with CID-mCherry (CAL1-CID_OE) stained for the spectrosome (red), VASA marking germ cells (gray), and DAPI (cyan). Yellow dashed circles indicate GSCs with a round spectrosome located in contact with the hub. White dashed circles indicate GBs or 2CCs with a round spectrosome not in contact with the hub. Scale bar = 10 μm. (C) Quantitation of total number of GSCs or germ cells up to 2CC in the control nanos-GAL4, and in CID_OE, CAL1_OE, or CAL1-CID_OE lines. ****, p < 0.0001; ***, p < 0.001; *, p < 0.05; error bars = SEM. n = 30 testes were analyzed per quantitation. (D) Ratio of all germ cells up to 2CC divided by the number of GSCs in the control nanos-GAL4, and in CID_OE, CAL1_OE, or CAL1-CID_OE lines. **, p < 0.01; ****, p < 0.0001; ns, nonsignificant; error bars = SEM.
FIGURE 5:
FIGURE 5:
(A) Schematic of the assay used to quantify the balance of GSCs (in magenta), GBs and 2CC (in white) in Drosophila adult testis. GSCs were counted based on a pMAD-positive signal with a round spectrosome adjacent to the hub. All germ cells up to the 2CC were VASA positive and BAM negative. BAM expression in 4CC is shown in red. (B) Immunofluorescence image of control nanos-GAL4 testis, or testis overexpressing CID-mCherry (CID_OE) or CAL1-YFP (CAL1_OE) or CAL1-YFP together with CID-mCherry (CAL1-CID_OE) stained for pMAD (magenta), BAM (red), VASA marking germ cells (gray), and DAPI (cyan). Magenta dashed circles indicate pMAD-positive GSCs in contact with the hub. White dashed circles indicate VASA-positive cells counted up to 2CC. Scale bar = 10 μm. (C) Quantitation of total number of GSCs or germ cells up to 2CC in the control nanos-GAL4, and in CID_OE, CAL1_OE, or CAL1-CID_OE lines. ****, p < 0.0001; ***, p < 0.001; **, p < 0.01; ns, nonsignificant; error bars = SEM. n = 30 testes were analyzed per quantitation. (D) Ratio of all germ cells up to 2CC divided by the number of GSCs in the control nanos-GAL4, and in CID_OE, CAL1_OE, or CAL1-CID_OE lines. ****, p < 0.0001; *, p < 0.05; ns, nonsignificant; error bars = SEM.
FIGURE 6:
FIGURE 6:
(A) Immunofluorescence image of control nanos-GAL4, HA-CENP-C_OE, CENP-C RNAi and HA-CENP-C; CENP-C RNAi (HA-CENP-C rescue) testis stained for CID (white), the spectrosome together with the hub (red), DAPI (cyan), and pulse labeled with EdU (green). White dashed line highlights a GSC and GB pair in S phase. Scale bar = 10 μm. (B) Quantitation of total CID fluorescent intensity (integrated density) in GSCs in the control nanos-GAL4, HA-CENP-C_OE, CENP-C RNAi and HA-CENP-C; CENP-C RNAi (HA-CENP-C rescue) lines. **, p < 0.01; ns, nonsignificant; error bars = SEM. n = 25–30 GSCs per quantitation. (C) Quantitation of the ratio of total CID fluorescent intensity (integrated density) between GSC and GB S-phase pairs in nanos-GAL4, HA-CENP-C_OE, CENP-C RNAi and HA-CENP-C; CENP-C RNAi (HA-CENP-C rescue) lines. Values 1.43 (for nanos-GAL4), 1.43 (for CENP-C_OE), 1.96 (for CENP-C RNAi), and 1.51 (for HA-CENP-C rescue) indicate mean fold differences in intensity. **, p < 0.01; ns, nonsignificant; error bars = SEM. n = 25–30 GSCs per quantitation.
FIGURE 7:
FIGURE 7:
(A) Immunofluorescence image of control nanos-GAL4, HA-CENP-C_OE, CENP-C RNAi and HA-CENP-C; CENP-C RNAi (HA-CENP-C rescue) testis stained for pMAD (gray), the spectrosome together with the hub (red), and DAPI (cyan). Yellow dashed circles indicate GSCs with a round spectrosome located in contact with the hub. White dashed line indicates area in which cells with a round spectrosome up to 2CC were counted. Scale bar = 10 μm. (B) Quantitation of total number of GSCs or germ cells up to 2CC in the control nanos-GAL4, HA-CENP-C_OE, CENP-C RNAi and HA-CENP-C; CENP-C RNAi (HA-CENP-C rescue) lines. **, p < 0.01; ns, nonsignificant; error bars = SEM. n = 30 testes were analyzed per quantitation. (C) Ratio of all germ cells up to 2CC divided by the number of GSCs in the control nanos-GAL4, HA-CENP-C_OE, CENP-C RNAi and HA-CENP-C; CENP-C RNAi (HA-CENP-C rescue) lines. **, p < 0.01; ns, nonsignificant; error bars = SEM.

Similar articles

Cited by

References

    1. Ables ET, Drummond-Barbosa D (2013). Cyclin E controls Drosophila female germline stem cell maintenance independently of its role in proliferation by modulating responsiveness to niche signals. Development 140, 530–540. - PMC - PubMed
    1. Bade D, Pauleau AL, Wendler A, Erhardt S (2014). The E3 ligase CUL3/RDX controls centromere maintenance by ubiquitylating and stabilizing CENP-A in a CAL1-dependent manner. Dev Cell 28, 508–519. - PubMed
    1. Carty BL, Dattoli AA, Dunleavy EM (2021). CENP-C functions in centromere assembly, the maintenance of CENP-A asymmetry and epigenetic age in Drosophila germline stem cells. PLoS Genet 17, e1009247. - PMC - PubMed
    1. Carty BL, Dunleavy EM (2020). Centromere assembly and non-random sister chromatid segregation in stem cells. Essays Biochem 64, 223–232. - PubMed
    1. Chen CC, Dechassa ML, Bettini E, Ledoux MB, Belisario C, Heun P, Luger K, Mellone BG (2014). CAL1 is the Drosophila CENP-A assembly factor. J Cell Biol 204, 313–329. - PMC - PubMed

Publication types

Substances

LinkOut - more resources