. 2023 May 1;34(5):ar43.
doi: 10.1091/mbc.E23-01-0014. Epub 2023 Mar 15.

Distinct Aurora B pools at the inner centromere and kinetochore have different contributions to meiotic and mitotic chromosome segregation

Affiliations

Distinct Aurora B pools at the inner centromere and kinetochore have different contributions to meiotic and mitotic chromosome segregation

Gisela Cairo et al. Mol Biol Cell. .

Abstract

Proper chromosome segregation depends on the establishment of bioriented kinetochore-microtubule attachments, which often requires multiple rounds of release and reattachment. Aurora B and C kinases phosphorylate kinetochore proteins to release tensionless attachments. Multiple pathways recruit Aurora B/C to the centromere and kinetochore. We studied how these pathways contribute to anaphase onset timing and correction of kinetochore-microtubule attachments in budding yeast meiosis and mitosis. We find that the pool localized by the Bub1/Bub3 pathway sets the normal duration of meiosis and mitosis, in differing ways. Our meiosis data suggests a model that disruption of this pathway leads to PP1 kinetochore localization, which dephosphorylates Cdc20 for premature anaphase onset. For error correction, the Bub1/Bub3 and COMA pathways are individually important in meiosis but compensatory in mitosis. Finally, we find that the haspin and Bub1/3 pathways function together to ensure error correction in mouse oogenesis. Our results suggest that each recruitment pathway localizes spatially distinct kinetochore-localized Aurora B/C pools that function differently between meiosis and mitosis.


Figures
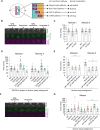
FIGURE 1:
FIGURE 1:
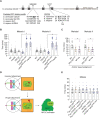
The Bub1/Bub3 pathway is the most important for setting the duration of mitosis and meiosis; however, in opposing ways. (A) Cartoon indicating which genetic manipulation was used to disrupt each Ipl1 recruitment pathway. (B) Representative time-lapse images of a wild-type cell undergoing meiosis. Cell expresses ZIP1-GFP, GFP-TUB1, and SPC42-mCherry. Time 0 marks prophase I. Numbers indicate time in minutes. Scale bar, 5 μm. (C) Graph of the mean time from SPB separation to anaphase onset in meiosis I and meiosis II. * indicates a statistically significant difference compared with wild-type cells (at least 100 cells from two or more independent experiments per genotype were counted; p < 0.05, Mann-Whitney test; error bars show SD [SD]). (D) Graph of the mean time from SPB separation to anaphase onset in meiosis I and meiosis II. Strains contain the NDT80-in system (PGAL1,10-NDT80, Gal4-ER) to synchronize cells and the anchor away background (TOR1-1, fpr1Δ, RPL13-2XFKBP12). In all strains, except wild type and mad3Δ, rapamycin was added 45 min after prophase I release to deplete Bub3 and/or Ctf19 from the nucleus. * indicates a statistically significant difference compared with wild-type cells (at least 100 cells from two or more independent experiments per genotype were counted; p < 0.05, Mann-Whitney test; error bars show SD). aa, anchor away. (E) Graph of the mean time from SPB separation to anaphase onset in meiosis I and meiosis II. Strains contain the anchor away background (TOR1-1, fpr1Δ, RPL13-2XFKBP12). Rapamycin was added when cells were transferred into sporulation medium in strains containing Bub3-aa to deplete Bub3 from the nucleus. * indicates a statistically significant difference compared with wild-type cells (at least 100 cells from two or more independent experiments per genotype were counted; p < 0.05, Mann-Whitney test; error bars show SD). aa, anchor away. (F) Representative time lapse of a wild-type cell going through mitosis. Cell expresses GFP-TUB1 and SPC42-mCherry. Numbers indicate time in minutes. Scale bar, 5 μm. (G) Graph of the mean time from SPB separation to anaphase onset in mitosis. Strains have the anchor away background. In strains containing Ipl1-aa, Bub3-aa, and Ctf19-aa, rapamycin was added when diluting (1:20) an overnight culture, 40–45 min before imaging to deplete Ipl1, Bub3, and Ctf19 from the nucleus, respectively. * indicates a statistically significant difference compared with wild-type cells (at least 100 cells from two or more independent experiments per genotype were counted; p < 0.05, Mann-Whitney test; error bars show SD). aa, anchor away.
FIGURE 2:
FIGURE 2:
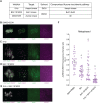
PP1 kinetochore localization and Cdc20 dephosphorylation sets the timing of anaphase onset in meiosis but not mitosis. (A) Diagram of Cdc20 domains highlighting the N-terminal phosphorylation sites S88, S89, and S127, predicted PP1 binding motifs in S. cerevisiae and H. sapiens, and S. cerevisiae CDC20 alignment with H. sapiens and C. elegans CDC20. (B) Graph of the mean time from SPB separation to anaphase onset in meiosis I and meiosis II. All strains, except wild type and mad3Δ, have the endogenous CDC20 under the mitosis-specific CLB2 promoter and express an integrated CDC20, cdc20S127A, or cdc20S88A,S89A under the CDC20 promoter. * indicates a statistically significant difference compared with wild-type cells (at least 100 cells from two or more independent experiments per genotype were counted; p < 0.05, Mann-Whitney test; error bars show SD). (C) Graph of the mean time from SPB separation to anaphase onset in meiosis I and meiosis II. All strains contain the anchor away genetic background (tor1-1, fpr1Δ, RPL13-2XFKBP12). In SPC105RVAF cells, rapamycin was added 7 h after resuspension into sporulation media to allow enough SPC105RVAF protein to be produced before anchoring away the FRB-tagged Spc105. In Ipl1-aa cells, rapamycin was added when cells were resuspended in sporulation medium to deplete Ipl1 from the nucleus. * indicates a statistically significant difference compared with wild-type cells (at least 100 cells from two or more independent experiments per genotype were counted; p < 0.05, Mann-Whitney test; error bars show SD). Aa, anchor away. (D) Cartoon depicting proposed meiotic model. When bipolar attachments are established, PP1 binds the kinetochore and dephosphorylates kinetochore-localized Cdc20 for APC/C activation. € Graph of the mean time from SPB separation to mitotic anaphase onset. Strains containing PMETCDC20 have the endogenous CDC20 under the MET3-repressible promoter and express an integrated CDC20, cdc20S127A, or cdc20S88AS89A under the CDC20 promoter. In strains containing cdc20Δ, the endogenous CDC20 is deleted and integrated cdc20, cdc20S127A, or cdc20S88AS89A is under the endogenous promoter. At least 100 cells from two independent experiments per genotype were counted; p < 0.05, Mann-Whitney test; error bars show SD.
FIGURE 3:
FIGURE 3:
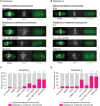
The pools of Ipl1Aurora B at the inner centromere and kinetochore recruited through the Bub1/Bub3 pathway and the Ctf19 pathway are important for error correction of kinetochore–microtubule attachments in meiosis I and meiosis II. (A) Schematic of even and uneven chromatin segregation in meiosis I and meiosis II. (B, C) Representative time lapse of wild-type (B) and alk1Δalk2Δ (C) cells displaying even chromatin segregation in meiosis I and meiosis II. Cells express Htb2-mCherry to visualize chromatin. Numbers indicate time in minutes. Scale bars, 5 μm. (D) Percent of cells that display even and uneven chromatin segregation in meiosis I and meiosis II. All strains contain the anchor away genetic background (TOR1-1, fpr1Δ, RPL13-2XFKBP12). Rapamycin was added to Bub3-aa and Ipl1-aa cells upon resuspension in sporulation medium to deplete Bub3 and Ipl1 from the nucleus, respectively. * indicates a statistically significant difference compared with the wild-type anchor away strain (at least 100 cells from two or more independent experiments per genotype were counted; p < 0.05; two-tailed Fisher’s exact test). aa, anchor away. (E–H) Representative time lapse of wild-type (E), Bub3-aa (F), Ctf19-aa (G), and Ctf19-aa Bub3-aa (H) cells containing the NDT80-in system displaying either even or uneven chromatin segregation events in meiosis I and II. Cells express Htb2-mCherry. Numbers indicate time in minutes. Scale bars, 5 μm. aa, anchor away. (I) Percent of cells that display even and uneven chromatin segregation in meiosis I and meiosis II, containing the NDT80-in system (PGAL1,10-NDT80, Gal4-ER) and the anchor away genetic background (tor1-1, fpr1Δ, RPL13-2XFKBP12). In all strains, β-estradiol was added 12 h after cells were resuspended in sporulation media. Rapamycin was added to strains containing Bub3-aa and Ctf19-aa 45 min after β-estradiol addition to deplete Bub3 and Ctf19 from the nucleus, respectively. Rapamycin was not added to the strain labeled “Ctf19-aa No Rap.” * indicates a statistically significant difference compared with the wild-type anchor away strain (at least 100 cells from two or more independent experiments per genotype were counted; p < 0.05; two-tailed Fisher’s exact test). aa, anchor away. (J) Percent of cells that display even and uneven chromatin segregation in meiosis II, containing the NDT80-in system (PGAL1,10-NDT80, Gal4-ER) and the anchor away genetic background (TOR1-1, fpr1Δ, RPL13-2XFKBP12). β-Estradiol was added to NDT80-in cells 12 h after suspension in sporulation media. Rapamycin was added 3 h after β-estradiol addition to Ipl1-aa, Bub3-aa, and Ctf19-aa cells, as cells were completing meiosis I to deplete Ipl1, Bub3, and Ctf19 from the nucleus, respectively. * indicates a statistically significant difference compared with the wild-type anchor away strain (at least 100 cells from two or more independent experiments per genotype were counted; p < 0.05; two-tailed Fisher’s exact test). aa, anchor away.
FIGURE 4:
FIGURE 4:
The pools of Ipl1Aurora B at the inner centromere and kinetochore recruited through Bub1/Bub3 and the Ctf19 pathways are compensatory for error correction of kinetochore–microtubule attachments in mitosis. (A) Schematic of even and uneven chromatin segregation in mitosis. (B–D) Representative time lapse of wild-type (B), Ctf19-aa (C), and Ctf19-aa Bub3-aa (D) cells expressing Htb2-mCherry and displaying even or uneven chromatin segregation. Numbers indicate time in minutes. Scale bars, 5 μm. aa, anchor away. (E) Percent of cells displaying even and uneven chromatin segregation in mitosis. All strains contain the anchor away genetic background (TOR1-1, fpr1Δ, RPL13-2XFKBP12). Rapamycin was added to strains containing Ipl1-aa, Bub3-aa, and Ctf19-aa 30 min before imaging to deplete Ipl1, Bub3, and Ctf19 from the nucleus, respectively. * indicates a statistically significant difference compared with the wild-type anchor away cells (at least 100 cells from two or more independent experiments per genotype were counted; p < 0.05, two-tailed Fisher’s exact test). aa, anchor away. aa, anchor away.
FIGURE 5:
FIGURE 5:
Bub1 and haspin kinases are compensatory for recruiting AURKC at the kinetochore. (A) Table depicting which inhibitor and corresponding solvent was used to disrupt each Aurora recruitment pathway in mouse oocytes. (B–E) Representative images of oocytes that were matured in vitro for 8 h from prophase I release. Oocytes were treated with the indicated drugs or solvents and immunostained for DNA (DAPI; gray), Aurora kinase C (α-tubulin; green), and kinetochores (CREST; magenta). DMSO and BAY-1816032 were added in prophase I upon oocyte transfer into the maturation media; ethanol and 5-Itu were added 5 h after prophase I release. Scale bars, 10 μm. (F) Graph indicating Aurora kinase C fluorescence intensity relative to kinetochores (CREST) staining. Each point plotted represents the average of at least 20 kinetochores in a single oocyte. Thirty metaphase I oocytes were used for each condition. * indicates a statistically significant difference compared with the wild-type oocytes (p < 0.05, two-tailed Fisher’s exact test).
FIGURE 6:
FIGURE 6:
Bub1 and haspin kinases are compensatory for recruiting AURKC for error correction of kinetochore–microtubule attachments. (A) Representative images of oocytes that were matured in vitro for 8 h from prophase I release. Oocytes were treated with the indicated drugs and immunostained for DNA (DAPI; gray) and microtubules (α-tubulin; green). DMSO, BAY-1816032, and ZM447439 were added in prophase I upon oocyte transfer into the maturation media; ethanol and 5-Itu were added 5 h after prophase I release. Scale bars, 10 μm. (B) Representative images of oocytes that were matured in vitro for 15 h from prophase I release. Oocytes were treated with the indicated drugs and immunostained for DNA (DAPI; gray) and microtubules (α-tubulin; green). All drugs and solvents were added 11 h after prophase I release. Scale bars, 10 μm. (C) Percent of metaphase I oocytes with correctly aligned and attached or misaligned and unattached chromosomes. * indicates a statistically significant difference compared with the wild-type oocytes (n = 30–47 oocytes per condition; p < 0.05, two-tailed Fisher’s exact test). (D) Percent of metaphase II oocytes with correctly aligned and attached or misaligned and unattached chromosomes in metaphase I with the indicated drugs and solvents. * indicates a statistically significant difference compared with the wild-type oocytes (n = 30–47 oocytes per condition; p < 0.05, two-tailed Fisher’s exact test).

Update of

References

    1. Abad MA, Gupta T, Hadders MA, Meppelink A, Wopken JP, Blackburn E, Zou J, Gireesh A, Buzuk L, Kelly DA, et al. (2022). Mechanistic basis for Sgo1-mediated centromere localization and function of the CPC. J Cell Biol 221, e202108156. - PMC - PubMed
    1. Avo Santos M, van de Werken C, de Vries M, Jahr H, Vromans MJM, Laven JSE, Fauser BC, Kops GJ, Lens SM, Baart EB. (2011). A role for Aurora C in the chromosomal passenger complex during human preimplantation embryo development. Hum Reprod 26, 1868–81. - PubMed
    1. Balboula AZ, Blengini CS, Gentilello AS, Takahashi M, Schindler K (2017). Maternal RNA regulates Aurora C kinase during mouse oocyte maturation in a translation-independent fashion. Biol Reprod 96, 1197–1209. - PMC - PubMed
    1. Balboula AZ, Nguyen AL, Gentilello AS, Quartuccio SM, Drutovic D, Solc P, Schindler K (2016). Haspin kinase regulates microtubule-organizing center clustering and stability through Aurora kinase C in mouse oocytes. J Cell Sci 129, 3648–3660. - PMC - PubMed
    1. Bancroft J, Holder J, Geraghty Z, Alfonso-Perez T, Murphy D, Barr FA, Gruneberg U (2020). PP1 promotes cyclin B destruction and the metaphase-anaphase transition by dephosphorylating CDC20. Mol Biol Cell 31, 2315–2330. - PMC - PubMed

Publication types

Substances

LinkOut - more resources