. 2023 Jul 25;7(14):3485-3500.
doi: 10.1182/bloodadvances.2022008345.

The mitochondrial pyruvate carrier complex potentiates the efficacy of proteasome inhibitors in multiple myeloma

Affiliations

The mitochondrial pyruvate carrier complex potentiates the efficacy of proteasome inhibitors in multiple myeloma

Steven Findlay et al. Blood Adv. .

Abstract

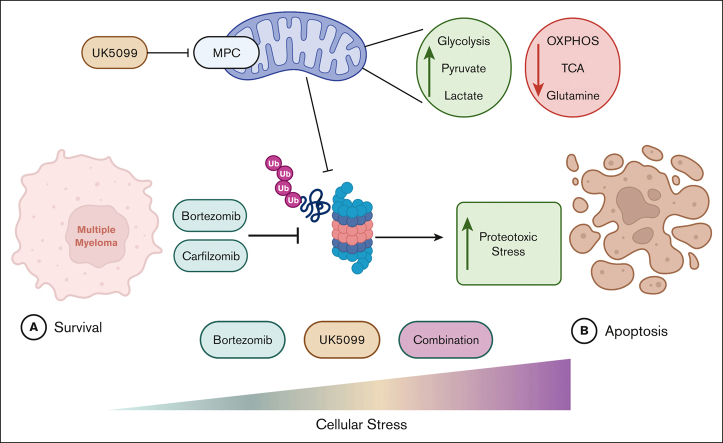
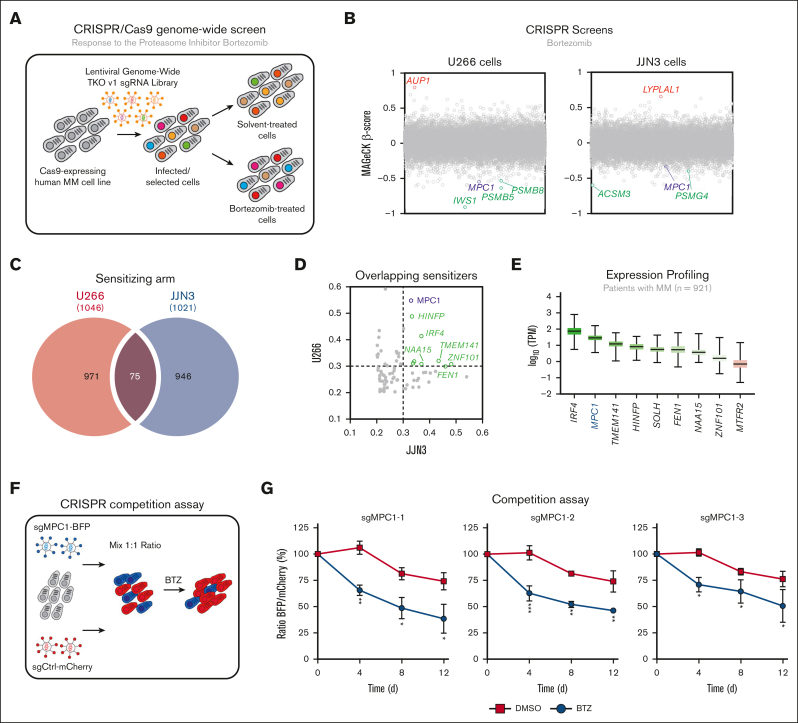
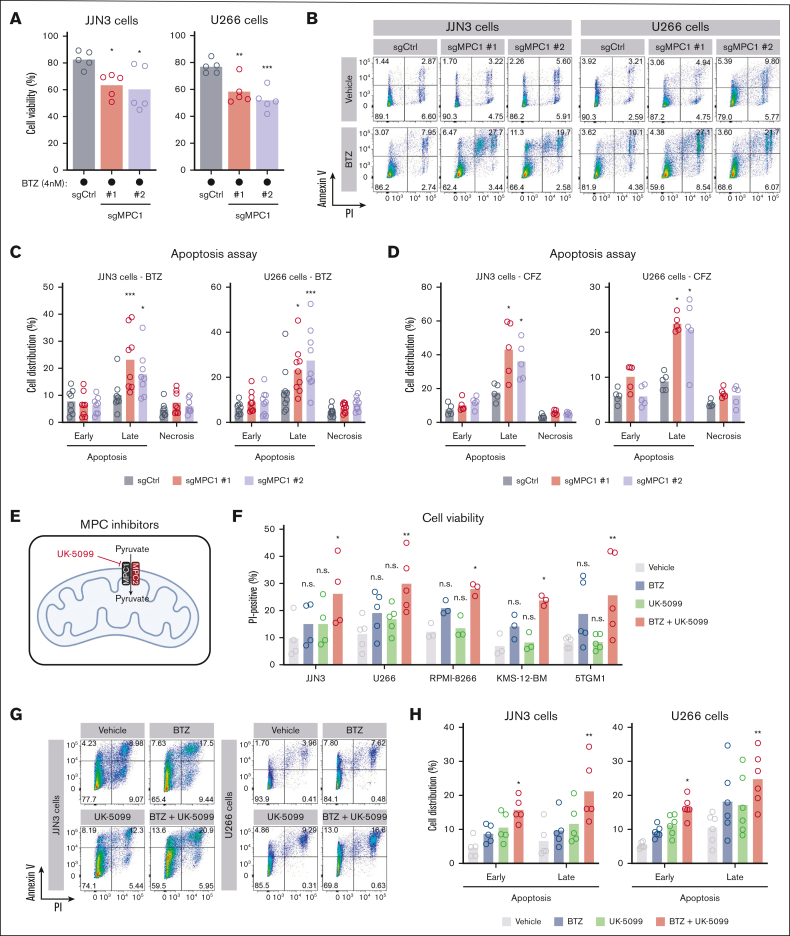
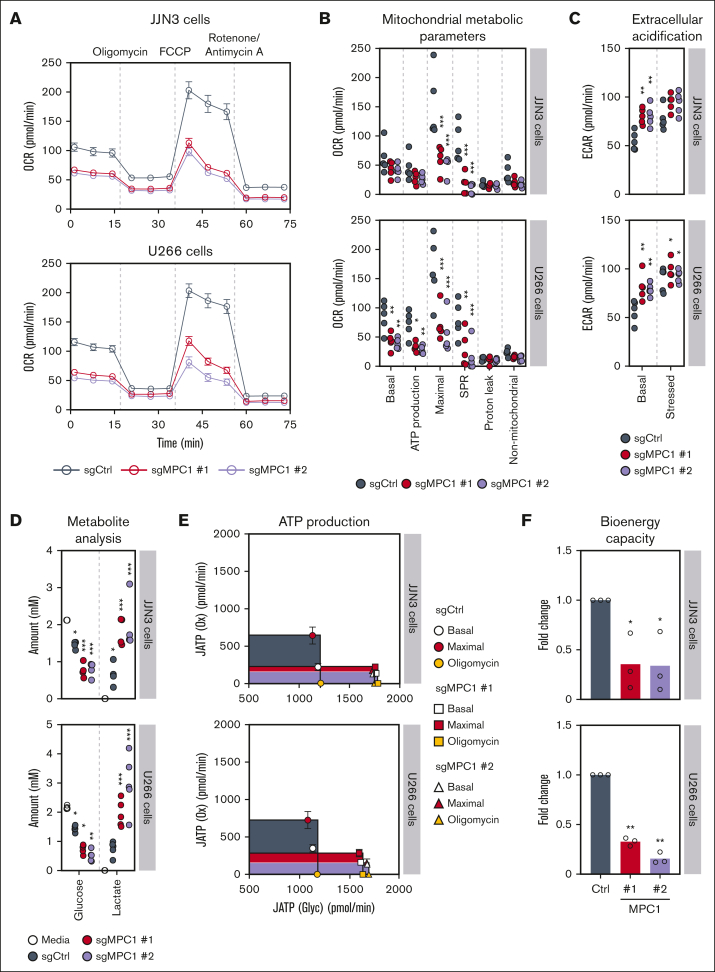
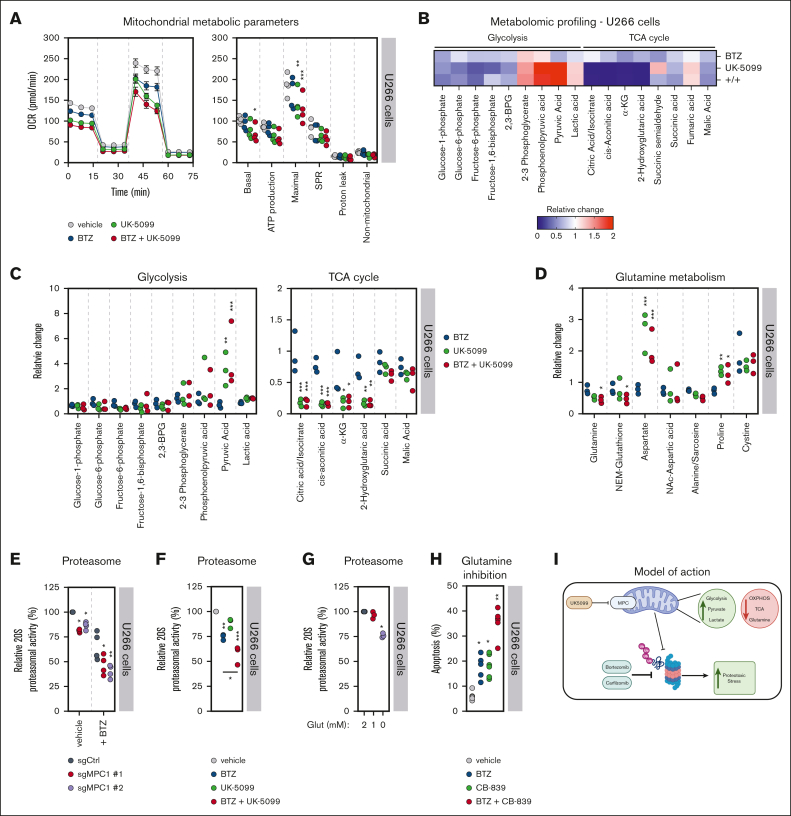
Multiple myeloma (MM) is a hematological malignancy that emerges from antibody-producing plasma B cells. Proteasome inhibitors, including the US Food and Drug Administration-approved bortezomib (BTZ) and carfilzomib (CFZ), are frequently used for the treatment of patients with MM. Nevertheless, a significant proportion of patients with MM are refractory or develop resistance to this class of inhibitors, which represents a significant challenge in the clinic. Thus, identifying factors that determine the potency of proteasome inhibitors in MM is of paramount importance to bolster their efficacy in the clinic. Using genome-wide CRISPR-based screening, we identified a subunit of the mitochondrial pyruvate carrier (MPC) complex, MPC1, as a common modulator of BTZ response in 2 distinct human MM cell lines in vitro. We noticed that CRISPR-mediated deletion or pharmacological inhibition of the MPC complex enhanced BTZ/CFZ-induced MM cell death with minimal impact on cell cycle progression. In fact, targeting the MPC complex compromised the bioenergetic capacity of MM cells, which is accompanied by reduced proteasomal activity, thereby exacerbating BTZ-induced cytotoxicity in vitro. Importantly, we observed that the RNA expression levels of several regulators of pyruvate metabolism were altered in advanced stages of MM for which they correlated with poor patient prognosis. Collectively, this study highlights the importance of the MPC complex for the survival of MM cells and their responses to proteasome inhibitors. These findings establish mitochondrial pyruvate metabolism as a potential target for the treatment of MM and an unappreciated strategy to increase the efficacy of proteasome inhibitors in the clinic.


Conflict of interest statement

Conflict-of-interest disclosure: The authors declare no competing financial interests.

Figures

None
Graphical abstract
Figure 1.
Figure 1.
CRISPR screening identifies MPC1 as a modulator of BTZ response in MM cells. (A) Schematic of our CRISPR-based genome-wide screening pipeline developed in MM cells. (B) Representation of the CRISPR-based dropout screen performed in U266 and JJN3 cells in the presence of BTZ (IC25). Genes are represented in alphabetically order with their respective MAGeCK β-score. (C) Overlapping genes from U266 and JJN3 sensitizing arms (MAGeCK β ≤ −0.2). (D) Representation of the overlapping sensitizers identified in panel C with their respective MAGeCK β-score in JJN3 cell line (x-axis) and U266 cell line (y-axis). (E) Expression analysis of the 75 overlapping sensitizers in the MMRF CoMMpass database (n = 921). The top 9 most-expressed genes are represented in this panel. (F) Competitive growth assay in the presence or absence of BTZ (3 nM) or DMSO (vehicle) in U266 cells. Data are represented as the ratio of BFP:mCherry+ ± standard error of the mean, normalized to day 0 (3 different sgRNAs; n = 3). Significance was determined using two-way ANOVA followed by a Sidak test. ∗P ≤ .05; ∗∗P ≤ .01; ∗∗∗P ≤ .005. ANOVA, analysis of variance; BFP, blue fluorescent protein.
Figure 2.
Figure 2.
Targeting the MPC complex exacerbates BTZ-induced apoptosis of MM cells. (A) JJN3 and U266 cells were treated with BTZ (4 nM) for 48 hours, followed by an assessment of cell viability via PI staining (n = 5). Significance was determined using one-way ANOVA followed by a Dunnett test. ∗P ≤ .05; ∗∗P ≤ .005; ∗∗∗P ≤ .005. (B) Representative flow cytometry analysis of JJN3 and U266 cells treated with either DMSO or BTZ (4 nM) for 48 hours and stained with annexin-V/PI. (C) Representation of the annexin-V/PI analysis displayed in panel B for both JJN3 (n = 8) and U266 cells (n = 9). Significance was determined using two-way ANOVA followed by a Dunnett test. ∗P ≤ .05; ∗∗∗P < .0001. (D) Similar to panel C, except that BTZ was replaced by CFZ (4 nM) for both JJN3 (n = 5) and U266 cells (n = 5). Significance was determined using two-way ANOVA followed by a Dunnett test. ∗P ≤ .0005. (E) Schematic representing UK-5099 inhibiting pyruvate entry into the mitochondrial matrix via MPC1 and MPC2. (F) JJN3 (n = 4), U266 (n = 5), RPMI-8266 (n = 3), KMS-12-BM (n = 3), and 5TGM1 cells (n = 5) were treated with BTZ (3 nM) and UK-5099 (10 μM) for 48 hours, followed by an assessment of cell viability via PI. Significance was determined using two-way ANOVA followed by a Dunnett test. ∗P ≤ .05; P ≤ .005. (G) Representative flow cytometry analysis of JJN3 and U266 cells treated with either BTZ (3 nM) and UK-5099 (10 μM) for 48 hours and stained with annexin-V/PI. (H) Representation of the annexin-V/PI analysis displayed in panel G for both JJN3 (n = 5) and U266 cells (n = 6). Significance was determined using two-way ANOVA followed by a Dunnett test. ∗P ≤ .05; P ≤ .005.
Figure 3.
Figure 3.
The MPC complex is required for bioenergetic capacity of MM cells. (A) OCR monitored by the Seahorse XF96 extracellular flux analyzer in JJN3 and U266 cells (n = 5). (B) Analysis of the different mitochondrial metabolic parameters obtained from the OCR in panel A. Significance was determined using two-way ANOVA followed by a Dunnett test. ∗P ≤ .05; P ≤ .005; ∗∗∗P < .0001. (C) Quantification of basal ECAR and stressed ECAR in JJN3 and U266 cells (n = 5). Significance was determined using two-way ANOVA followed by a Dunnett test. ∗P ≤ .05; P ≤ .005. (D) Media metabolite analysis of JJN3 (n = 4) and U266 cells (n = 5), with a focus on extracellular glucose and lactate. Significance was determined using two-way ANOVA followed by a Dunnett test. ∗P ≤ .05; P ≤ .005; ∗∗∗P < .0001. (E) The metabolic capacity and flexibility of cells were represented by plotting the basal, oligomycin-treated, and maximal rates of ATP production from glycolysis (JATP gly) and oxidative phosphorylation (JATP ox), upon MPC1 knockout in both JJN3 and U266 cells (n = 5). (F) Fold change in the bioenergetic capacity and of cells described in panel A (n = 5). Significance was determined using two-way ANOVA followed by a Dunnett test. ∗P ≤ .05. OCR, oxygen consumption rate.
Figure 4.
Figure 4.
Lack of mitochondrial pyruvate import alters glutamine metabolism and BTZ-driven proteasomal inhibition in MM cells. (A) OCR plot and metabolic parameters of U266 cells treated with the indicated drugs: BTZ (3 nM), UK-5099 (10 μM), or the combination. Significance was determined using two-way ANOVA followed by a Dunnett test. ∗P ≤ .05; P ≤ .005; ∗∗∗P < .0001. (B) LC-MS results of glycolysis and the TCA cycle of monotherapies and combinatorial therapies relative to vehicle control U266 cells (n = 3). U266 cells were treated with BTZ (3 nM), UK-5099 (10 μM), or a combination for 24 hours. (C) Representation of data shown in panel B. Significance was determined using two-way ANOVA followed by a Dunnett test. ∗P ≤ .05; P ≤ .005; ∗∗∗P < .0001. (D) Representation of LC-MS data presented in panel B with a focus on glutamine metabolism and its associated nonessential amino acids. Significance was determined using two-way ANOVA followed by a Dunnett test. ∗P ≤ .05; P ≤ .005; ∗∗∗P < .0001. (E) Chymotrypsin-like proteasome activity was monitored in control (sgCtrl) or MPC1-knockout (sgMPC1 #1 and #2) U266 cells in the presence or absence (vehicle) of BTZ (3 nM) (n = 3). Significance was determined using two-way ANOVA followed by a Dunnett test. ∗P ≤ .05; ∗∗P ≤ .005. (F) Similar to panel E, except that U266 cells were treated with either vehicle, BTZ (3 nM), UK-5099 (10 μM), or the combination (n = 3). Significance was determined by two-way ANOVA followed by a Dunnett test. ∗P ≤ .05; P ≤ .005; ∗∗∗P < .0001. (G) Similar to panel E, except that glutamine was depleted from the media of U266 cells (basal concentration: 2 mM) (n = 3). Significance was determined using two-way ANOVA followed by a Dunnett test; ∗ P < .0001. (H) U266 cells were treated with BTZ (3 nM) and the glutaminase inhibitor CB-839 (5 μM) for 48 hours, followed by an assessment of cell viability via PI. Significance was determined using two-way ANOVA followed by a Dunnett test. ∗P ≤ .005; P ≤ .0001. (I) Schematic representing link between the MPC complex, the metabolic rewiring induced its inhibition, and the proteasomal capacity of MM cells.
Figure 5.
Figure 5.
Pyruvate metabolism has prognostic potential for patients with MM. (A) Expression profiling of genes related to pyruvate metabolism at different stages of MM: MGUS (n = 22), SMM (n = 24), MM (n = 73), and relapsed MM (n = 28). Significance was determined using two-way ANOVA followed by a Dunnett test. ∗P ≤ .05; P ≤ .005; ∗∗∗P < .0001. (B) Expression profiling of genes related to pyruvate metabolism at different stages of MM in the GSE2113 data set: MGUS (n = 6), MM (n = 20), and PCL (n = 5). Significance was determined using two-way ANOVA followed by a Dunnett test. ∗P ≤ .05; P ≤ .005; ∗∗∗P < .0001. (C) The x-axis represents the survival time (days), and the y-axis represents survival probability (left) and progression-free survival (right). The survival analysis of the overall survival and progression-free survival in pyruvate metabolismhigh and pyruvate metabolismlow groups of 772 patients with MM in the MMRF database. Significance was determined using Gehan-Breslow-Wilcoxon test. (D) Samples from patients with MM were treated with BTZ (2.5-5 nM), UK-5099 (5 μM), or the combination for 24 hours (n = 4). CD38-PE and CD45-APC-Cy7 were used to gate on MM cells. An assessment of cell viability was performed using annexin-V/DAPI staining. Significance was determined by two-way ANOVA followed by a Dunnett test. ∗P ≤ .05. (E) Schematic representing our recent findings on the contribution of the MPC complex in the response to proteasome inhibitors and function in MM cells. OXPHOS, oxidative phosphorylation; PCL, plasma cell leukemia; SMM, smoldering MM.

References

    1. Padala SA, Barsouk A, Barsouk A, et al. Epidemiology, staging, and management of multiple myeloma. Med Sci (Basel) 2021;9(1):3. - PMC - PubMed
    1. Gulla A, Anderson KC. Multiple myeloma: the (r)evolution of current therapy and a glance into future. Haematologica. 2020;105(10):2358–2367. - PMC - PubMed
    1. Bazarbachi AH, Al Hamed R, Malard F, Harousseau JL, Mohty M. Relapsed refractory multiple myeloma: a comprehensive overview. Leukemia. 2019;33(10):2343–2357. - PubMed
    1. Zhu YX, Tiedemann R, Shi CX, et al. RNAi screen of the druggable genome identifies modulators of proteasome inhibitor sensitivity in myeloma including CDK5. Blood. 2011;117(14):3847–3857. - PMC - PubMed
    1. Shi CX, Kortum KM, Zhu YX, et al. CRISPR genome-wide screening identifies dependence on the proteasome subunit PSMC6 for bortezomib sensitivity in multiple myeloma. Mol Cancer Ther. 2017;16(12):2862–2870. - PMC - PubMed

Publication types

MeSH terms