. 2023 Aug 8;7(15):4200-4214.
doi: 10.1182/bloodadvances.2022009022.

Circulating SARS-CoV-2+ megakaryocytes are associated with severe viral infection in COVID-19

Affiliations

Circulating SARS-CoV-2+ megakaryocytes are associated with severe viral infection in COVID-19

Seth D Fortmann et al. Blood Adv. .

Abstract

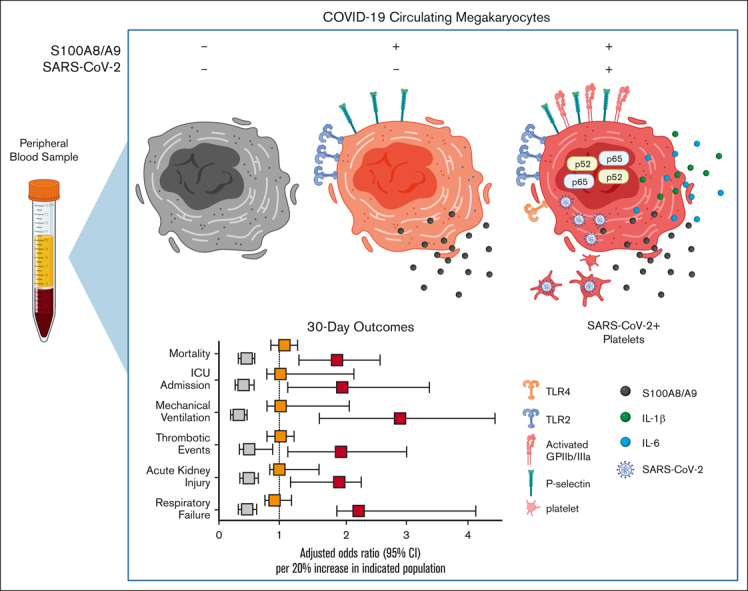
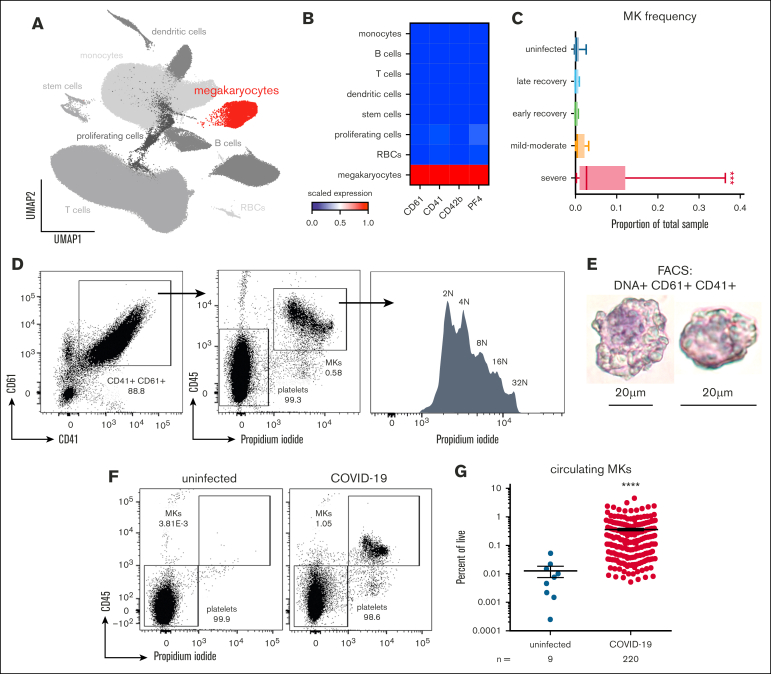
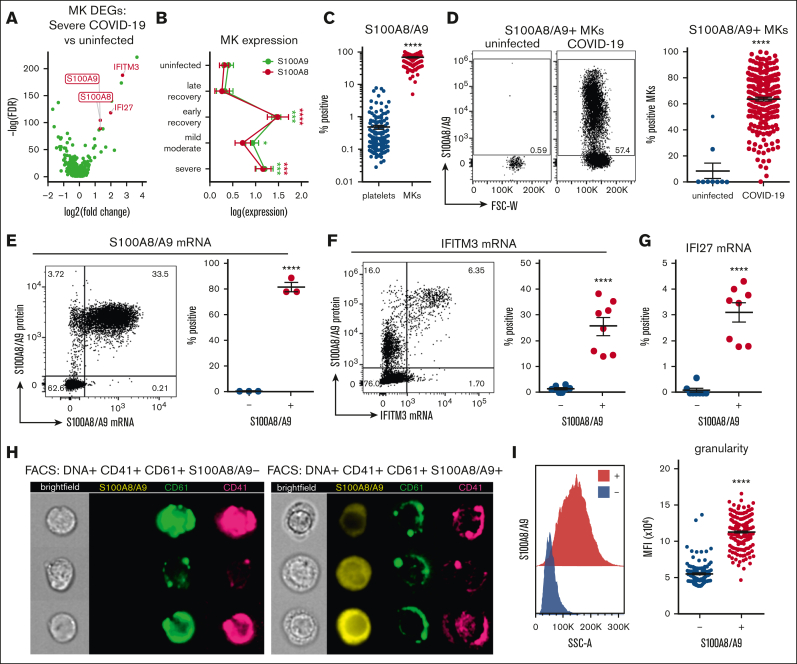
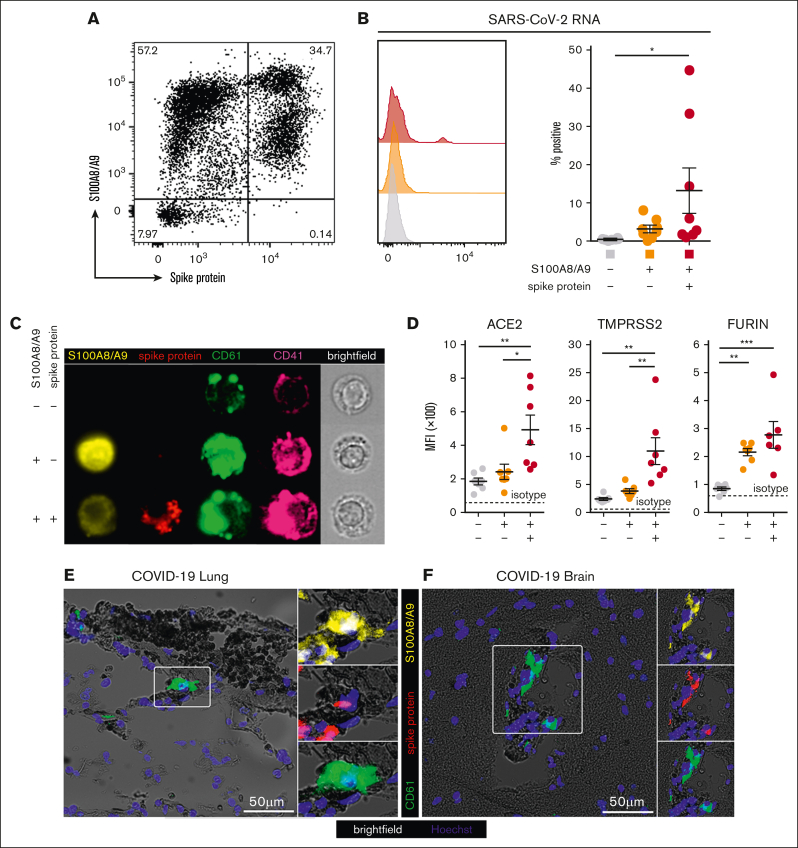
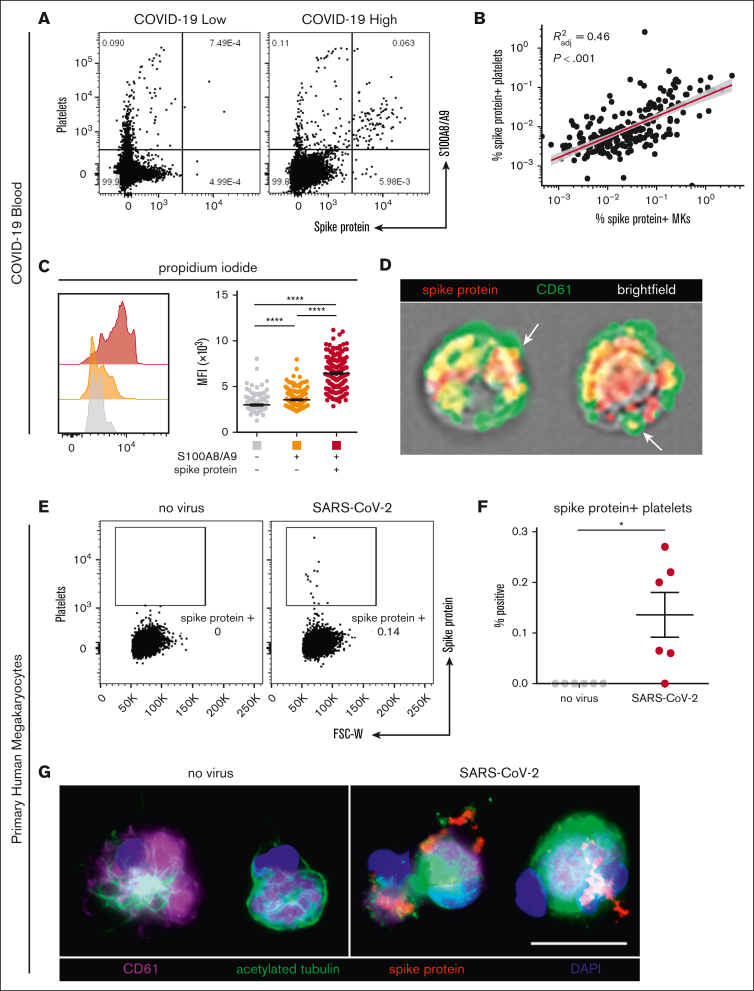
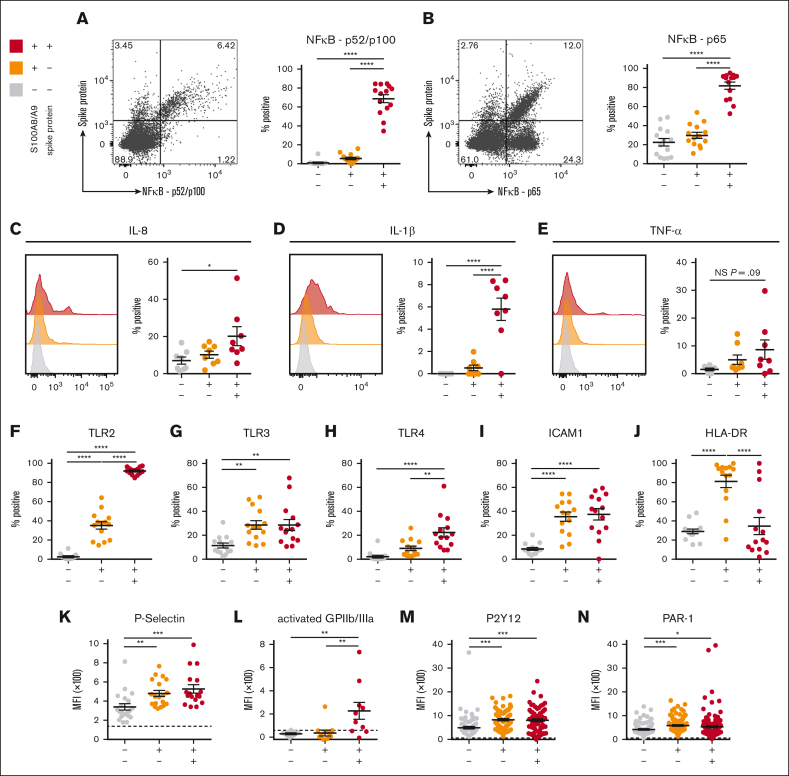
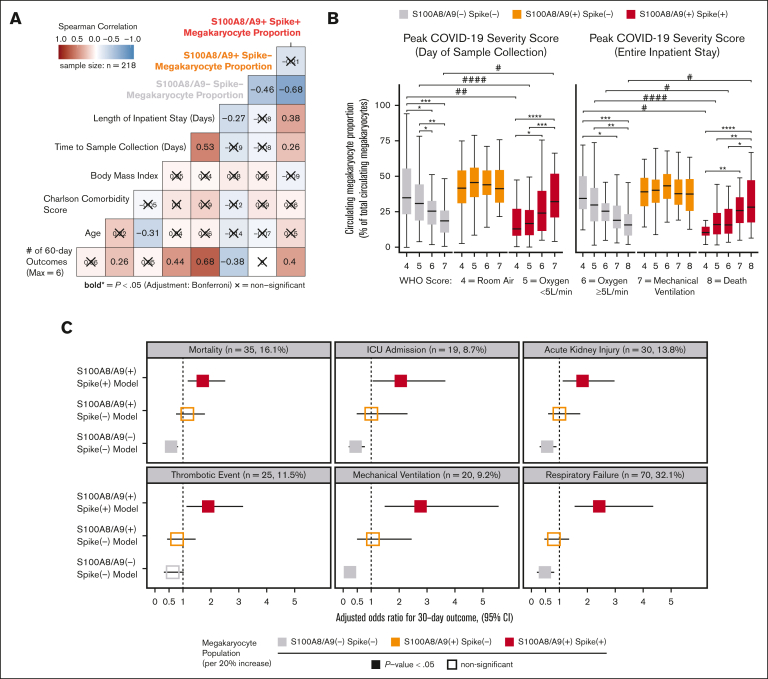
Several independent lines of evidence suggest that megakaryocytes are dysfunctional in severe COVID-19. Herein, we characterized peripheral circulating megakaryocytes in a large cohort of inpatients with COVID-19 and correlated the subpopulation frequencies with clinical outcomes. Using peripheral blood, we show that megakaryocytes are increased in the systemic circulation in COVID-19, and we identify and validate S100A8/A9 as a defining marker of megakaryocyte dysfunction. We further reveal a subpopulation of S100A8/A9+ megakaryocytes that contain severe acute respiratory syndrome coronavirus 2 (SARS-CoV-2) protein and RNA. Using flow cytometry of peripheral blood and in vitro studies on SARS-CoV-2-infected primary human megakaryocytes, we demonstrate that megakaryocytes can transfer viral antigens to emerging platelets. Mechanistically, we show that SARS-CoV-2-containing megakaryocytes are nuclear factor κB (NF-κB)-activated, via p65 and p52; express the NF-κB-mediated cytokines interleukin-6 (IL-6) and IL-1β; and display high surface expression of Toll-like receptor 2 (TLR2) and TLR4, canonical drivers of NF-κB. In a cohort of 218 inpatients with COVID-19, we correlate frequencies of megakaryocyte subpopulations with clinical outcomes and show that SARS-CoV-2-containing megakaryocytes are a strong risk factor for mortality and multiorgan injury, including respiratory failure, mechanical ventilation, acute kidney injury, thrombotic events, and intensive care unit admission. Furthermore, we show that SARS-CoV-2+ megakaryocytes are present in lung and brain autopsy tissues from deceased donors who had COVID-19. To our knowledge, this study offers the first evidence implicating SARS-CoV-2+ peripheral megakaryocytes in severe disease and suggests that circulating megakaryocytes warrant investigation in inflammatory disorders beyond COVID-19.


Conflict of interest statement

Conflict-of-interest disclosure: The authors declare no competing financial interests.

Figures

None
Graphical abstract
Figure 1.
Figure 1.
Circulating MKs are increased in COVID-19. (A) scRNA-seq dimensionality reduction using uniform manifold approximation and projection of 317 562 cells derived from 4 separate studies. MKs (4180 cells) are shown in red. (B) scRNA-seq marker genes used to identify circulating MKs. (C) Frequency of MKs relative to all cells from scRNA-seq samples. Median ± minimum/maximum. Kruskal–Wallis one-way ANOVA with Dunn post hoc multiple comparisons test. All groups compared with uninfected control. Adjusted P value ∗∗∗P = .001 to .0001. Mild-moderate: n = 15; severe: n = 14; early recovery (<7 days after first negative polymerase chain reaction [PCR] test): n = 8; late recovery (>14 days after first negative PCR test): n = 8; uninfected: n = 19. (D) Flow cytometry from UAB COVID-19 peripheral blood samples (n = 20) showing gating of CD61+ CD41+ DNA–positive MKs. The histogram shows ploidy distribution ranging from 2n to 32n. (E) Cytocentrifugation of FACS-sorted MKs stained with hematoxylin and eosin. (F) Representative flow cytometry plots showing the proportion of MKs relative to platelets in uninfected vs COVID-19 peripheral blood. (G) Quantification of MK frequency, relative to all live events, using flow cytometry on peripheral blood from uninfected (n = 9 donors) vs COVID-19 (n = 218 patients; 220 samples). Mean ± standard error of the mean (SEM). Unpaired 2-tailed t test with Welch correction; ∗∗∗∗P < .0001. ANOVA, analysis of variance.
Figure 2.
Figure 2.
Circulating MKs upregulate S100A8/A9 in COVID-19. (A) Volcano plot showing 1436 DEGs from scRNA-seq of MKs from severe COVID-19 vs uninfected controls. (B) Expression of S100A8 and S100A9 in MKs from scRNA-seq samples. Two-way ANOVA with Dunnett post hoc multiple comparisons test. All groups compared with uninfected controls. Adjusted P values: ∗P = .05 to .01; ∗∗P = .01 to .001; ∗∗∗P = .001 to .0001; ∗∗∗∗P < .0001. Black asterisks indicate S100A9 statistical comparisons. Red asterisks = S100A8 statistical comparisons. Severe: n = 14; mild-moderate: n = 15; early recovery (<7 days after first negative PCR test): n = 7; late recovery (>14 days after first negative PCR test): n = 5; uninfected: n = 16. (C) Flow cytometry quantification of S100A8/A9 expression in platelets vs MKs (n = 218 patients; 220 samples). Unpaired 2-tailed t test; ∗∗∗∗P < .0001. (D) Flow cytometry plots and quantification of S100A8/A9 expression in circulating MKs from uninfected controls (n = 9 donors) vs COVID-19 (n = 218 patients; 220 samples). Unpaired 2-tailed t test; ∗∗∗∗P < .0001. (E) PrimeFlow flow cytometry showing S100A8/A9 messenger RNA (mRNA) expression by S100A8/A9 protein expression in COVID-19 MKs. Quantification of S100A8/A9 mRNA expression in S100A8/A9+ MKs vs S100A8/A9 MKs (n = 3 donors). Unpaired 2-tailed t test; ∗∗∗∗P < .0001. (F) PrimeFlow flow cytometry showing IFITM3 mRNA expression by S100A8/A9 protein expression in COVID-19 MKs. Quantification of IFITM3 mRNA expression in S100A8/A9+ MKs vs S100A8/A9 MKs (n = 8 donors). Unpaired 2-tailed t test; ∗∗∗∗P < .0001. (G) Quantification of PrimeFlow IFI27 mRNA expression in S100A8/A9+ MKs vs S100A8/A9 MKs (n = 8 donors). Unpaired 2-tailed t test; ∗∗∗∗P < .0001. (H) Representative imaging flow cytometry from FACS-sorted S100A8/A9+ MKs vs S100A8/A9 MKs. (I) Histogram showing SSC-A granularity in S100A8/A9+ MKs vs S100A8/A9 MKs and quantification of SSC-A granularity in S100A8/A9+ MKs vs S100A8/A9 MKs (n = 218 patients; 220 samples). Unpaired 2-tailed t test; ∗∗∗∗P < .0001. All graphs are mean ± SEM. DEGs, differentially expressed genes.
Figure 3.
Figure 3.
A subpopulation of S100A8/A9+ MKs contain SARS-CoV-2. (A) Representative flow cytometry plot of circulating MKs showing 3 distinct subpopulations: S100A8/A9 spike protein–negative, S100A8/A9+ spike protein–negative, and S100A8/A9+ spike protein–positive. (B) Histogram showing PrimeFlow flow cytometry for SARS-CoV-2 RNA in circulating MKs. Quantification of SARS-CoV-2 RNA in the 3 MK subpopulations (n = 8 donors). One-way ANOVA with Tukey post hoc multiple comparisons test; adjusted P value is ∗P = .05 to .01 (C) Representative imaging flow cytometry from FACS-sorted MKs: S100A8/A9 spike protein–negative, S100A8/A9+ spike protein–negative, and S100A8/A9+ spike protein–positive. (D) Expression of proteins involved in SARS-CoV-2 viral infection in the 3 MK subpopulations (n = 7 donors). Mean fluorescent intensity of ACE2, TMPRSS2, and FURIN. Dashed lines represent the geometric mean for isotype controls. One-way ANOVA with Tukey post hoc multiple comparisons test; ∗P = .05 to .01; ∗∗P = .01 to .001; ∗∗∗P = .001 to .0001. (E) Immunofluorescence staining of lung tissue from a deceased patient who had COVID-19 with ARDS. (F) Immunofluorescence staining of brain tissue (cortex) from a deceased patient who had COVID-19. Five channels are shown in panels E-F: brightfield (black pigment from TrueView autofluorescence quencher), green (CD61), yellow (S100A8/A9), red (spike protein), and blue (Hoechst). All graphs are mean ± SEM. TMPRSS2, transmembrane protease serine 2.
Figure 4.
Figure 4.
SARS-CoV-2–containing MKs transfer viral antigen to platelets. (A) Representative flow cytometry plots of platelets from patients with COVID-19 with high and low virus–positive proportions. (B) Linear regression comparing virus–positive MK frequencies to virus–positive platelet frequencies (n = 218 patients; 220 samples). (C) DNA content analysis in circulating MKs using propidium iodide and RNase treatment. Quantification of DNA content in the 3 MK subpopulations (n = 218 patients; 220 samples). One-way ANOVA with Tukey post hoc multiple comparisons test; adjusted P value is ∗∗∗∗P < .0001. (D) Imaging flow cytometry of virus–positive MKs. White arrows indicate viral protein in emerging platelets. (E) Flow cytometry plots of platelets from primary human MKs infected with SARS-CoV-2 showing spike protein–containing platelets. (F) Quantification of virus+ platelets from primary human MKs (n = 6 cultures). Unpaired two-tailed t test; ∗P = .05 to .01. (G) Immunofluorescence of primary human MKs infected with SARS-CoV-2. Four channels are shown: CD61 (purple), acetylated tubulin (green), spike protein (red), and 4′,6-diamidino-2-phenylindole (DAPI; blue). All graphs show mean ± SEM.
Figure 5.
Figure 5.
SARS-CoV-2–containing MKs produce NF-κB-mediated cytokines and have a hyperactivated phenotype. (A) Flow cytometry plot of circulating MKs showing expression of NF-κB subunit p65. Quantification of p65 expression in the 3 MK subpopulations (n = 14 donors). (B) Flow cytometry plot of circulating MKs showing expression of NF-κB subunit p52/p100. Quantification of p52/p100 expression in the 3 MK subpopulations (n = 14 donors). (C-E) Histograms and accompanying quantification of PrimeFlow flow cytometry for cytokines in circulating MKs. (C) IL-6 (n = 8 donors), (D) IL-1β (n = 8 donors), and (E) TNF-α (n = 8 donors). (F-J) Percent positive quantification for immunomodulatory proteins from flow cytometry on circulating MKs (n = 14 donors), (F) TLR2, (G) TLR3, (H) TLR4, (I) ICAM1, and (J) HLA-DR. (K-N) Mean fluorescent intensity quantification of (K-L) MK activation markers and (M-N) MK drug targets. (K) P-selectin (n = 20 donors), (L) activated GPIIb/IIIa (n = 11 donors), (M) P2Y12 (n = 82 donors), and (N) PAR-1 (n = 138 donors). Dashed lines in panels K-N represent the geometric mean for the respective isotype control. Percent positive graphs for antibody-based stains in panels A-B,F-J represent percent positive relative to the respective isotype control. All statistical analyses were performed using one-way ANOVA with Tukey post hoc multiple comparisons test. All graphs are given as mean ± SEM. Adjusted P values are ∗P = .05 to .01; ∗∗P = .01 to .001; ∗∗∗P = .001 to .0001; ∗∗∗∗P < .0001. TNF-α, tumor necrosis factor α.
Figure 6.
Figure 6.
SARS-CoV-2–containing MKs are associated with mortality and severe adverse events in COVID-19. (A) Spearman correlation analysis of continuous candidate model variables and cumulative 60-day postadmission outcomes for each patient (respiratory failure, mechanical ventilation, acute kidney injury, thrombotic events, ICU admission, and death). Each patient was limited to the first occurrence of a given outcome, resulting in a cumulative outcome maximum of 6. Statistical significance was assessed using Spearman correlation with Bonferroni P value adjustment for multiple hypothesis testing between candidate variables (X = nonsignificant; bold text, P value < .05). (B) Analyses comparing the WHO scale of COVID-19 severity on the day of sample collection (left) and peak severity during the entire inpatient stay (right) vs the circulating MK frequency for each subpopulation (∗ indicates intragroup and # indicates intergroup; ∗/# = 0.05-0.01, ∗∗/## = 0.01-0.001, ∗∗∗/### = 0.001-0.0001, ∗∗∗∗/#### < 0.0001). (C) Multivariate logistic regression models showing the likelihood of selected 30-day outcomes per 20% increase in each MK subpopulation (3 models per outcome; age, body mass index, and preadmission Charlson comorbidity score covariables not shown). Bootstrapped 95% CIs (n = 1000 bootstraps) are denoted as a bar to the right and left of each corresponding adjusted OR square. Event rates for each outcome are shown above each set of models. Statistical significance was assessed using the Wald test and is denoted by solid or open squares. Outcomes were determined using ICD-10 billing codes from each patient encounter. See supplemental Table 1 and supplemental Figures 8-10 for a complete breakdown of outcome billing codes and supplemental Tables 2-4 for regression model details.

Comment in

References

    1. Lefrancais E, Ortiz-Munoz G, Caudrillier A, et al. The lung is a site of platelet biogenesis and a reservoir for haematopoietic progenitors. Nature. 2017;544(7648):105–109. - PMC - PubMed
    1. Pariser DN, Hilt ZT, Ture SK, et al. Lung megakaryocytes are immune modulatory cells. J Clin Invest. 2021;131(1):e137377. - PMC - PubMed
    1. Tavassoli M, Aoki M. Migration of entire megakaryocytes through the marrow--blood barrier. Br J Haematol. 1981;48(1):25–29. - PubMed
    1. Woods MJ, Greaves M, Smith GH, Trowbridge EA. The fate of circulating megakaryocytes during cardiopulmonary bypass. J Thorac Cardiovasc Surg. 1993;106(4):658–663. - PubMed
    1. Dejima H, Nakanishi H, Kuroda H, et al. Detection of abundant megakaryocytes in pulmonary artery blood in lung cancer patients using a microfluidic platform. Lung Cancer. 2018;125:128–135. - PubMed

Publication types