. 2023 Mar 28;42(3):112244.
doi: 10.1016/j.celrep.2023.112244. Epub 2023 Mar 14.

A combinatorial approach to uncover an additional Integrator subunit

Affiliations

A combinatorial approach to uncover an additional Integrator subunit

Sarah R Offley et al. Cell Rep. .

Abstract

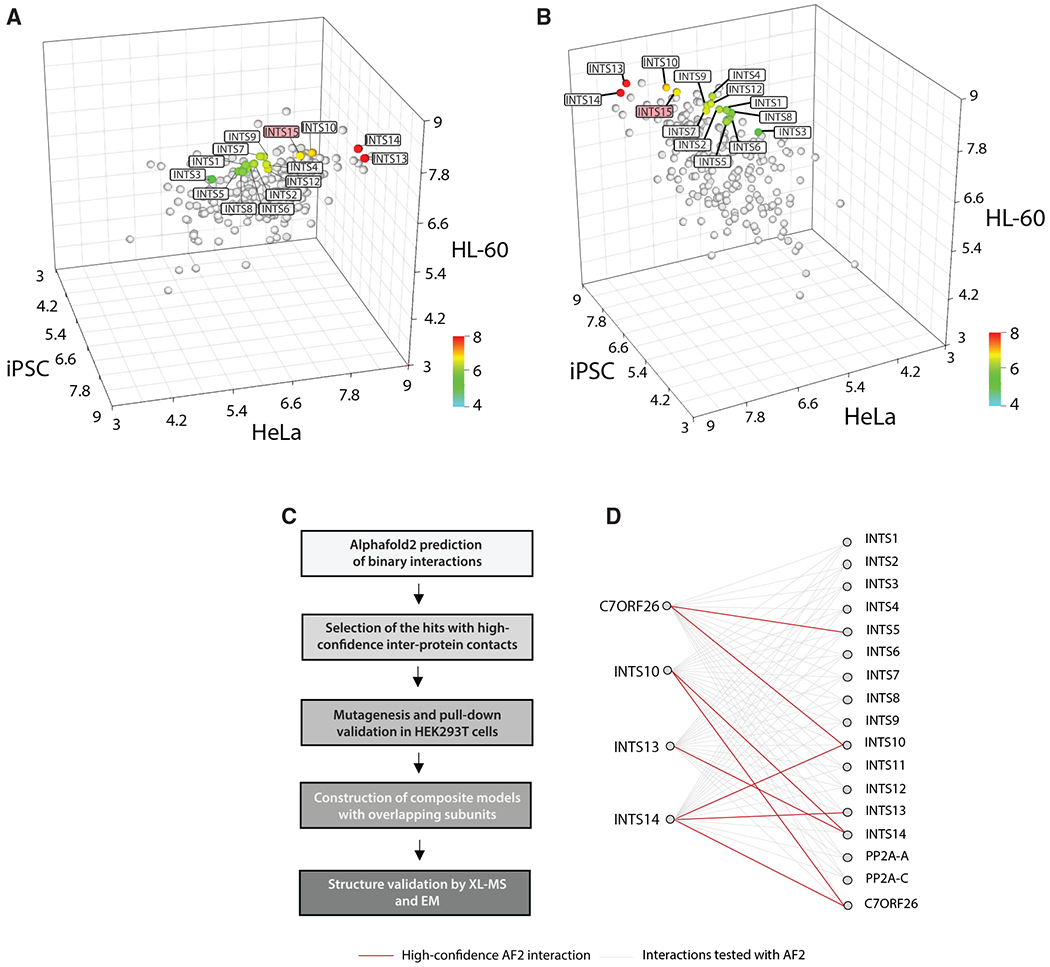
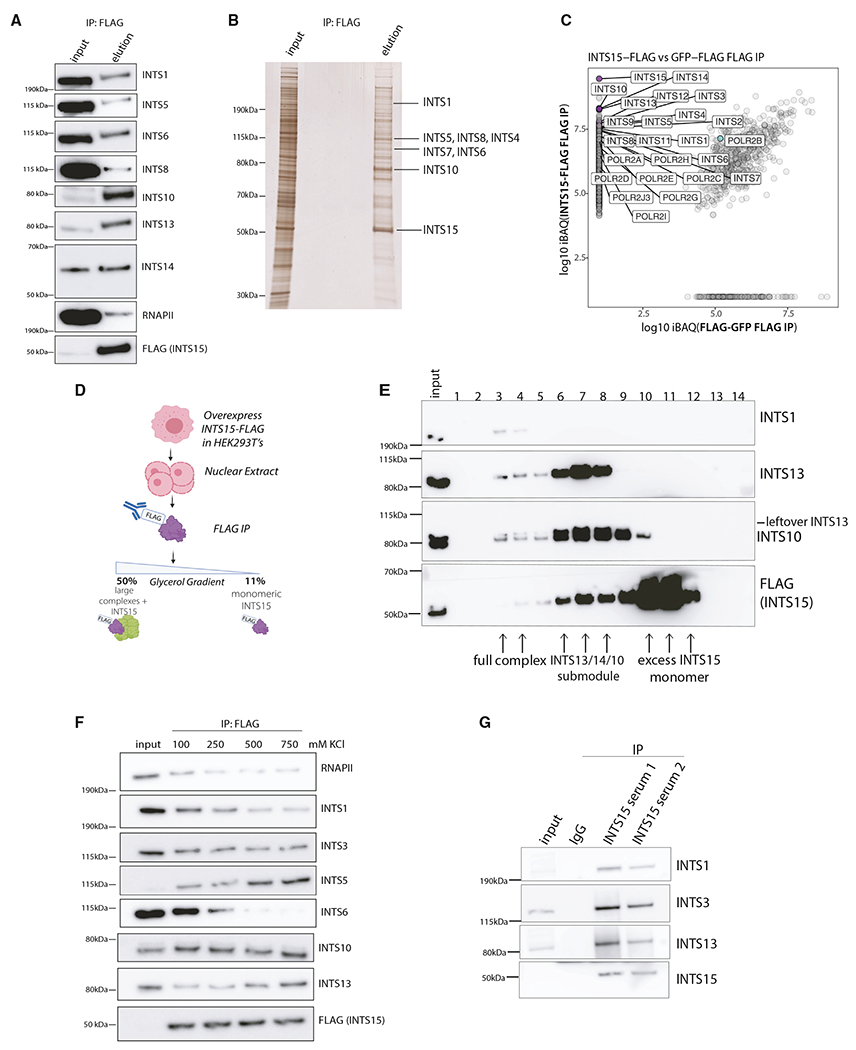
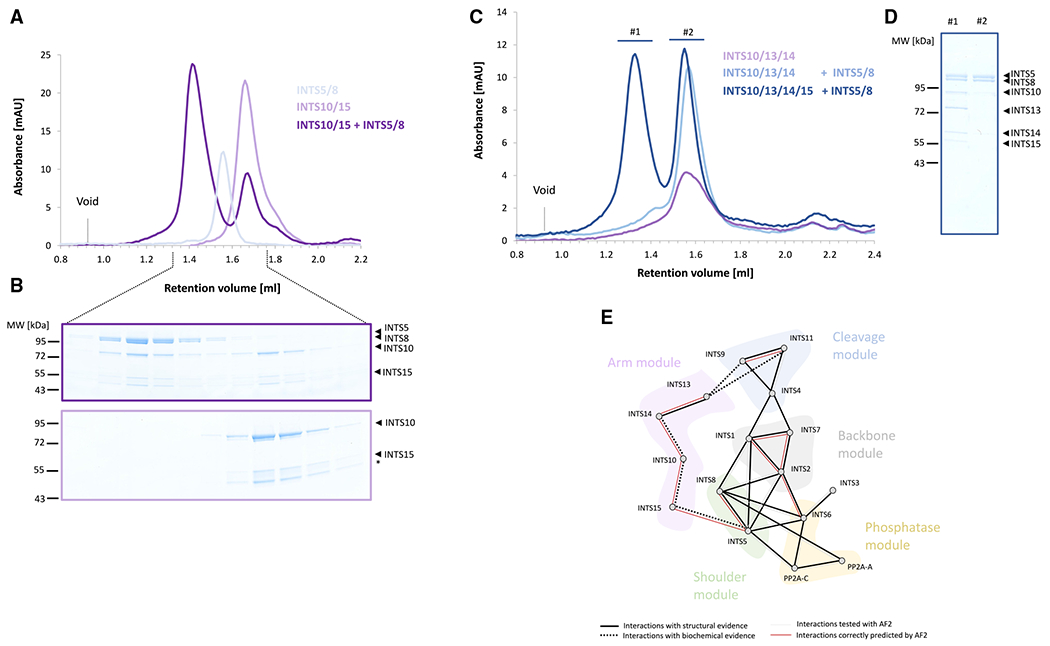
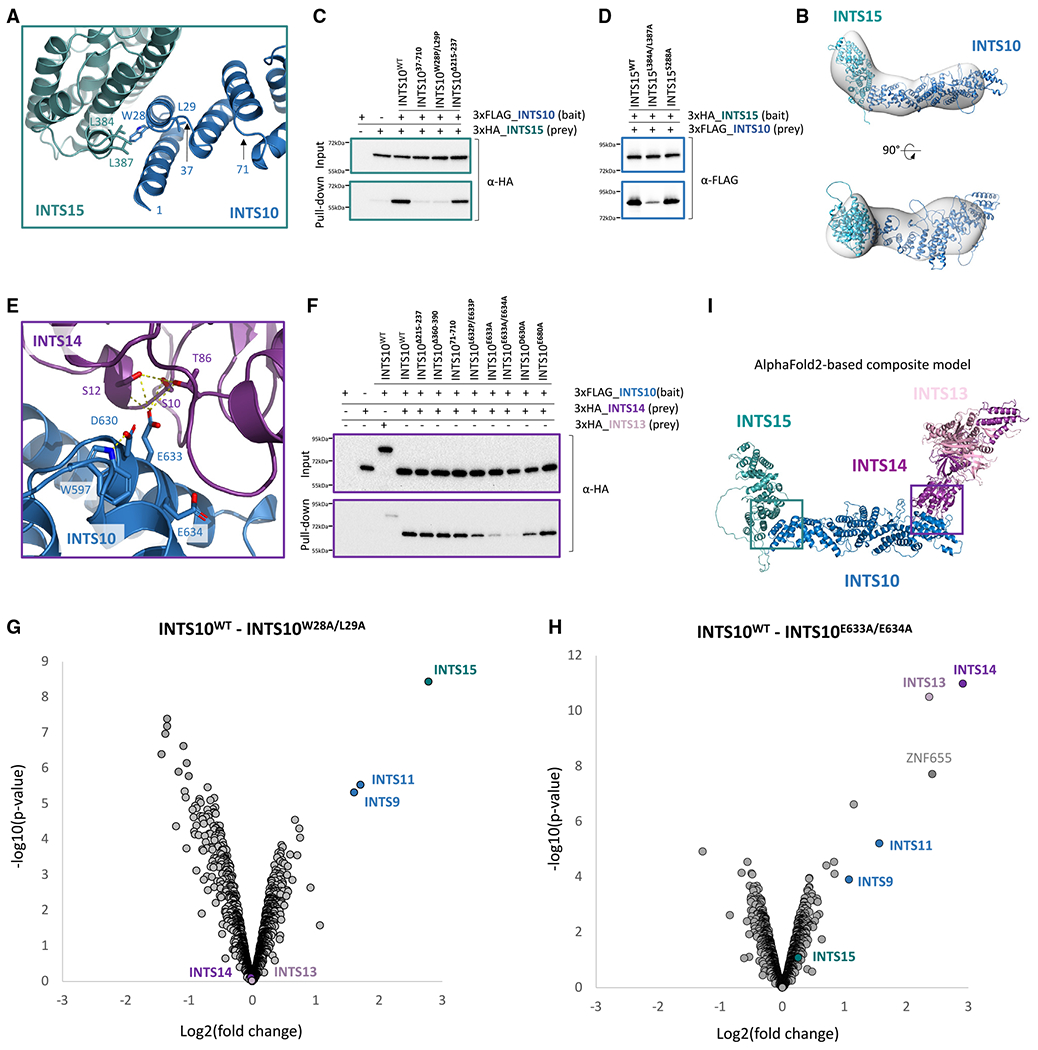
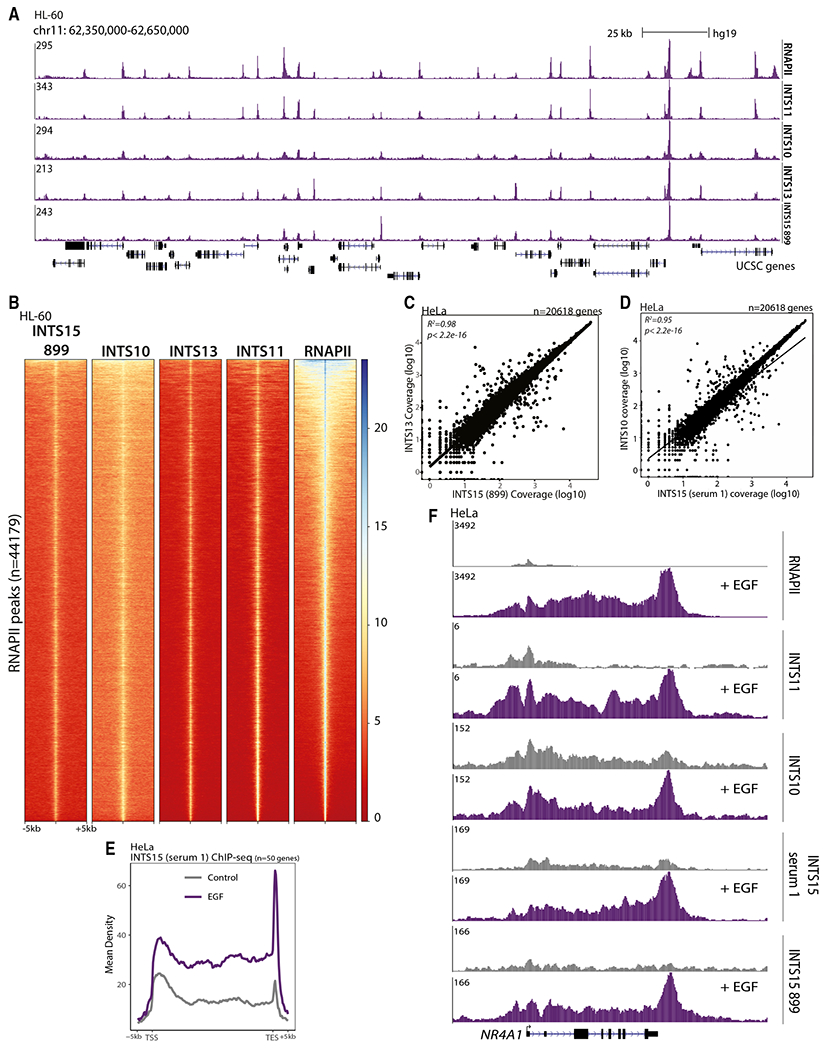
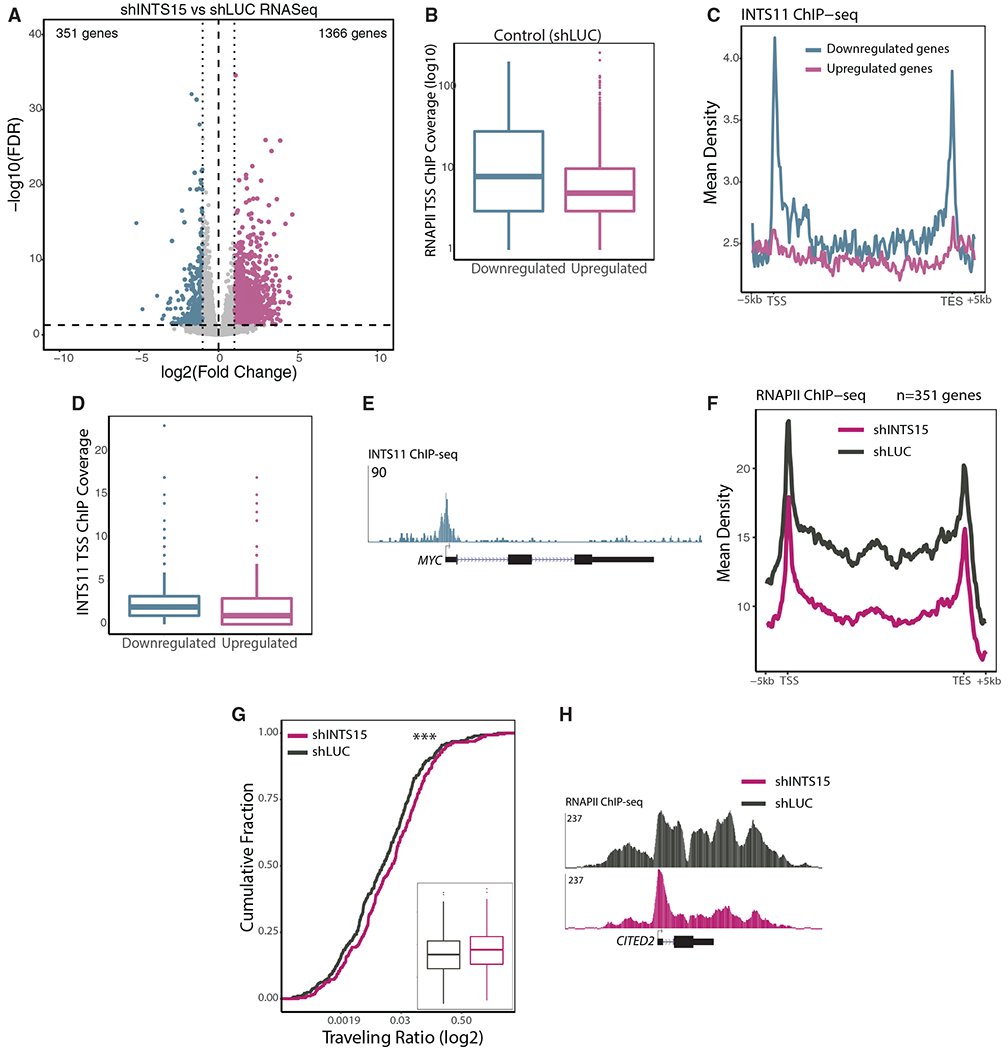
RNA polymerase II (RNAPII) controls expression of all protein-coding genes and most noncoding loci in higher eukaryotes. Calibrating RNAPII activity requires an assortment of polymerase-associated factors that are recruited at sites of active transcription. The Integrator complex is one of the most elusive transcriptional regulators in metazoans, deemed to be recruited after initiation to help establish and modulate paused RNAPII. Integrator is known to be composed of 14 subunits that assemble and operate in a modular fashion. We employed proteomics and machine-learning structure prediction (AlphaFold2) to identify an additional Integrator subunit, INTS15. We report that INTS15 assembles primarily with the INTS13/14/10 module and interfaces with the Int-PP2A module. Functional genomics analysis further reveals a role for INTS15 in modulating RNAPII pausing at a subset of genes. Our study shows that omics approaches combined with AlphaFold2-based predictions provide additional insights into the molecular architecture of large and dynamic multiprotein complexes.

Keywords: AlphaFold2; CP: Neuroscience; Integrator complex; RNA polymerase II; RNA polymerase II pausing; large protein complexes; molecular modeling; omics; pause-release; transcription; transcription factors; transcriptional regulation.


Conflict of interest statement

Declaration of interests The authors declare no competing interests.

Figures

Figure 1.
Figure 1.. Identification of C7ORF26 (INTS15)
(A) 3D scatterplot of INTS13 IP-MS in HeLa, iPSC, and HL-60 nuclear extract. Log10 (iBAQ) protein scores are plotted for shared interactors of INTS13 across all three cell types. Color scale indicates the log10 (iBAQ) values of Integrator subunits and INTS15. (B) An alternate angle of (A). (C) An overview of the experimental approach used to study the INTS15 interaction network. (D) Interactions between different Integrator subunits tested in this study by predicting structures of binary complexes with AlphaFold2. See Figures S1 and S2.
Figure 2.
Figure 2.. INTS15-FLAG interacts with the Integrator complex
(A) FLAG IP of a stably expressing INTS15-FLAG HEK-293T cell line. Western blot was probed for INTS1, INTS5, INTS6, INTS8, INTS10, INTS13, INTS14, RNAPII (RPB1), and INTS15 (FLAG). Input lane is 5% of the starting material. (B) Silver stain of INTS15-FLAG IP eluate shown in (A). Labels indicate bands that were excised and identified through LC-MS/MS. (C) IP-MS of FLAG IPs from INTS15-FLAG and GFP-FLAG nuclear extracts. Correlation plot compares log10 iBAQ values for each IP-MS. (D) Schematic of experimental design for (E). A FLAG IP was performed on the INTS15-FLAG stable HEK-293T cell line, followed by glycerol gradient. (E) Glycerol gradient fractionation of INTS15-FLAG IP. Fraction 1 represents 50% glycerol, while fraction 14 represents 11% glycerol. Integrator subunits INTS1, INTS13, INTS10, and INTS15 (FLAG) were probed in the western blot. (F) FLAG IP western blot of nuclear INTS15-FLAG performed in different salt conditions (100–750 mM KCl). Salt conditions indicated were used in both the IP buffer and wash buffers. Input is 2% of starting material. Western blot was probed for RNAPII (Rpb1), INTS1, INTS3, INTS5, INTS6, INTS10, INTS13, and INTS15-FLAG. (G) Endogenous co-IPs using rabbit sera from two house-made polyclonal antibodies raised against recombinant INTS15 with rabbit immunoglobulin G (IgG) used as a control. Input represents 5% of the original starting material. INTS1, INTS3, INTS13, and INTS15 were probed in the western blot. See Figure S3.
Figure 3.
Figure 3.. In vitro reconstitution of the INTS15-containing complexes
(A) Size-exclusion chromatograms of recombinantly expressed INTS10/15, INTS5/8, and INTS10/15 mixed with INTS5/8. (B) SDS-PAGE analysis of the fractions from (A). Partially proteolyzed INTS15 is indicated with an asterisk (*). (C) Size-exclusion chromatograms of recombinantly expressed INTS10/13/14, INTS10/13/14 mixed with INTS5/8, and INTS10/13/14/15 mixed with INTS5/8. (D) SDS-PAGE analysis of the pooled peak fractions of INTS10/13/14/15 + INTS5/8 sample as indicated in (C). (E) Overview of known and newly discovered binary interactions within the Integrator-PP2A complex. See Figures S3 and S4.
Figure 4.
Figure 4.. Architecture of the Integrator Arm module
(A) INTS10/INTS15 interface predicted by AF2. (B) Predicted structure of the INTS10/15 complex fitted into negative-stain EM reconstruction showing an approximate L-shape of the complex. (C) Mutagenesis and INTS10 pull-down experiment validating the interface observed in (A). (D) Mutagenesis and INTS15 pull-down experiment validating the interface observed in (A). (E) INTS10/INTS14 interface predicted by AF2. (F) Mutagenesis and INTS10 pull-down experiment validating the interface observed in (E). (G) Differential quantitative proteomics experiment of the 3xHA_INTS10WT and 3xHA_ INTS10W28A/L29A variant transiently expressed in HEK-293T cells and purified on hemagglutinin (HA)-agarose resin. (H) Differential quantitative proteomics experiment of the 3xHA_INTS10WT and 3xHA_ INTS10E633A/E634A variant transiently expressed in HEK-293T cells and purified on HA-agarose resin. (I) Composite model of the Integrator Arm module based on validated AF2 interfaces. See Figure S5.
Figure 5.
Figure 5.. Genomic recruitment of INTS15
(A) Representative ChIP-seq profiles of RNAPII, INTS11, INTS10, INTS13, and INTS15 (899 = Sigma HPA042899) in HL-60 cells showing localization to promoters and enhancers. Scale bar represents 25 kb. (B) Heatmap of INTS15 (899), INTS10, INTS13, INTS11, and RNAPII ChIP-seq coverage at all RNAPII peaks found in HL-60 (n = 44,179). (C) Correlation plot of INTS13 and INTS15 (899) ChIP-seq coverage at all RNAPII genes (n = 20,618) in HeLa cells analyzed by Pearson’s correlation coefficient. (D) Correlation plot of INTS10 and INTS15 (serum 1) ChIP-seq coverage at all RNAPII genes (n = 20,618) in HeLa cells analyzed by Pearson’s correlation coefficient. (E) Average profile of INTS15 (serum 1) ChIP-seq with and without epidermal growth factor (EGF) treatment in HeLa cells at 50 EGF-responsive genes. EGF treatment is indicated in purple. (F) Representative ChIP-seq track of RNAPII, INTS11, INTS10, and INTS15 (serum 1 and 899) upon EGF induction (purple) at the NR4A1 locus in HeLa cells. See Figure S6.
Figure 6.
Figure 6.. Differential gene expression with INTS15 depletion
(A) Volcano plot showing differentially expressed genes from total RNA-seq in HeLa cells with INTS15 depletion across three independent replicates. (B) Boxplot quantifying RNAPII ChIP-seq coverage in shLUC control HeLa cells at the transcription start site (TSS) of the downregulated (blue) and upregulated (pink) gene subsets. (C) Average profile of INTS11 ChIP-seq in WT HeLa cells at the downregulated (blue) and upregulated (pink) gene subsets. (D) Boxplot quantifying INTS11 ChIP-seq coverage in WT HeLa cells at the TSS of the downregulated (blue) and upregulated (pink) gene subsets. (E) Representative example of INTS11 ChIP-seq signal in WT conditions at the MYC locus. (F) Average profile of spike-in normalized RNAPII ChIP-seq in HeLa cells with INTS15 depletion (pink) at downregulated genes. (G) Traveling ratio of RNAPII calculated at the downregulated genes for HeLa cells with INTS15 depletion (pink). Boxplot inlet shows quantification of the traveling ratios for each condition. RNAPII traveling ratio was calculated by taking the RNAPII ChIP coverage at the TSS and comparing it with the coverage at the gene body. Significance was analyzed by unpaired, two-sided Student’s t test. ***p < 0.001. (H) Representative example of RNAPII ChIP-seq signal at the CITED2 locus in HeLa cells with INTS15 depletion. See Figure S7.

Similar articles

Cited by

References

    1. Schier AC, and Taatjes DJ (2020). Structure and mechanism of the RNA polymerase II transcription machinery. Genes Dev. 34, 465–488. 10.1101/gad.335679.119. - DOI - PMC - PubMed
    1. Allen BL, and Taatjes DJ (2015). The Mediator complex: a central integrator of transcription. Nat. Rev. Mol. Cell Biol 16, 155–166. 10.1038/nrm3951. - DOI - PMC - PubMed
    1. Chen X, Qi Y, Wu Z, Wang X, Li J, Zhao D, Hou H, Li Y, Yu Z, Liu W, et al. (2021). Structural insights into preinitiation complex assembly on core promoters. Science 372, aba8490. 10.1126/science.aba8490. - DOI - PubMed
    1. Core L, and Adelman K (2019). Promoter-proximal pausing of RNA polymerase II: a nexus of gene regulation. Genes Dev. 33, 960–982. 10.1101/gad.325142.119. - DOI - PMC - PubMed
    1. Welsh SA, and Gardini A (2022). Multitasking genome regulation by the Integrator protein complex. Nat. Rev. Mol. Cell Biol 24, 204–220. 10.1038/s41580-022-00534-2. - DOI - PMC - PubMed

Publication types

MeSH terms

Substances