. 2023 Mar 21;120(12):e2301414120.
doi: 10.1073/pnas.2301414120. Epub 2023 Mar 15.

Autolysin-mediated peptidoglycan hydrolysis is required for the surface display of Staphylococcus aureus cell wall-anchored proteins

Affiliations

Autolysin-mediated peptidoglycan hydrolysis is required for the surface display of Staphylococcus aureus cell wall-anchored proteins

Allison C Leonard et al. Proc Natl Acad Sci U S A. .

Abstract

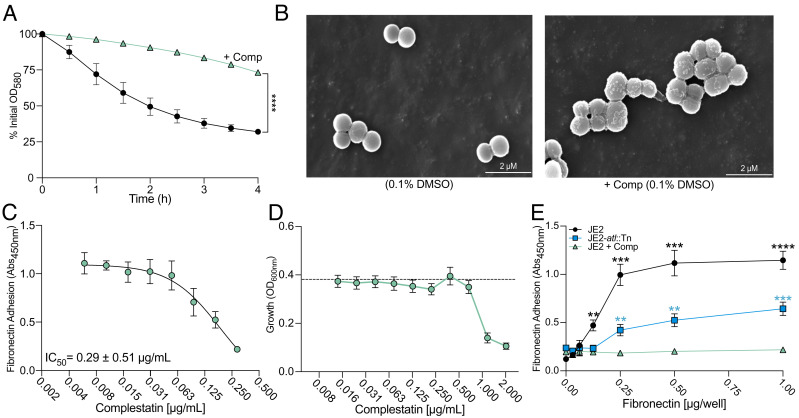
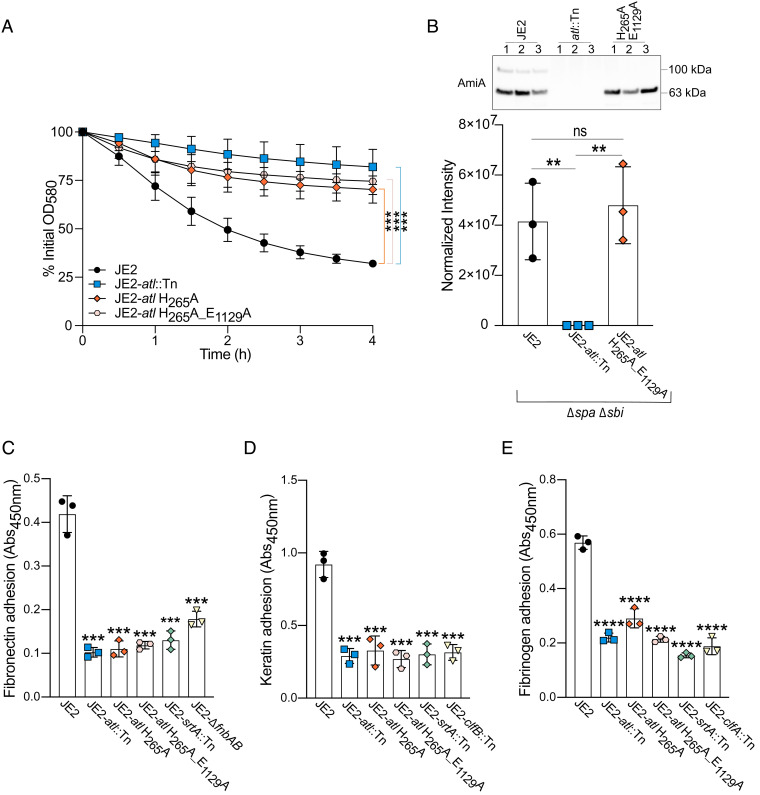
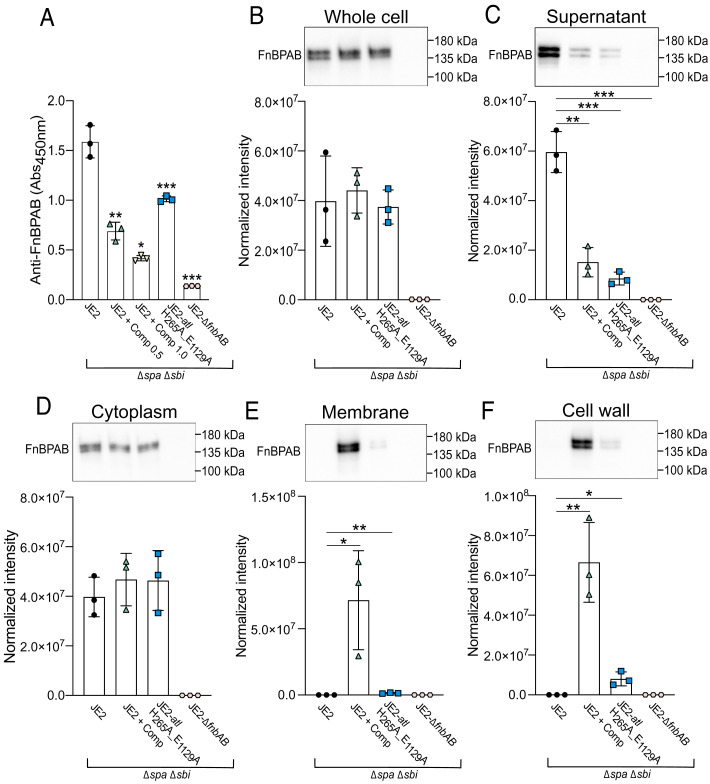
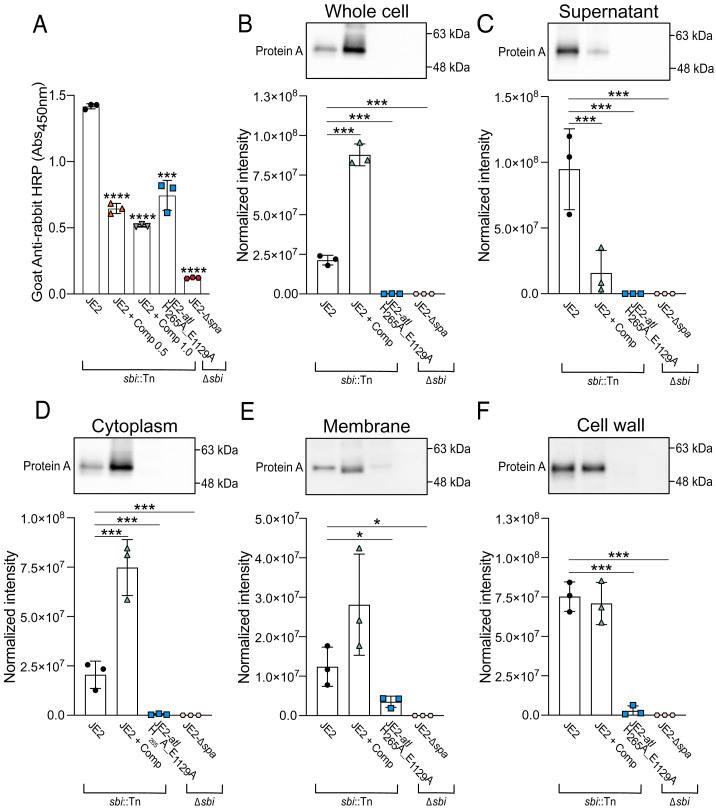
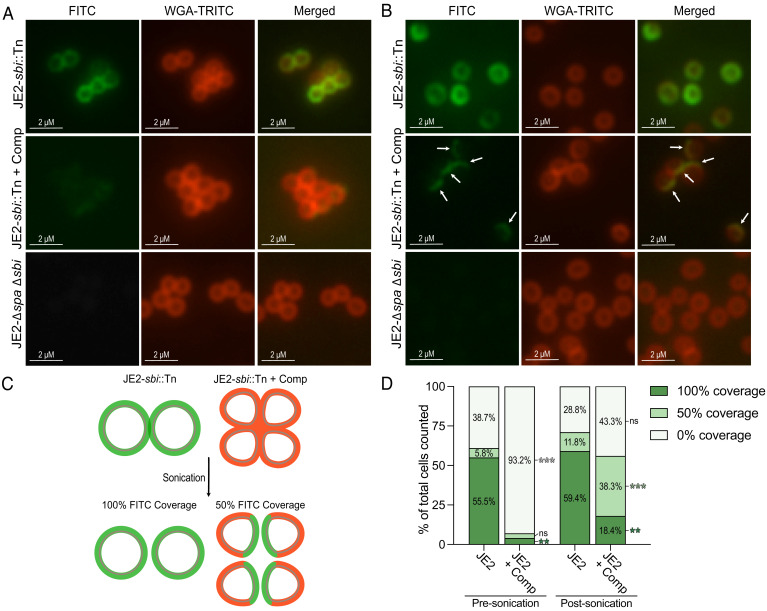
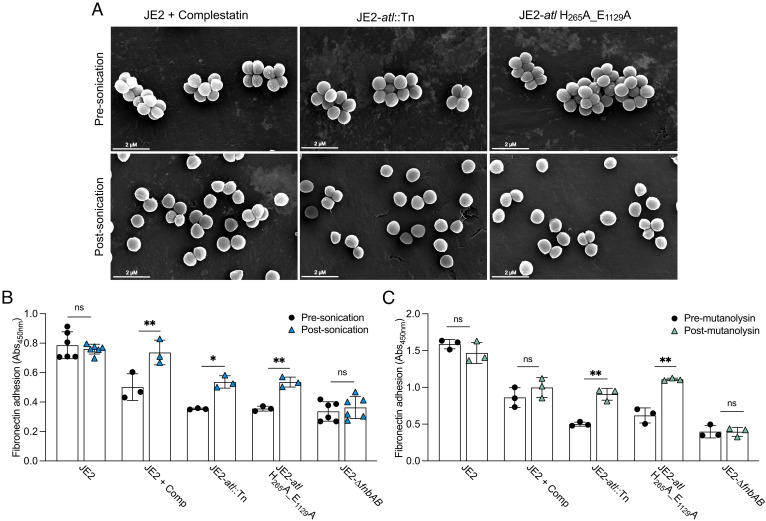
Peptidoglycan hydrolases, or autolysins, play a critical role in cell wall remodeling and degradation, facilitating bacterial growth, cell division, and cell separation. In Staphylococcus aureus, the so-called "major" autolysin, Atl, has long been associated with host adhesion; however, the molecular basis underlying this phenomenon remains understudied. To investigate, we used the type V glycopeptide antibiotic complestatin, which binds to peptidoglycan and blocks the activity of autolysins, as a chemical probe of autolysin function. We also generated a chromosomally encoded, catalytically inactive variant of the Atl enzyme. Autolysin-mediated peptidoglycan hydrolysis, in particular Atl-mediated daughter cell separation, was shown to be critical for maintaining optimal surface levels of S. aureus cell wall-anchored proteins, including the fibronectin-binding proteins (FnBPs) and protein A (Spa). As such, disrupting autolysin function reduced the affinity of S. aureus for host cell ligands, and negatively impacted early stages of bacterial colonization in a systemic model of S. aureus infection. Phenotypic studies revealed that Spa was sequestered at the septum of complestatin-treated cells, highlighting that autolysins are required to liberate Spa during cell division. In summary, we reveal the hydrolytic activities of autolysins are associated with the surface display of S. aureus cell wall-anchored proteins. We demonstrate that by blocking autolysin function, type V glycopeptide antibiotics are promising antivirulence agents for the development of strategies to control S. aureus infections.

Keywords: Staphylococcus aureus; antibiotic resistance; autolysins; host adhesion; virulence.


Conflict of interest statement

The authors declare no competing interest.

Figures

Fig. 1.
Fig. 1.
Complestatin inhibits S. aureus adhesion to fibronectin at concentrations subinhibitory for growth. (A) Detergent-induced whole-cell autolysis assay of MRSA USA300 JE2 clone LAC (JE2) (black) and complestatin-treated cells (green). (B) Scanning electron microscopy (SEM) analysis of JE2 and complestatin-treated cells (0.5 µg/mL). (C) Measurement of the complestatin half-maximal inhibitory concentration (IC50) using ELISA-based fibronectin (1.0 µg/well) adhesion assays (Abs450nm). (D) End-point readings to assess the growth (OD600nm) of JE2 in the presence of complestatin. Each data point represents the average of three biological replicates ± the SD, and each biological replicate represents the mean of eight technical replicates. The dashed black line is the mean of 24 replicates of JE2 grown in the presence of 1% DMSO as a no drug solvent control. Adhesion assays were performed at complestatin concentrations that were subinhibitory (≤0.5 µg/mL) for growth, as determined by statistical analysis and comparison to the solvent control. (E) Fibronectin adhesion assay of JE2 (black), complestatin-treated cells (0.5 µg/mL) (green), and an atl inactivated mutant (JE2-atl::Tn) (blue). All data points represent the average of three biological replicates ± the SD. P-values were calculated using the two-tailed unpaired Student’s t test. Statistical analyses of complestatin-treated cells compared with JE2 (1% DMSO) are represented by black asterisks. Complestatin compared with JE2-atl::Tn (1% DMSO) is represented by blue asterisks. Statistically significant decreases are denoted as P ≤ 0.01**; P ≤ 0.001***, P ≤ 0.0001****, related to SI Appendix, Fig. S1.
Fig. 2.
Fig. 2.
Autolysin (Atl) catalytic function is required for S. aureus adhesion to host ligands. (A) Whole-cell detergent-induced autolysis assays confirmed that the Atl catalytic mutant strains were inactive. Each data point represents the average of three biological replicates ± the SD. (B) Immunoblots of culture supernatants from JE2 (Δspa Δsbi) (black) and the catalytically inactive atl variant (JE2-atl H265A_E1129A Δspa Δsbi) (orange). JE2-atl::Tn (blue) was included as a negative control. Each data point represents the average of three technical replicates for a single biological replicate ± the SD. Representative immunoblots of one technical replicate of each biological replicate (labeled 1 to 3) are shown. AmiA intensity was normalized to total protein (SI Appendix, Fig. S2C) using stain-free imaging. ELISA-based adhesion assays (Abs450nm) of (C) fibronectin (0.5 μg/well), (D) keratin (0.125 μg/well), and (E) fibrinogen (0.25 μg/well). Isogenic adhesion defective control strains were also included [atl transposon mutant (JE2-atl::Tn), sortase A transposon mutant (JE2-srtA::Tn), and mutants of the host ligand’s respective cell wall-anchored adhesins (fibronectin-fnbAB; keratin-clfB; fibrinogen-clfA)]. Each data point represents a single biological replicate ± the SD. P-values were calculated using the two-tailed unpaired Student’s t test comparing each mutant with the wild-type strain (JE2). Statistically significant decreases are denoted as P ≤ 0.01**, P ≤ 0.001***, and P ≤ 0.0001****. NS = not significant, related to SI Appendix, Fig. S5.
Fig. 3.
Fig. 3.
Autolysin function is important for maintaining optimal surface levels of the S. aureus fibronectin-binding proteins (FnBPs). (A) ELISA-based (Abs450nm) detection of surface-exposed FnBPs on JE2 (Δspa Δsbi), complestatin-treated (0.5 and 1.0 µg/mL) cells (Δspa Δsbi) and JE2-atl H265A_E1129A (Δspa Δsbi). A mutant lacking the FnBPs (JE2-∆fnbAB Δspa Δsbi) was included as a negative control. (B) Immunoblot analysis of FnBP abundance in lysed whole cells, (C) culture supernatants, (D) cytoplasmic fractions, (E) cell wall fractions, and (F) membrane fractions. For all immunoblots, the data points represent the cumulative normalized intensity of FnBPA and FnBPB from the average of three technical replicates of a single biological replicate ± the SD. Representative immunoblots from one biological replicate are shown. P-values were calculated using the two-tailed unpaired Student’s t test comparing each mutant with the wild-type strain (JE2). Statistically significant decreases in adhesion and normalized intensity compared with JE2 were denoted as P ≤ 0.05*, P ≤ 0.01**, P ≤ 0.001***, and P ≤ 0.0001****. Protein abundance was normalized to total protein using a stain-free approach, related to SI Appendix, Figs. S7 and S8.
Fig. 4.
Fig. 4.
Autolysin function is important for maintaining optimal surface levels of S. aureus protein A (Spa). (A) ELISA-based (Abs450nm) detection of IgG-antibody adhesion to Spa exposed on the surface of immobilized whole cells of JE2 (sbi::Tn), complestatin-treated (0.5 and 1.0 µg/mL) JE2-sbi::Tn and JE2-atl H265A_E1129A cells (∆spa). A mutant lacking Spa (JE2-∆spa ∆sbi) was included as a negative control. (B) Immunoblot analysis of Spa abundance in lysed whole cells, (C) culture supernatants, (D) cytoplasm fractions, (E) cell wall fractions, and (F) membrane fractions. For each immunoblot, data points represent the average of three technical replicates for a single biological replicate ± the SD. Representative immunoblots from one biological replicate are shown. P-values were calculated using the two-tailed unpaired Student’s t test comparing each mutant with the wild-type strain (JE2). Statistically significant decreases in adhesion and normalized intensity compared with JE2 were denoted as P ≤ 0.05*, P ≤ 0.01**, P ≤ 0.001***, and P ≤ 0.0001****. Protein abundance was normalized to total protein using a stain-free approach, related to SI Appendix, Fig. S10.
Fig. 5.
Fig. 5.
Spa is masked at the septum of complestatin-treated S. aureus cells. (A) Representative immunofluorescence microscopy images assessing Spa localization [IgG goat anti-mouse FITC-conjugated antibody (green)] on the surface of JE2 (JE2-sbi::Tn) cells ± complestatin (0.5 µg/mL). WGA-TRITC (red) was used to stain the cell wall. JE2-∆spasbi was included as a negative control. (B) Representative immunofluorescence microscopy images assessing Spa localization following mechanical separation using gentle sonication. The arrows indicate Spa concentrated on one face of the separated cells. (C) Schematic representation of the immunofluorescence microscopy results. Green represents visible FITC and red represents visible WGA-TRITC in the absence of FITC on complestatin-treated cells. Mechanical disruption of complestatin-induced cell clusters liberated Spa from the division septum. (D) Measuring FITC coverage in complestatin-treated cells compared with the untreated cells, prior to and following mechanical separation of cell clusters using gentle sonication. 100% coverage = concentric Spa distribution; 50% coverage = Spa concentration on one face of the cell; 0% = minimal to no detectable signal. An average of 280 cells were counted per sample for a total of three biological replicates per strain both presonication and postsonication. For each strain, the average percentage of total cells counted for three biological replicates is shown. Statistically significant differences in Spa localization of complestatin-treated cells compared with JE2 are denoted as P ≤ 0.01**, P ≤ 0.001***. P-values were calculated using the two-tailed unpaired Student’s t test. (Scale bars, left, 2 µM.) FITC: Fluorescein isothiocyanate; WGA-TRITC: wheat germ albumin-tetramethylrhodamine, related to SI Appendix, Fig. S11.
Fig. 6.
Fig. 6.
Mechanical and enzymatic separation of autolysin-associated cell clusters enhanced S. aureus adhesion to fibronectin. (A) SEM analysis of autolysin-deficient strains presonication and postsonication. (B) Fibronectin ELISA-based whole-cell adhesion assays (Abs450nm) presonication (black) and postsonication (blue). (C) Fibronectin ELISA-based whole-cell adhesion assays premutanolysin (black) and postmutanolysin treatment (green) of Atl-inactivated strains. A mutant lacking the FnBPs (JE2-∆fnbAB) was included as an adhesion defective control. Each data point represents a single biological replicate ± the SD. P-values were calculated using the two-tailed unpaired Student’s t test comparing each strain with the presonication samples. Statistically significant differences were denoted as P ≤ 0.05*, P ≤ 0.01**, related to SI Appendix, Fig. S12.

References

    1. Berry K. A., Verhoef M. T. A., Leonard A. C., Cox G., Staphylococcus aureus adhesion to the host. Ann. N. Y. Acad. Sci. 1515, 75–96 (2022). - PubMed
    1. Foster T. J., Geoghegan J. A., Ganesh V. K., Höök M., Adhesion, invasion and evasion: The many functions of the surface proteins of Staphylococcus aureus. Nat. Rev. Microbiol. 12, 49–62 (2014). - PMC - PubMed
    1. Leonard A. C., Petrie L. E., Cox G., Bacterial anti-adhesives: Inhibition of Staphylococcus aureus nasal colonization. ACS Infect. Dis. 5, 1668–1681 (2019). - PubMed
    1. Petrie L. E., Leonard A. C., Murphy J., Cox G., Development and validation of a high-throughput whole-cell assay to investigate Staphylococcus aureus adhesion to host ligands. J. Biol. Chem. 295, 16700–16712 (2020). - PMC - PubMed
    1. Biswas R., et al. , Activity of the major staphylococcal autolysin Atl. FEMS Microbiol. Lett. 259, 260–268 (2006). - PubMed

Publication types

MeSH terms