. 2023 Jun 28;14(7):497-512.
doi: 10.1093/procel/pwac061.

Single-nucleus profiling unveils a geroprotective role of the FOXO3 in primate skeletal muscle aging

Affiliations

Single-nucleus profiling unveils a geroprotective role of the FOXO3 in primate skeletal muscle aging

Ying Jing et al. Protein Cell. .

Abstract

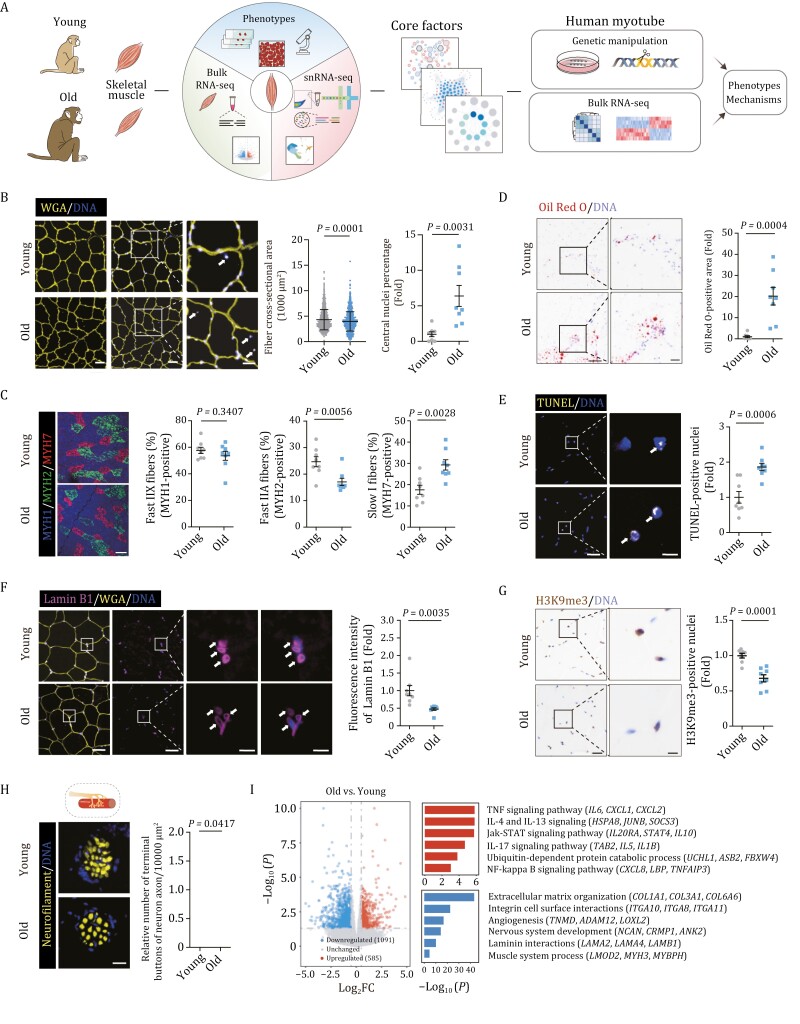
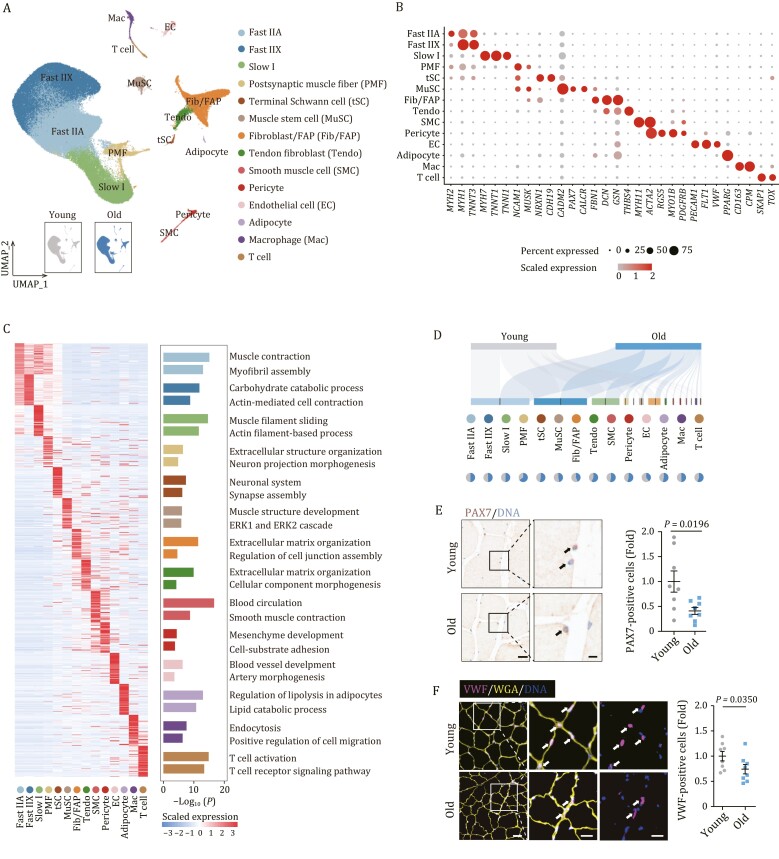
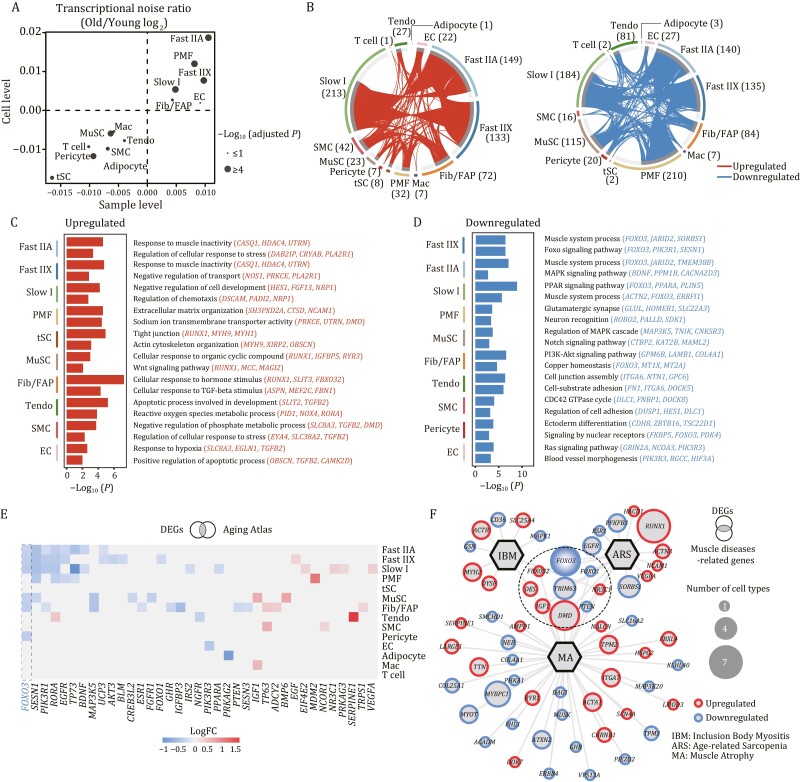
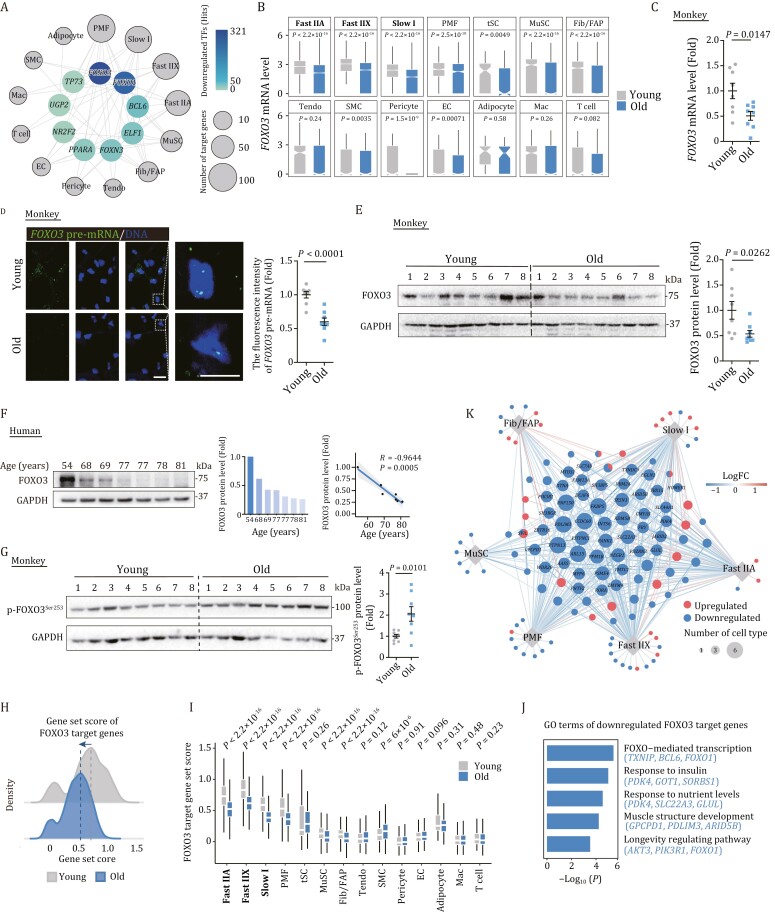
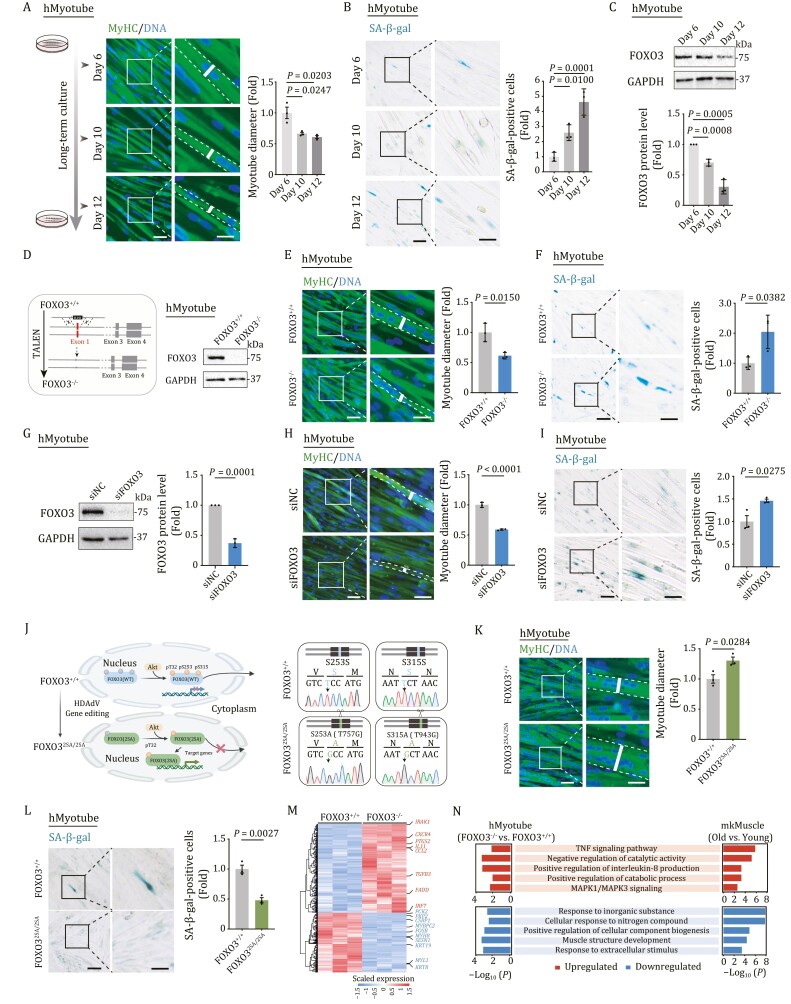
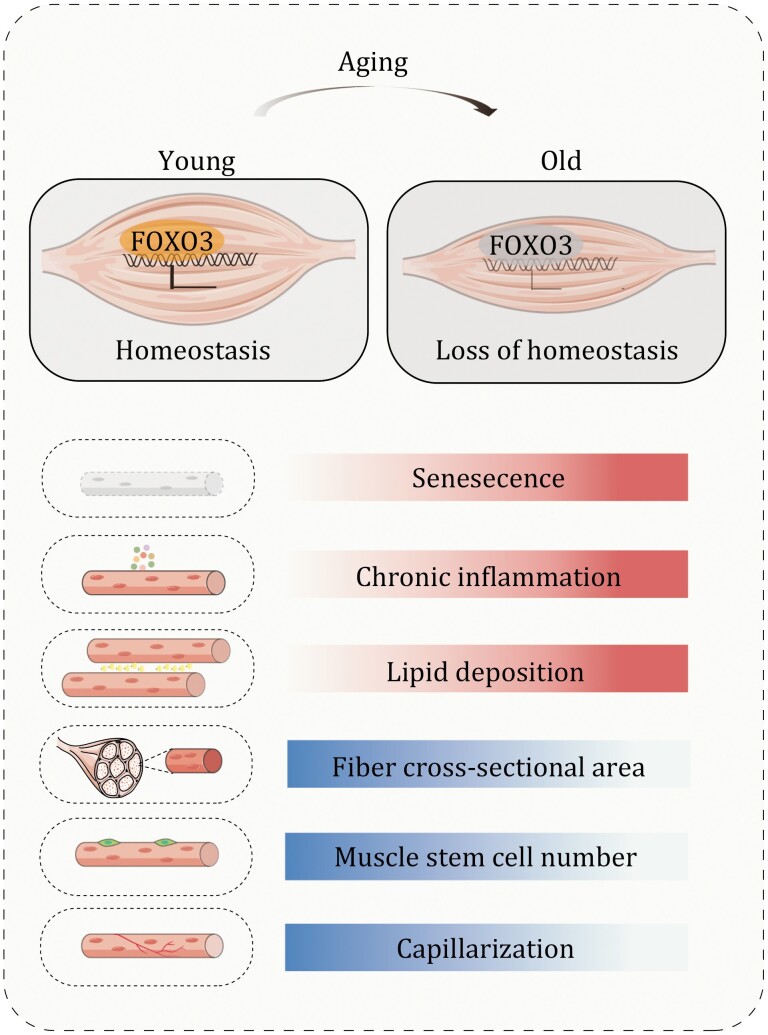
Age-dependent loss of skeletal muscle mass and function is a feature of sarcopenia, and increases the risk of many aging-related metabolic diseases. Here, we report phenotypic and single-nucleus transcriptomic analyses of non-human primate skeletal muscle aging. A higher transcriptional fluctuation was observed in myonuclei relative to other interstitial cell types, indicating a higher susceptibility of skeletal muscle fiber to aging. We found a downregulation of FOXO3 in aged primate skeletal muscle, and identified FOXO3 as a hub transcription factor maintaining skeletal muscle homeostasis. Through the establishment of a complementary experimental pipeline based on a human pluripotent stem cell-derived myotube model, we revealed that silence of FOXO3 accelerates human myotube senescence, whereas genetic activation of endogenous FOXO3 alleviates human myotube aging. Altogether, based on a combination of monkey skeletal muscle and human myotube aging research models, we unraveled the pivotal role of the FOXO3 in safeguarding primate skeletal muscle from aging, providing a comprehensive resource for the development of clinical diagnosis and targeted therapeutic interventions against human skeletal muscle aging and the onset of sarcopenia along with aging-related disorders.

Keywords: FOXO3; aging; primate; single-nucleus RNA sequencing; skeletal muscle.


Conflict of interest statement

The authors declare no competing interests.

Figures

Figure 1
Figure 1
Characterization of aging-related phenotypes in cynomolgus monkey skeletal muscle. (A) Workflow showing the procedure of phenotypic analysis, snRNA-seq, bulk RNA-seq of young and old monkey skeletal muscles and functional verification of core factors during aging. (B) Cross-sectional area of muscle fibers and relative central nuclei percentage from young and old monkeys. Representative images are shown on the left. Scale bars, 50 and 25 μm (zoomed-in image). Middle, the quantitative data for the cross-sectional area of myofibers are presented as mean ± SD. n = 8 monkeys for each group. Two hundred fibers were calculated for each individual. Right, the percentages of central nuclei were quantified as fold changes in old skeletal muscles vs. in young counterparts and are presented as mean ± SEMs. n = 8 monkeys for each group. Arrows indicate central nuclei in skeletal muscle. (C) Cross sections of skeletal muscle stained with antibodies specific for Fast IIX (marked by MYH1), Fast IIA (marked by MYH2), and Slow I fibers (marked by MYH7). Representative images are shown on the left. Scale bar, 100 μm. The percentages of each fiber type were quantified separately as fold changes in old skeletal muscles vs. in young counterparts and are presented as mean ± SEMs on the right. n = 8 monkeys for each group. (D) Oil Red O staining of muscle cross sections from young and old monkeys. Scale bars, 200 and 50 μm (zoomed-in image). Oil Red O-positive areas were quantified as fold changes in old skeletal muscles vs. in young counterparts and are presented as mean ± SEMs on the right. n = 8 monkeys for each group. (E) TUNEL staining in the skeletal muscles from young and old monkeys. Representative images are shown on the left. Scale bars, 50 and 10 μm (zoomed-in image). The numbers of TUNEL-positive nuclei were quantified as fold changes in old skeletal muscles vs. in young counterparts and are presented as mean ± SEMs on the right. n = 8 monkeys for each group. Arrows indicate TUNEL-positive nuclei in skeletal muscle. (F) Lamin B1 immunofluorescence staining in the skeletal muscles from young and old monkeys. Representative images are shown on the left. Scale bars, 50 and 10 μm (zoomed-in image). The fluorescence intensity of Lamin B1 was quantified as fold changes in old skeletal muscles vs. in young counterparts and are presented as mean ± SEMs on the right. n = 8 monkeys for each group. Arrows indicate Lamin B1-positive nuclei in skeletal muscle. (G) H3K9me3 immunohistochemical staining in skeletal muscles from young and old monkeys. Representative images are shown on the left. Scale bars, 50 and 25 μm (zoomed-in image). The numbers of H3K9me3-positive nuclei were quantified as fold changes in old skeletal muscles vs. in young counterparts and are presented as mean ± SEMs on the right. n = 8 monkeys for each group. (H) Analysis of terminal buttons in the NMJ by immunofluorescence staining of neurofilament in young and old monkeys. Representative images are shown on the left. Scale bar, 25 μm. The numbers of terminal buttons in the NMJ in fixed regions were quantified as fold changes in old skeletal muscles vs. in young counterparts and are presented as mean ± SEMs on the right. n = 8 monkeys for each group. (I) Left, volcano plot showing the relative expression levels of DEGs between old and young (O/Y) monkey skeletal muscles. Right, representative Gene Ontology (GO) terms and corresponding DEGs.
Figure 2.
Figure 2.
Single-nucleus transcriptomic atlas of cynomolgus monkey skeletal muscle aging. (A) Uniform manifold approximation and projection (UMAP) plot showing the 14 cell types of monkey skeletal muscle. Cells are annotated to the right. PMF, postsynaptic muscle fiber; tSC, terminal Schwann cell; MuSC, muscle stem cell; Fib/FAP, Fibroblast/fibro-adipogenic progenitor; Tendo, Tendon fibroblast; SMC, Smooth muscle cell; EC, Endothelial cell; Mac, Macrophage. UMAP plot in the lower left showing the distribution of cells from young and old groups. (B) Dot plot showing the expression signatures of representative marker genes for each cell type. (C) Left, heatmap showing the expression profiles of top 50 genes ranked by LogFC of each cell type. Right, enriched GO terms for marker genes of each cell type. (D) Sankey plot showing the distribution of young and aged cells across different cell types. Pie plots showing the relative cell proportion of between old and young groups across different cell types. (E) PAX7 immunohistochemical staining in skeletal muscles from young and old monkeys. Representative images are shown on the left. Scale bars, 20 and 5 μm (zoomed-in image). The numbers of PAX7-positive cells were quantified as fold changes in old skeletal muscles vs. in young counterparts and the quantitative data are presented as mean ± SEMs on the right. n = 8 monkeys for each group. Arrows indicate PAX7-positive cells in skeletal muscle. (F) VWF immunofluorescence staining in skeletal muscles from young and old monkeys. Representative images are shown on the left. Scale bars, 50 and 25 μm (zoomed-in image). The numbers of VWF-positive cells were quantified as fold changes in old skeletal muscles vs. in young counterparts and are presented as mean ± SEMs on the right. n = 8 monkeys for each group. Arrows indicate VWF-positive cells in skeletal muscle.
Figure 3.
Figure 3.
Cell type-specific transcriptional alterations during cynomolgus monkey skeletal muscle aging. (A) Scatter plot showing the log2 ratio of transcriptional noise between old and young samples as calculated using sample averages (n = 16) and single cells on the X and Y axes, respectively. (B) Circos plots showing the aging-related differentially expressed genes (O/Y) DEGs, adjusted P values < 0.05 and |LogFC| > 0.25 for each cell type between old and young groups. Each connecting curve represents a gene up- or downregulated in two cell types. The number of DEGs for each cell type is also annotated. (C and D) Bar charts showing the enriched GO terms for upregulated (C) or downregulated (D) DEGs between old and young groups across different cell types in monkey skeletal muscle. (E) Heatmap showing the DEGs included in Aging Atlas database. (F) Network plot showing the DEGs associated with aging-related muscle diseases. The node size of genes indicates the number of cell types in which this gene was differentially expressed with age. The genes in the circle with a dashed line are associated with at least two kinds of diseases.
Figure 4.
Figure 4.
Transcriptional network pinpoints FOXO3 as a crucial transcription factor in regulating primate skeletal muscle aging. (A) Network visualization of downregulated core transcriptional regulators in different cell types between old and young groups. Outer nodes display different cell types and the node size positively correlates with the number of target genes differentially expressed in corresponding cell types. (B) Box plots showing FOXO3 mRNA expression level across different cell types in monkey skeletal muscles from old and young groups. (C) RT-qPCR analysis showing the FOXO3 mRNA expression changes in young and old monkey skeletal muscles. FOXO3 mRNA levels were quantified as fold changes (old vs. young), and are presented as mean ± SEMs. n = 8 monkeys for each group. (D) RNA-FISH assay showing the FOXO3 expression changes in young and old monkey skeletal muscle tissues. Representative images are shown on the left. Scale bars, 20 and 10 μm (zoomed-in image). Right, fluorescence intensity of FOXO3 pre-mRNA level was quantified as fold changes (old vs. young) and are presented as mean ± SEMs. n = 8 monkeys for each group. (E) Western blot and band intensity quantification of FOXO3 protein levels in young and old monkey skeletal muscle samples. Data were quantified as fold changes in old skeletal muscles vs. in young counterparts and are presented as mean ± SEMs. n = 8 monkeys for each group. (F) Left, western blot and band intensity quantification of FOXO3 protein levels in human skeletal muscle samples. GAPDH was used as the loading control. Middle, bar plot showing the relative expression of FOXO3 protein levels for each individual. Right, the negative correlation of relative FOXO3 protein levels in skeletal muscle across different ages. The shadow indicates the 0.95 confidence interval around smooth. n = 7 donors. (G) Western blot and band intensity quantification of phospho-FOXO3 protein levels in young and old monkey skeletal muscle samples. Data were quantified as fold changes in old skeletal muscles vs. in young counterparts and are presented as mean ± SEMs. n = 8 monkeys for each group. (H) Ridge map showing the global distribution density of gene set score of FOXO3 target genes identified by SCENIC. The corresponding dashed line represents the peak position of each group. (I) Box plot showing the gene set score of FOXO3 target genes across each cell type of monkey muscles from old and young groups. (J) Bar plot showing representative GO terms of downregulated FOXO3 target genes. (K) Network visualization of FOXO3 target genes in Slow I, Fast IIA, Fast IIX, PMF, MuSC, and Fib/FAP cell types. Node size positively correlates with the number of cell types. Each connecting line represents gene differentially expressed in the corresponding cell type.
Figure 5.
Figure 5.
FOXO3 protects human myotubes from senescence. (A) Left, representative immunofluorescence images of MyHC-positive hMyotube after long-term culture for 6, 10, and 12 days. Scale bars, 50 and 25 μm (zoomed-in image). Right, the diameters of the hMyotubes were quantified as fold changes in hMyotubes at Day 10 or Day 12 vs. at Day 6, and are shown as mean ± SEMs. n = 3 biological replicates. (B) Left, representative images of SA-β-gal-positive cells of WT hMyotubes after a long-term culture for 6, 10, and 12 days. Scale bars, 100 and 50 μm (zoomed-in image). Right, SA-β-gal-positive cells of the myotubes were quantified as fold changes in hMyotubes at Day 10 or Day 12 vs. at Day 6, and are presented as mean ± SEMs. n = 3 biological replicates. (C) Western blot analysis showing the protein levels of FOXO3 in WT hMyotubes after a long-term culture for 6, 10, and 12 days. GAPDH was used as the loading control. Band intensity were quantified as fold changes in hMyotubes at Day 10 or Day 12 vs. at Day 6 and are presented as mean ± SEMs. n = 3 independent experiments. (D) Left, schematic showing siRNA-mediated knockdown of FOXO3 in WT hMyotubes. Right, Western blot analysis of FOXO3 protein expression in FOXO3+/+ and FOXO3−/− hMyotubes. GAPDH was used as the loading control. (E) MyHC immunofluorescence staining in FOXO3+/+ and FOXO3−/− hMyotubes. Representative images are shown on the left. Scale bars, 50 and 25 μm (zoomed-in image). Right, the diameters of the hMyotubes were quantified as fold changes (FOXO3−/− vs. FOXO3+/+) and are presented as mean ± SEMs. n = 3 biological replicates. (F) Left, representative SA-β-gal staining images of FOXO3+/+ and FOXO3−/− hMyotubes. Scale bars, 100 and 50 μm (zoomed-in image). Right, SA-β-gal-positive cells of the myotubes were quantified as fold changes (FOXO3−/− vs. FOXO3+/+) and are presented as mean ± SEMs. n = 3 biological replicates. (G) Western blot showing the protein levels of FOXO3 in hMyotubes upon the knockdown of FOXO3. GAPDH was used as the loading control. Band intensity were quantified as fold changes (si-FOXO3 vs. si-NC) and are presented as mean ± SEMs. n = 3 independent experiments. (H) MyHC immunofluorescence staining of the hMyotubes transfected with si-NC or si-FOXO3. Representative images are shown on the left. Scale bars, 50 and 25 μm (zoomed-in image). The diameters of hMyotubes were quantified as fold changes (si-FOXO3 vs. si-NC) and are presented as mean ± SEMs on the right. n = 3 biological replicates. (I) SA-β-gal-positive cells of the hMyotubes transfected with si-NC or si-FOXO3. Representative images are shown on the left. Scale bars, 100 and 50 μm (zoomed-in image). Data were quantified as fold changes (si-FOXO3 vs. si-NC) and are presented as mean ± SEMs on the right. n = 3 biological replicates. (J) Left, the schematic shows that edited FOXO3 [FOXO3(2SA)] cannot be phosphorylated by AKT and is constitutively activated in the nucleus. Right, DNA sequencing demonstrates base conversion in FOXO32SA/2SA hMyotubes. The base conversion of T757G and T943G in genomic DNA results in the change of S253A and S315A in the protein sequence, respectively. (K) MyHC immunofluorescence staining in FOXO3+/+ and FOXO32SA/2SA hMyotubes. Representative images are shown on the left. Scale bars, 50 and 25 μm (zoomed-in image). The diameters of hMyotubes were quantified as fold changes (FOXO32SA/2SA vs. FOXO3+/+) and are presented as mean ± SEMs on the right. n = 3 biological replicates. (L) Left, representative SA-β-gal staining images of FOXO3+/+ and FOXO32SA/2SA hMyotubes. Scale bars, 100 and 50 μm (zoomed-in image). Right, SA-β-gal-positive myotubes were quantified as fold changes (FOXO32SA/2SA vs. FOXO3+/+) and are presented as mean ± SEMs. n = 3 biological replicates. (M)Heatmap showing the expression levels of DEGs between FOXO3−/− and FOXO3+/+ hMyotubes based on RNA-seq analysis. (N) GO terms shared by aging-associated DEGs in monkey skeletal muscle (mkMuscle) and DEGs between FOXO3−/− and FOXO3+/+ hMyotubes.
Figure 6.
Figure 6.
Working model. A schematic illustration showing the phenotypic and transcriptomic signatures of primate skeletal muscle aging.

References

    1. Aibar S, González-Blas CB, Moerman Tet al. . SCENIC: single-cell regulatory network inference and clustering. Nat Methods 2017;14:1083–1086. - PMC - PubMed
    1. Anders S, Pyl PT, Huber W.. HTSeq--a Python framework to work with high-throughput sequencing data. Bioinformatics 2015;31:166–169. - PMC - PubMed
    1. Anderson RM, Colman RJ.. Prospects and perspectives in primate aging research. Antioxid Redox Signal 2011;14:203–205. - PMC - PubMed
    1. Angelidis I, Simon LM, Fernandez IEet al. . An atlas of the aging lung mapped by single cell transcriptomics and deep tissue proteomics. Nat Commun 2019;10:963. - PMC - PubMed
    1. Askanas V, Engel WK.. Inclusion-body myositis, a multifactorial muscle disease associated with aging: current concepts of pathogenesis. Curr Opin Rheumatol 2007;19:550–559. - PubMed

Publication types

Substances